@Nicolas I’ll sure do in the future! btw will the “fork” keep on coming back in the forum from now on? 🙂
Ale, I am not able to make the London Gas Oil profitable on a 1D TF 🙁
Cheers Kasper
Hi!
I made a quick on soyabeens, but there is not enough data.
Is there somwhere you can find a list with how much data every ig instrument have?
And also i think we should compare the spread with how many points/pips the instrument have.
maybe like ex this?
Dax Spread 1 / Close 12060 * 0.1% = 0.08
omx spread 0.5 / Close 1590*0,1% =0,31 3,18
Gold spred 0.3 / Close *0,1% = 0,234
Henrik
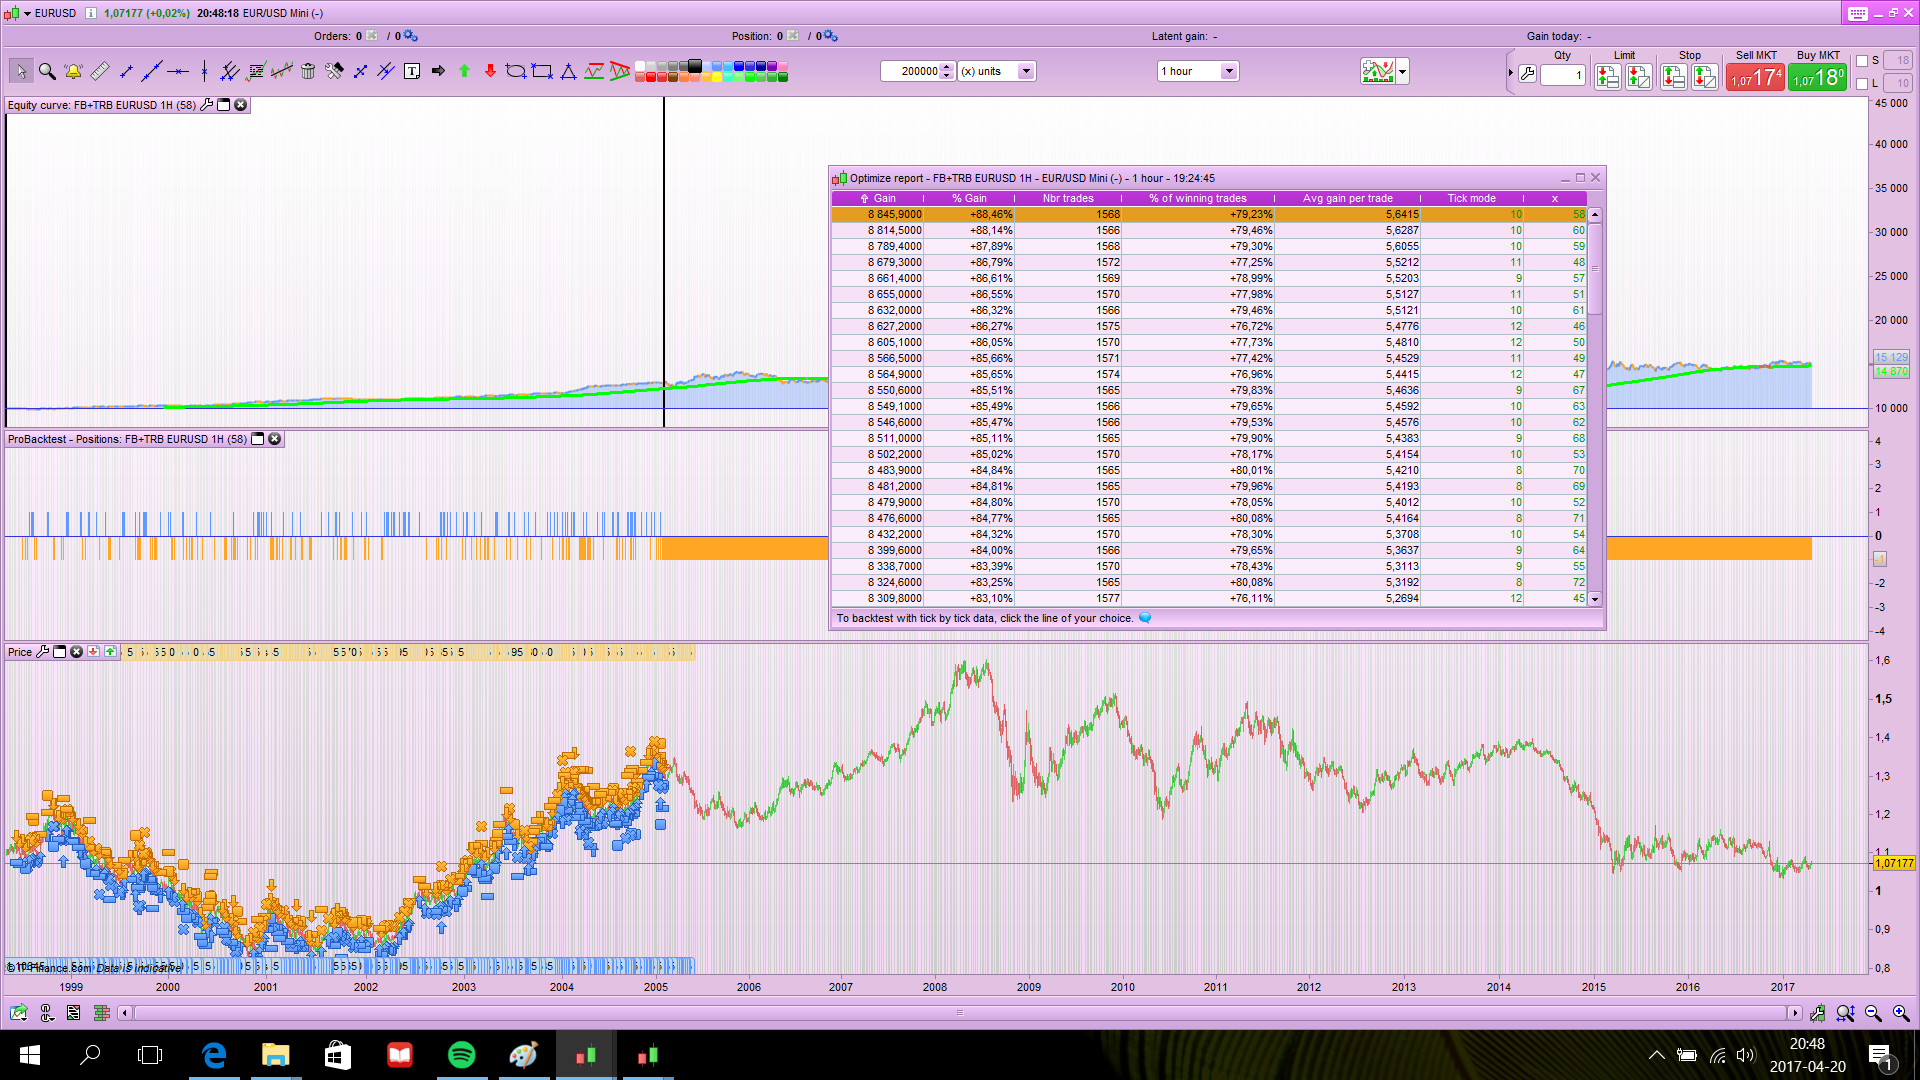
I also did a SL test on the new one. (FB+TRB EURUSD 1H)
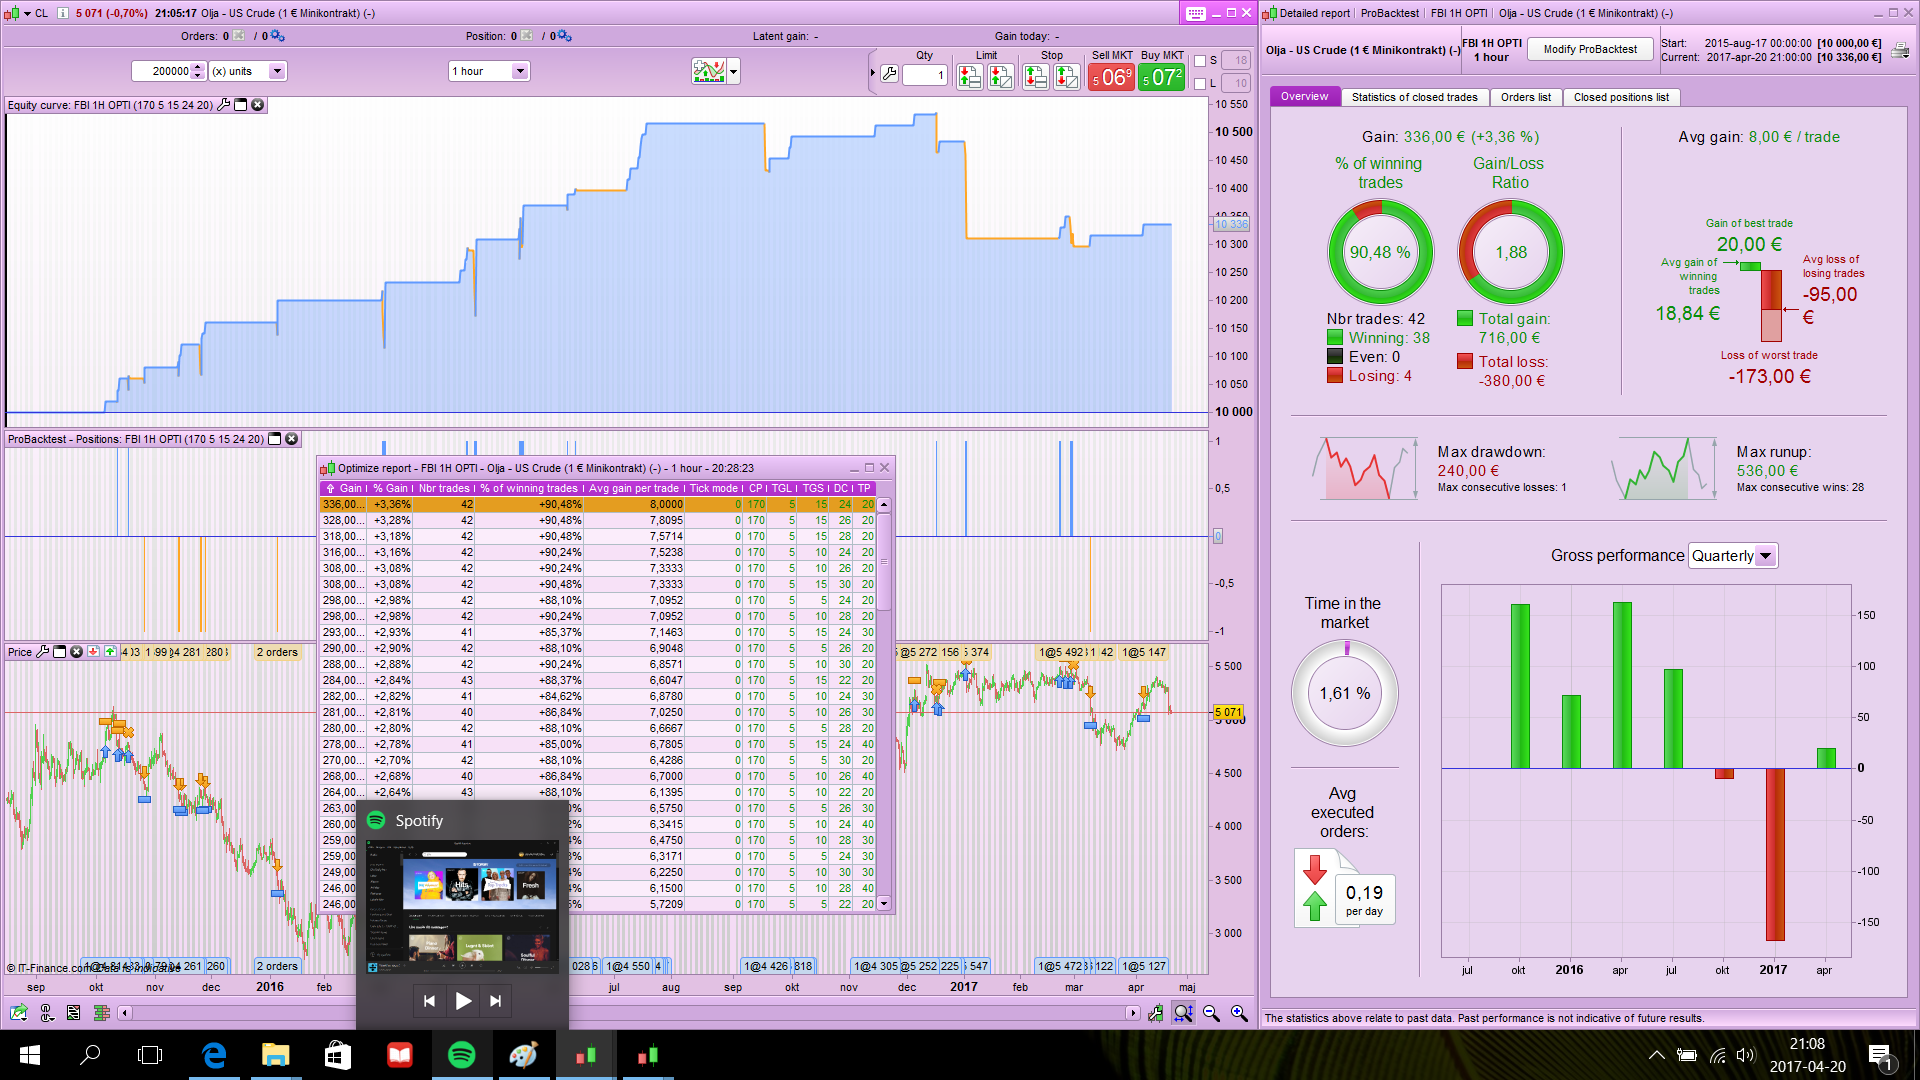
And one on FBI OPTI on us crude mini.
I made a few opti changes to FB+TRB EURUSD 1H and set it going Live, it triggered a short at 19.00 (UTC+1 :)) at 10718.
In my opinion EUR/USD is just hovering around a Fib retracement of about 75% and so after watching it hover in and out of profit for 1 hour I killed the Trade / System.
The True Range Breakout triggers short after 2 red bars (and vice versa) … a lot can happen in 2 x 1 hour bars esp on a retrace and the 3rd bar may just see it reverse. If we could ‘code out’ triggers on Fib retraces then we likely get better results.
Having said all that, sod’s law will prove me wrong and I’ll be kicking myself tomorrow!? 🙂
GraHal
Thanks everyone for your great work, just 2 words about optimisation:
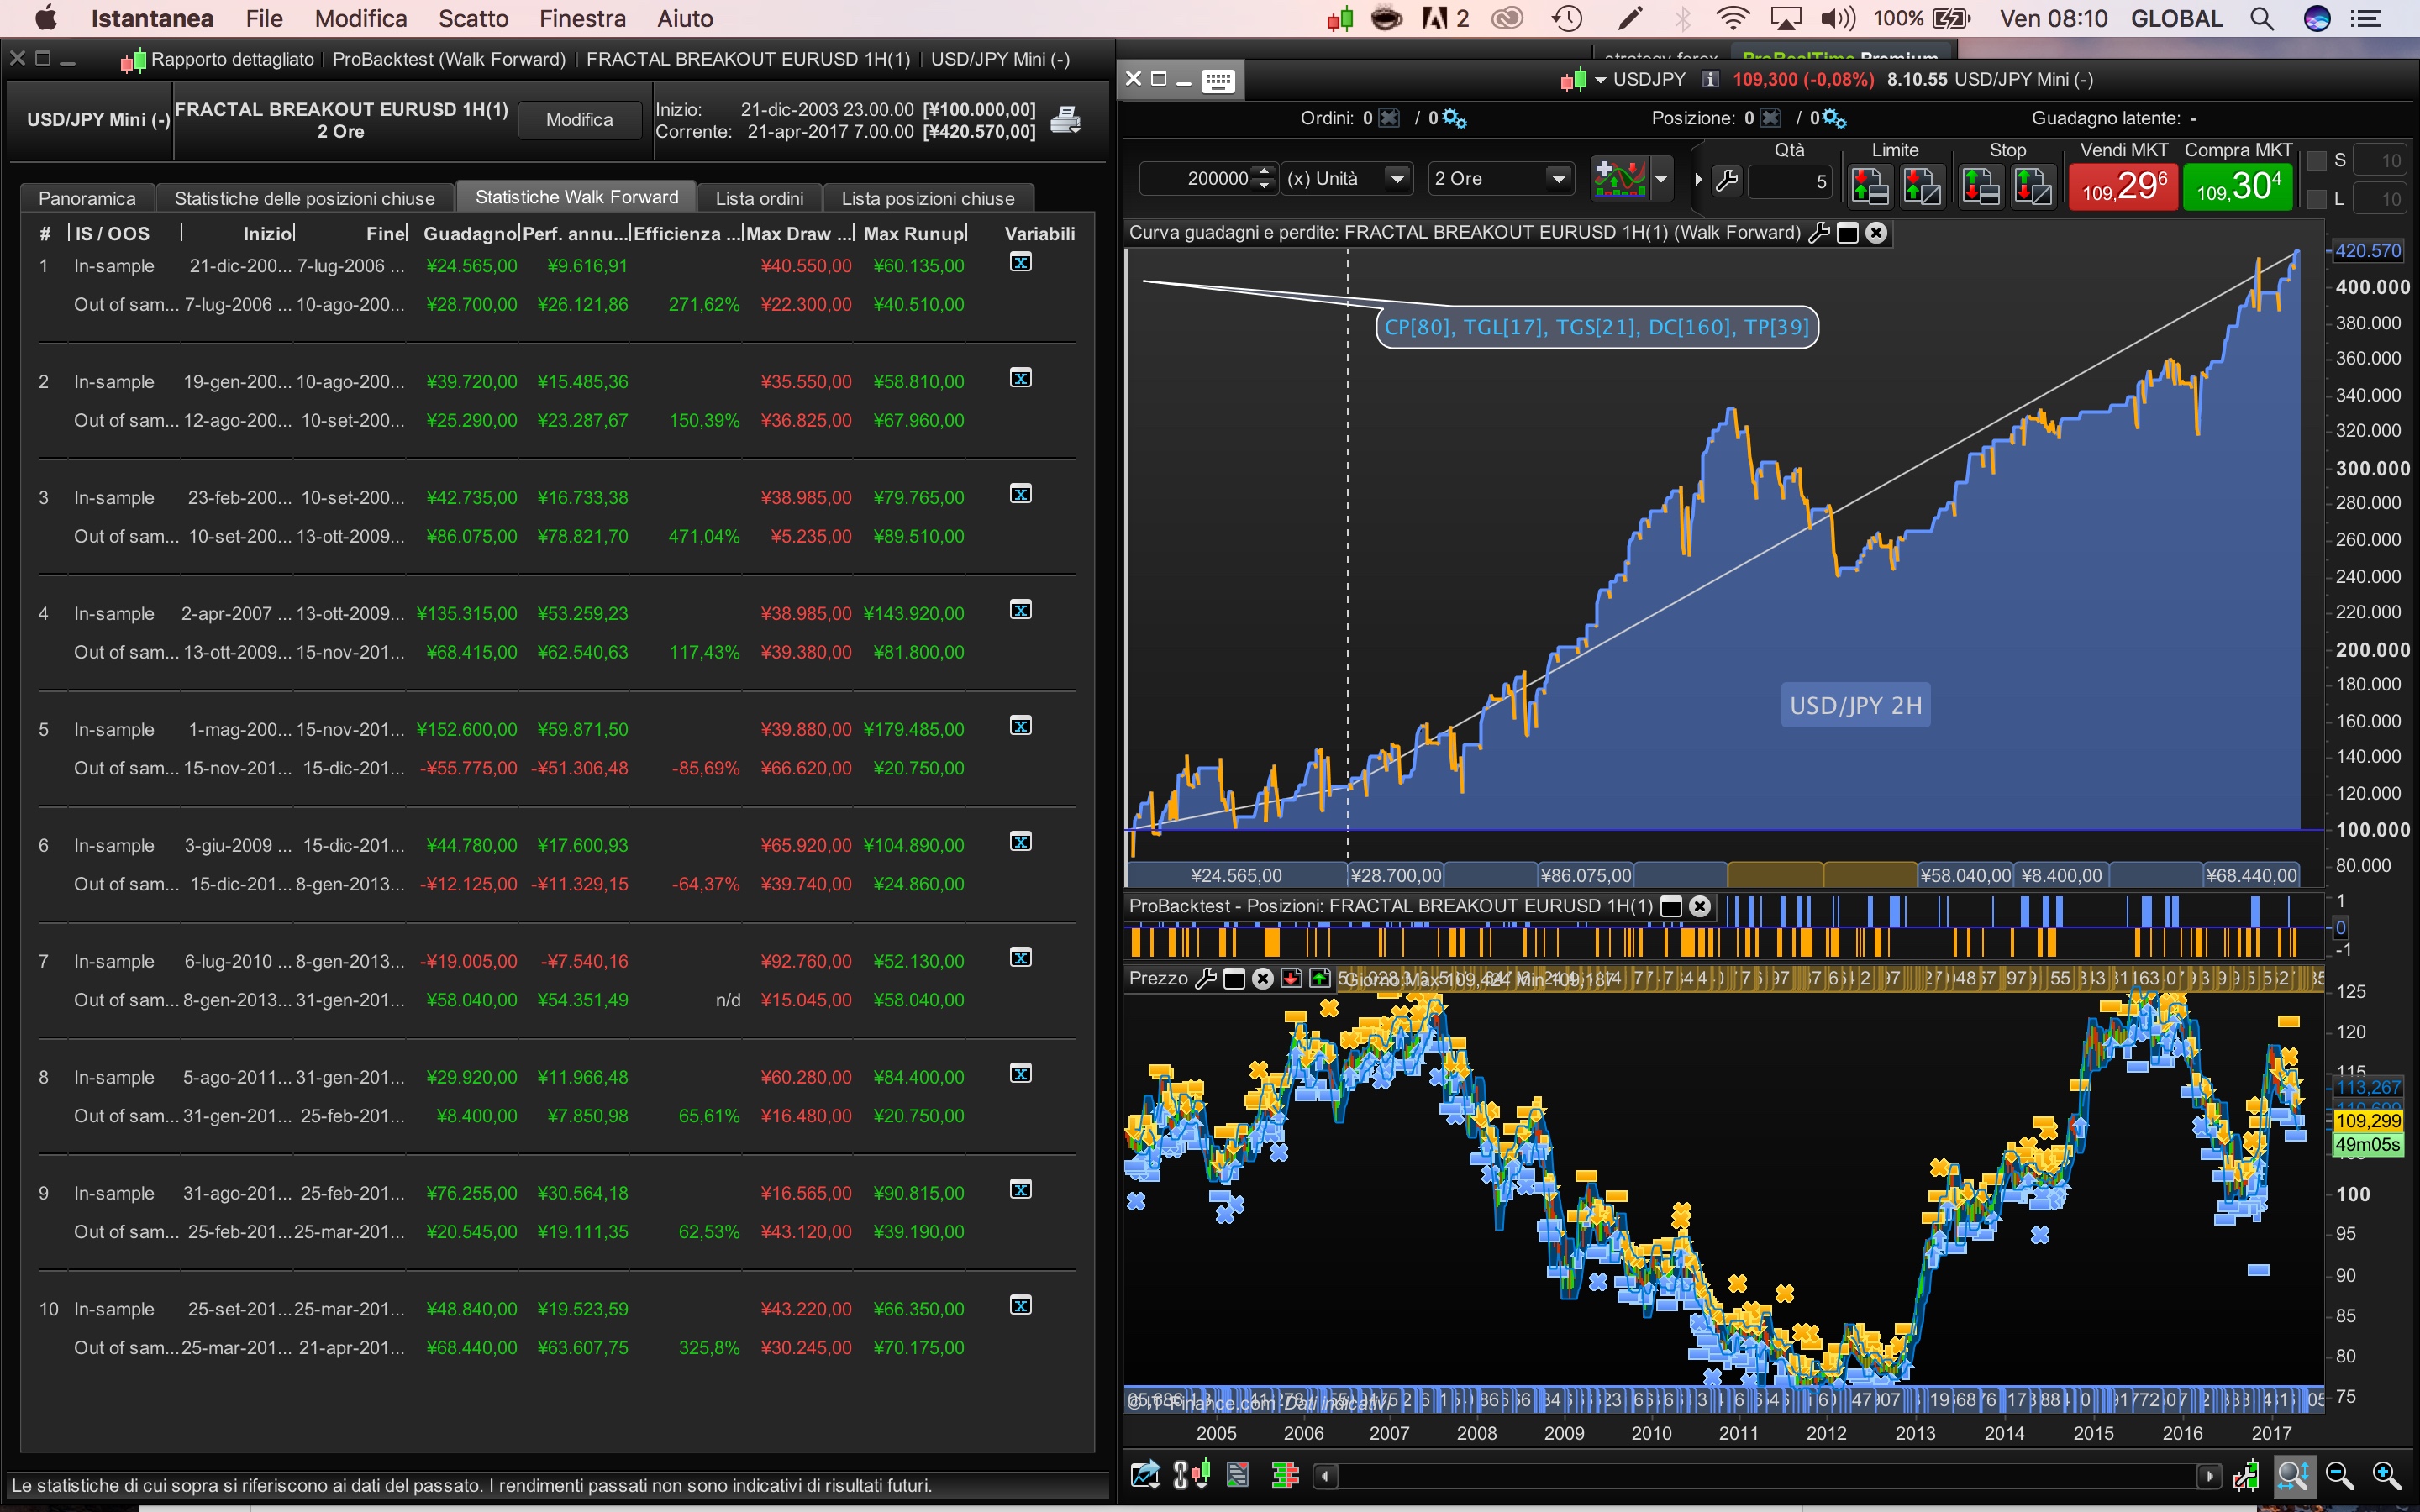
If an OOS period of the walk forward test is making too much profit comparing to the IS period, this is not so good. To be clear, the WFE (walk forward efficiency) must be superior to 50% (made at least 50% annualized profit than the In Sample period), but if it made.. let’s say 300%, this is something you couldn’t expect because it is not the “normal” behaviour of the optimised period (IS). Of course you would have been pleased by this result in real life, but your strategy were not designed to make so much profit! so it is not “normal”.
So that’s where the optimisation fail, because it always gives the best $ result at the end, in its current version though..
Anyway, I know it is always great to have good looking equity curve, but it’s only a line drawn on your computer screen, there’s so much more useful informations in the numbers.
Good point Nicolas! I think I red that you should use the values from the last section in the WFT, but would it not be better from a robustness view to use a combination of values in between the different values given in the WFT? Which makes the focus less concentrated to a specific period? (It’s just a thought I had)
 ALE
ALEModerator
Master
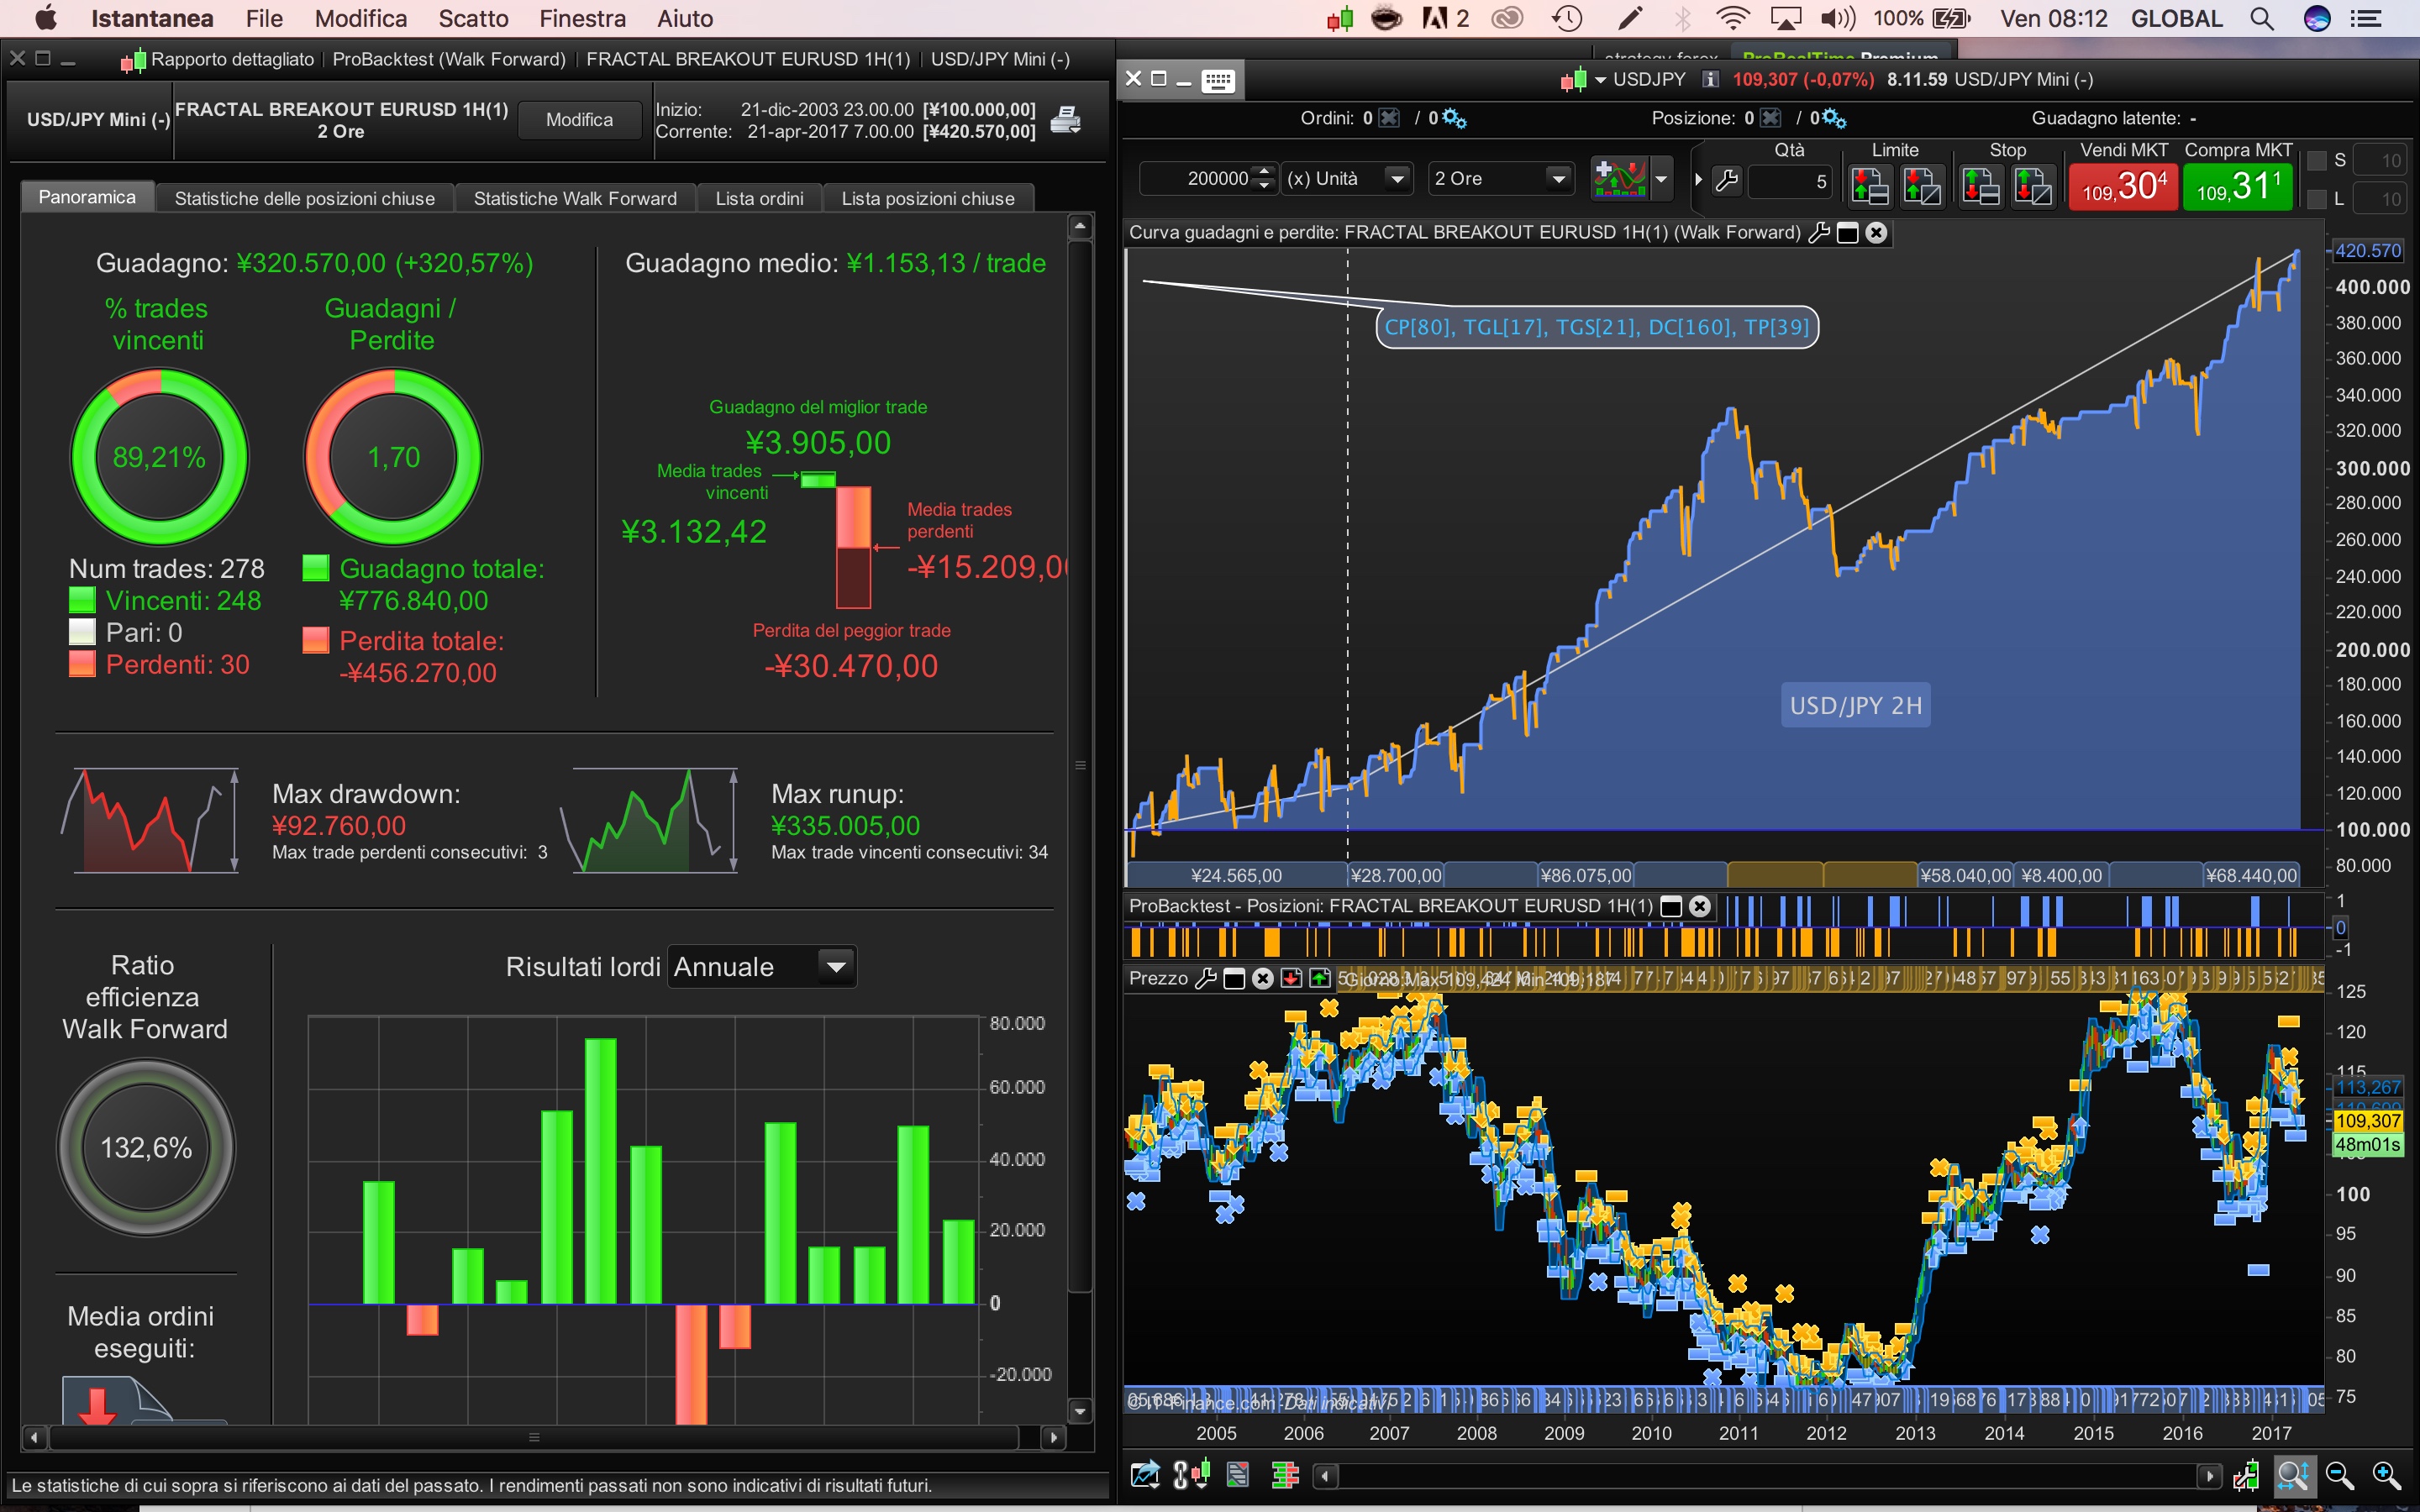
To be clear I’ve share USDJPY only to note a possible range of variables number to start, and as example of more time frame available. Obviously 89% trade winner and 1.70 ratio is not bad, but It’s not wel balanced as we read Drawdown and Maxrunup or gain, or equity line or WF. Just an example
Thanks ALE, it doesn’t mean the strategy is not good (because we already know it is), but something optimised during IS period add a bias into the whole test to give the equity curve the most profit at the end.
Good point Nicolas! I think I red that you should use the values from the last section in the WFT, but would it not be better from a robustness view to use a combination of values in between the different values given in the WFT? Which makes the focus less concentrated to a specific period? (It’s just a thought I had)
Yes and .. no! First point you are right because the last optimised variables from your walk forward analysis are the most recent ones (if your last OOS period end recently). Second point is wrong for the same reason that you are right on the first point, because if your WF analysis told you that optimisation should be run every X months, then your last values should be the best ones to keep.. But of course, no one will never know what could be the future.
The robustness feeling about a strategy come from the fact that an optimised one has performed well in real life trading, and that’s exactly what the WF simulation is doing, X times (IS+OOS) in the past. Even 1 OOS period could lead to think that a strategy is robust, but if it performs X times well in Out Of Sample periods (compared to IS periods behaviour) then it is more robust than robust 🙂
Nicolas, to save your time and fingers, have you got a link to explain how I know the … WF analysis told you that optimisation should be run every X months … even if in French I can use Chrome translate?
Thank You
GraHal
@Grahal
Quite simply, considering that a 70/30% walk forward test has been validated X times over the whole period of the backtest. We conclude from what I said above, namely: optimisation should be run every X months.
The conclusions can be drawn from this type of analysis, as for a traditional optimization. There is no true and absolute truth in trading, one knows only too well! 🙂