Drawing a coloured Rectangle

Viewing 10 posts - 1 through 10 (of 10 total)

  • Author
    Posts
  • #213438 quote
    Kole96Kole96
    Participant
    New

    Hi, can anyone help me building a code for drawing a rectangle and color it or just 2 lines with colored area in between?

    Thank you in advance

    #213440 quote
    Kole96Kole96
    Participant
    New

    Just made this one, can you help to Stop the last Rectangle when a new one is formed?


    TopImbalance = low[2] <= open[1] and high[0] >= close[1]
    TopImbalancesize = low[2] - high[0]
    if TopImbalance and TopImbalancesize > 0 then
    drawcandle(low[2], low[2], high[0], high[0]) coloured(255,255,0)
    if Tracage then
    drawrectangle(BarIndex[2],low[2],BarIndex + 10,high[0])coloured (255,204,204,255) bordercolor(204,0,0)
    endif
    endif
    BottomInbalance = high[2] >= open[1] and low[0] <= close[1]
    BottomInbalancesize = low[0] - high[2]
    if BottomInbalance and BottomInbalancesize > 0 then
    drawcandle(low[0], low[0], high[2], high[2]) coloured(255,255,0)
    if Tracage then
    
    drawrectangle(BarIndex[2],high[2],BarIndex + 10,low[0]) coloured(204,255,204,255) bordercolor(0,204,0)
    endif
    endif
     
    return
    
    
    #213460 quote
    robertogozzirobertogozzi
    Moderator
    Legend

    Add this line at the very beginning of your code:

    Defparam DrawOnLastBarOnly = True
    #213535 quote
    Kole96Kole96
    Participant
    New

    Thank you

    I have 2 questions:

    1. How to limite a nombre of rectangle drawing in the past instead of having only the last?

    For example to have the last 10 rectangle only?

    2) How can i display a rectangle for example of a 15 minutes time frame in a 2 minutes chart?

    #213544 quote
    NicolasNicolas
    Keymaster
    Legend

    1/ Must use arrays for that: store each of the coordinates of the rectangle into different variables arrays and plot them in the past from the last candle.

    (I’m looking for an example in the forum..)

    2/ use TIMEFRAME instruction to store the values from that timeframe only.

    #213546 quote
    Kole96Kole96
    Participant
    New

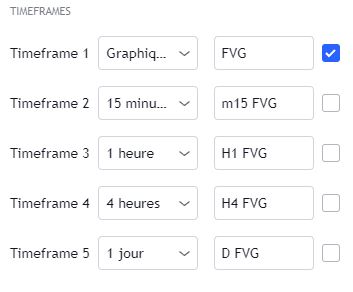
    So i have to declare the time frame

    timeframe(1 hour) for example, i want to declare variables true or false for different time frame

    for example in the picture below

    Different-timeframe.jpg Different-timeframe.jpg
    #213548 quote
    NicolasNicolas
    Keymaster
    Legend

    There is no way to create a condition block that embed the TIMEFRAME instruction. However there is a workaround with CALL, see complete discussion here: https://www.prorealcode.com/topic/condition-et-timeframe/

    #213553 quote
    NicolasNicolas
    Keymaster
    Legend

    Here is a draft version of the MTF indicator:

    defparam drawonlastbaronly=true 
    
    timeframe(default) //!!DO NOT CHANGE TIMEFRAME HERE!!
    ibar=max(1,barindex)
    
    timeframe(15 minutes,updateonclose) //<=== CHANGE TIMEFRAME HERE (default is for the current timeframe of the chart)
    //timeframe(default) //<== example with timeframe of the chart.
    //timeframe(1 hour,updateonclose) //<== example with timeframe 1-hour.
    //timemframe(1 day,updateonclose) //<== example with timeframe daily.
    
    TopImbalance = low[2] <= open[1] and high[0] >= close[1]
    TopImbalancesize = low[2] - high[0]
    if TopImbalance and TopImbalancesize > 0 then
    a=a+1
    $y1[a]=low[2]
    $y2[a]=high[0]
    $dir[a] = 1
    $x1[a]=ibar
    $x2[a]=ibar+10
    //drawrectangle(BarIndex[2],low[2],BarIndex + 10,high[0])coloured (255,204,204,255) bordercolor(204,0,0)
    endif
    BottomInbalance = high[2] >= open[1] and low[0] <= close[1]
    BottomInbalancesize = low[0] - high[2]
    if BottomInbalance and BottomInbalancesize > 0 then
    a=a+1
    $y1[a]=high[2]
    $y2[a]=low[0]
    $dir[a] = -1
    $x1[a]=ibar
    $x2[a]=ibar+10
    //drawrectangle(BarIndex[2],high[2],BarIndex + 10,low[0]) coloured(204,255,204,255) bordercolor(0,204,0)
    endif
    
    timeframe(default)
    if islastbarupdate and a>1 then 
    for i=a downto 1 do 
    if $dir[i]=1 then 
    drawrectangle($x1[i],$y1[i],$x2[i],$y2[i])coloured (255,204,204,255) bordercolor(204,0,0)
    elsif $dir[i]=-1 then 
    drawrectangle($x1[i],$y1[i],$x2[i],$y2[i])coloured (204,255,204,255) bordercolor(0,204,0)
    endif 
    next
    endif 
     
    return
    #213560 quote
    Kole96Kole96
    Participant
    New

    Thanks for the feedback, so I can't change line 6 by putting in place of the 15 minutes a variable that I can change manually? for example T

    #213573 quote
    NicolasNicolas
    Keymaster
    Legend

    In order to change the timeframe, change it at line 6 with any other ones, as described with the examples in the code 🙂

Viewing 10 posts - 1 through 10 (of 10 total)
  • You must be logged in to reply to this topic.

ProRealAI ProRealAI New

Stuck on this ProBuilder code?

Describe what this topic is trying to build, in plain English, and ProRealAI writes the ProRealTime™ indicator, screener or system for you.

Available in 7 languages
Try ProRealAI

Drawing a coloured Rectangle


ProBuilder: Indicators & Custom Tools

New Reply
Author
author-avatar
Kole96 @kole96 Participant
Summary

This topic contains 9 replies,
has 3 voices, and was last updated by NicolasNicolas

3 years, 5 months ago.

Topic Details
Forum: ProBuilder: Indicators & Custom Tools
Language: English
Started: 04/18/2023
Status: Active
Attachments: 1 files
ProRealCode ProRealCode
Loading...