I want to create an indicator to draw a box automatically on the chart around the candles that were outside the US session. The high and low of the box would be high and the low during those subsequent sessions (i.e., Asia & Europe) and the width would be from the start of the Asia session and the end of the Europe session. I would like the indicator to display the last 10 non-US sessions. Is this doable?
Here is my code which I’m not able to get to work.
startSession = 1700 // Start time for US futures trading session
endSession = 1515 // End time for US futures trading session (next day)
sessionsToCheck = 10 // Number of non-US futures trading sessions to check
for i = 1 to sessionsToCheck
startSession = Date() – i * 7 // Calculate start date for previous non-US futures trading session
endSession = Date() – (i – 1) * 7 // Calculate end date for previous non-US futures trading session
if dayofweek(startSession) = 5 then startSession = startSession – 1 // Adjust start date if it falls on a Saturday
if dayofweek(endSession) = 5 then endSession = endSession – 1 // Adjust end date if it falls on a Saturday
if time >= endSession or time < startSession then // Check if current bar is outside US futures trading session
if time >= endSession or time < startSession then // Check if current bar is outside previous non-US futures trading session
x1 = barindex – 1 // Set x-coordinate of top left corner of rectangle to one bar ago
y1 = max(high[x1], high[x1+1]) // Set y-coordinate of top left corner of rectangle to maximum of two previous highs
x2 = barindex // Set x-coordinate of bottom right corner of rectangle to current bar
y2 = min(low[x2], low[x2-1]) // Set y-coordinate of bottom right corner of rectangle to minimum of current low and previous low
DRAWRECTANGLE(x1, y1, x2, y2) colored(255, 0, 0) // Draw rectangle with red color
endif
endif
endfor
There are so many syntax errors.
Each IF must be closed by ENDIF (on separate lines).
ENDFOR doesn’t exits, replace it with NEXT.
[n] must be used to reference prior bars, instead of (). Within brackets 0 (or no brackets at all) means the current bar, any greater integer value means bars prior to the current one.
THEN can only be followed by comments (starting with // or REM), any other character must be on a separate line below it.
TIME must be a 6-digit value formatted as HHMMSS (SS is 00 for TFs >= 1 minute). Only leading 0s can be omitted (but for clarity I suggest to always use 6 digits).
This code should do:
DEFPARAM DrawOnLastBarOnly = true
startSession = 170000 // Start time for US futures trading session
endSession = 151500 // End time for US futures trading session (next day)
IF (OpenTime = StartSession) OR ((OpenTime > StartSession) AND (OpenTime[1] < StartSession)) THEN
Bar1 = BarIndex
HH = high
LL = low
ENDIF
IF (OpenTime >= StartSession) OR (OpenTime < EndSession) THEN
HH = max(HH,high)
LL = min(LL,low)
Bar2 = BarIndex
ENDIF
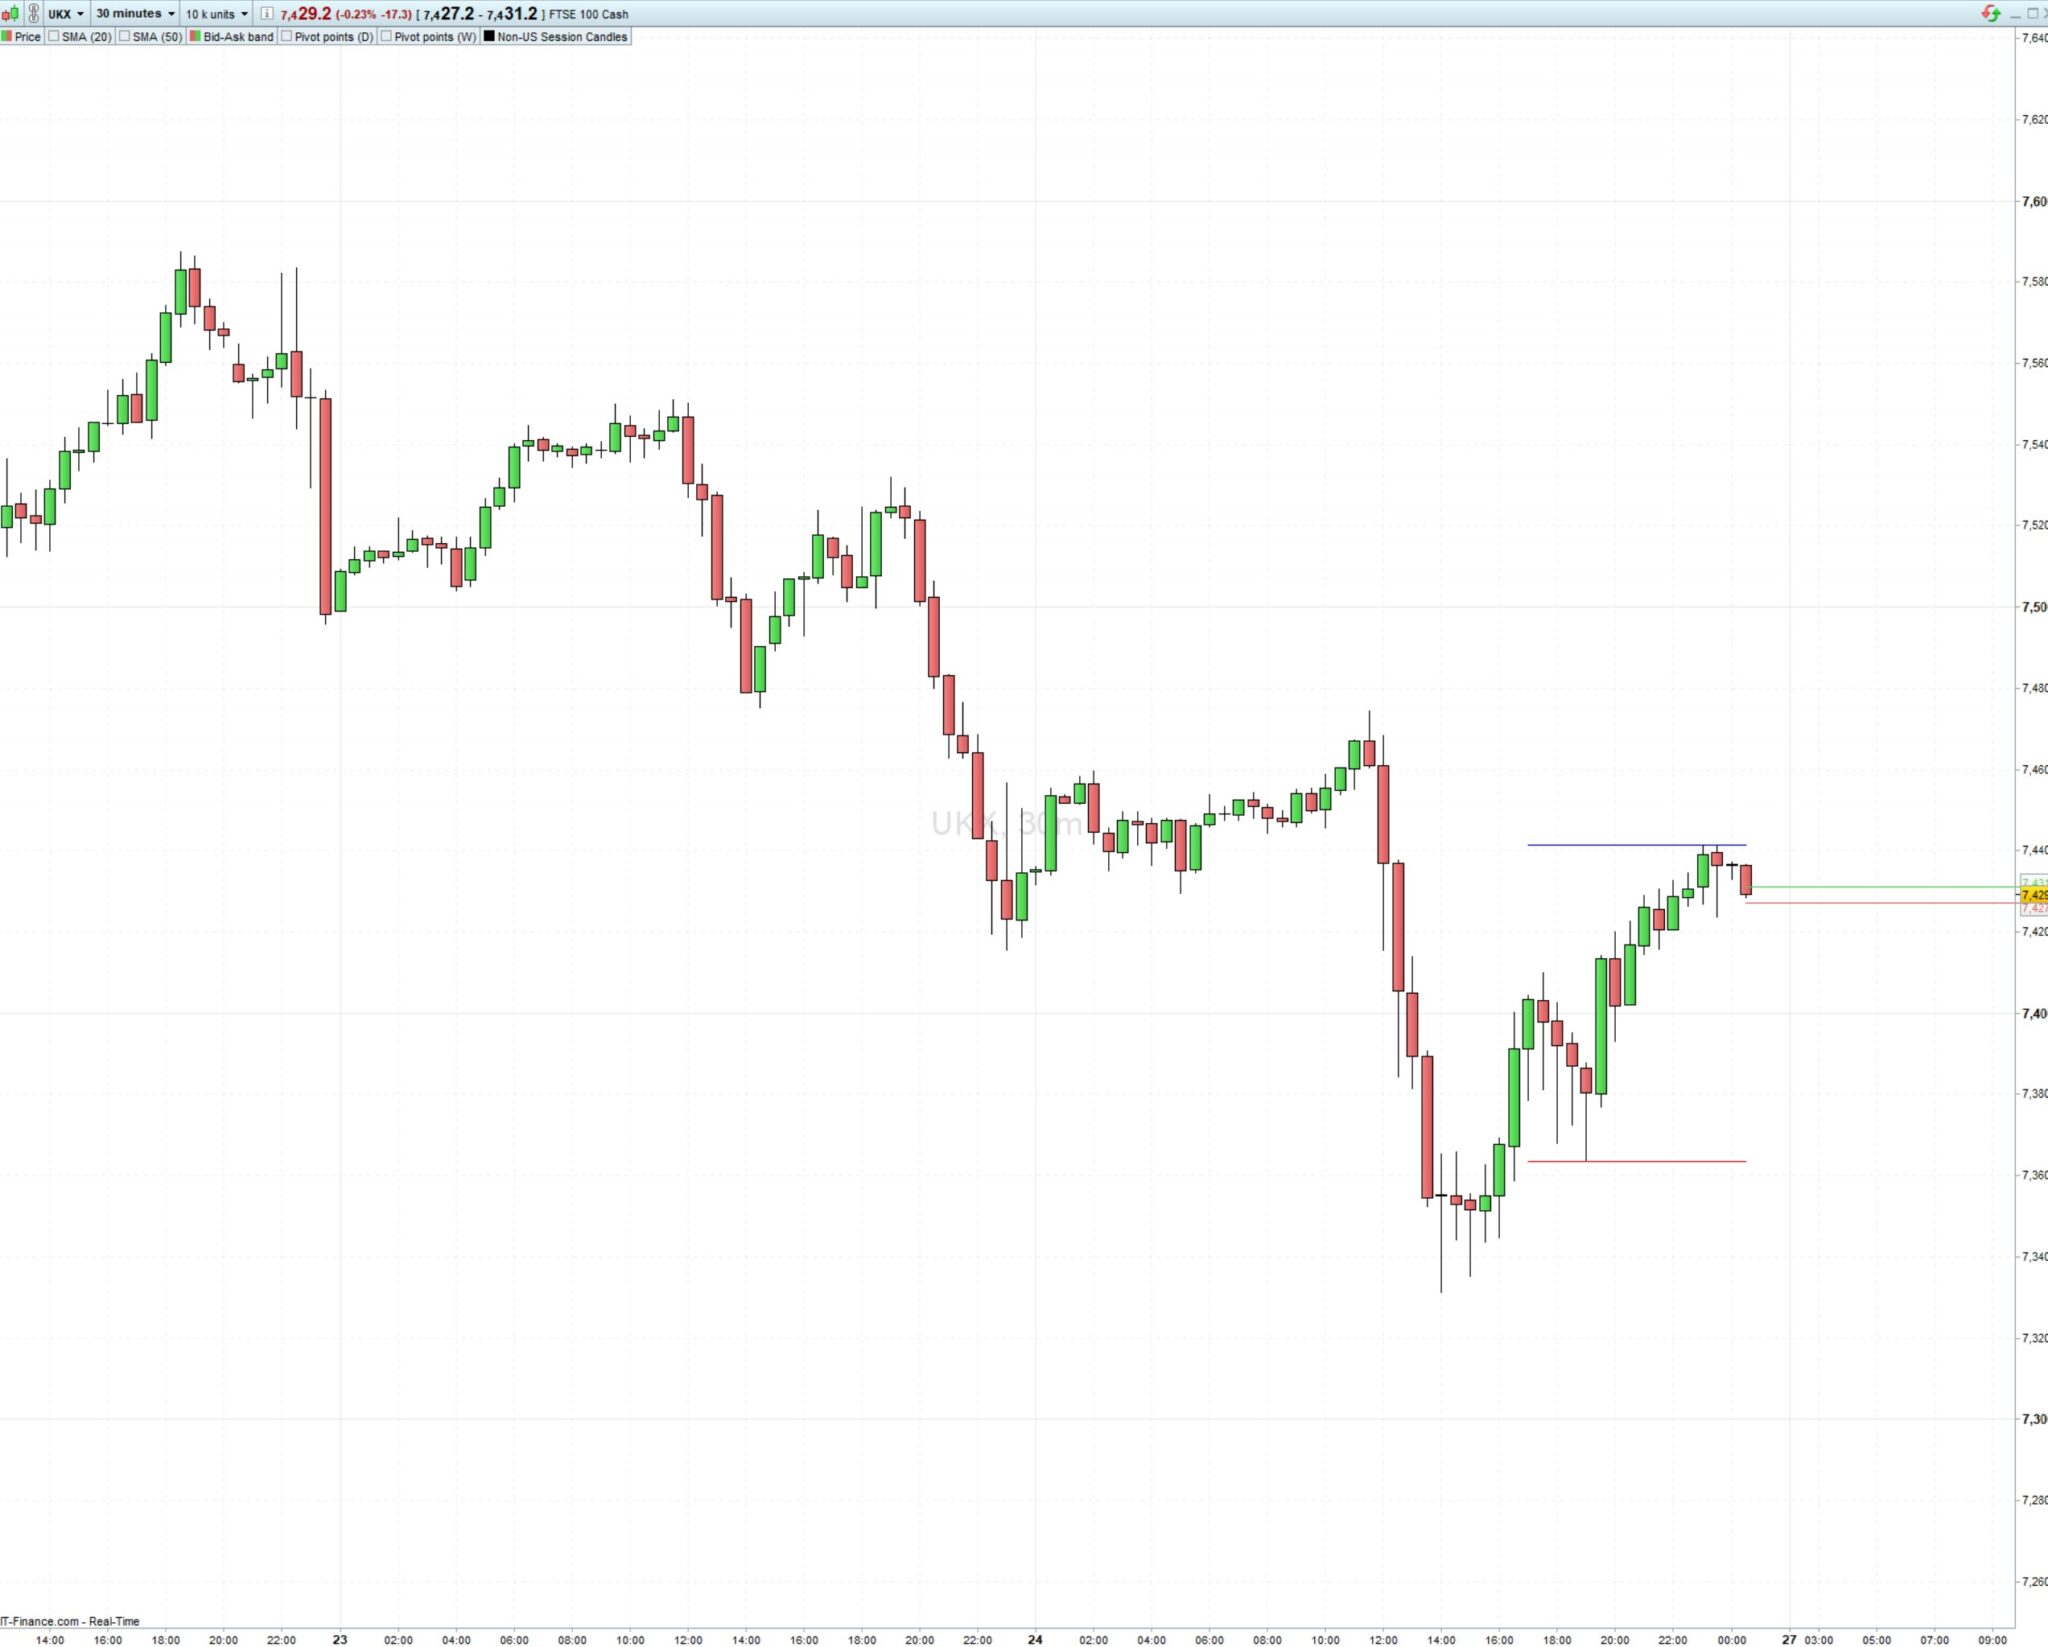
DrawSegment(Bar1,HH,Bar2,HH) coloured("Blue",255)
DrawSegment(Bar1,LL,Bar2,LL) coloured("Red",255)
RETURN
to display the last 10 sessions, arrays are needed.
I may code them, if you can’t, but first I need to know it works as expected.
Many thanks, Roberto. Let me give this a try and I’ll get back to you.
I looked, and it’s drawing horizontal lines across the high and low of the US session. How do I get it for non-US sessions and close the box with vertical lines on either side of the horizontal lines? Ideally, I’d like to colour the whole box area so that it is apparent which candles were formed outside the US session. Can it draw it for the last 10 non-US sessions?
I tried modifying the code using an array but I get an error.
DEFPARAM DrawOnLastBarOnly = true
startSession = 170000 // Start time for US futures trading session
endSession = 151500 // End time for US futures trading session (next day)
// Define array to store high and low values for each session
Array: highLow[10,2](0)
// Loop through last 10 sessions and store high and low values
For i = 0 To 9
If (OpenTime = StartSession – i*10000) OR ((OpenTime > StartSession – i*10000) AND (OpenTime[1] < StartSession – i*10000)) THEN
Bar1 = BarIndex
highLow[i,0] = high
highLow[i,1] = low
Endif
If (OpenTime >= StartSession – i*10000) OR (OpenTime < EndSession – i*10000) Then
highLow[i,0] = Max(highLow[i,0], high)
highLow[i,1] = Min(highLow[i,1], low)
Bar2 = BarIndex
Endif
Next
// Loop through last 10 sessions and draw segments
For i = 0 To 9
DrawSegment(Bar1-i,highLow[i,0],Bar2-i,highLow[i,0]) Coloured(“Blue”,255)
DrawSegment(Bar1-i,highLow[i,1],Bar2-i,highLow[i,1]) Coloured(“Red”,255)
Next
RETURN
You can replace the two lines that draw the segments, with DrawRectangle:
//DrawSegment(Bar1,HH,Bar2,HH) coloured("Blue",255)
//DrawSegment(Bar1,LL,Bar2,LL) coloured("Red",255)
DrawRectangle(Bar1,HH,Bar2,LL) coloured("Blue",25) BorderColor("Red",255) style(line,2)
the line tickness can range 1 to 5. The transparency, aka Alpha, ranges from 0 (invisible) to 255 (maximum visibility).
Array: highLow[10,2](0) is not the way arrays are defined in ProRealTime. Additionally, they can only have one dimension. i.e. $myArray[n], not $myArray[n,m,…], and cannot be used with graphic instructions, so you first have to assign any single element you want to plot to a variable and use that variable with graphic instructions.
To learn about arrays read https://www.prorealcode.com/topic/array-variables-availability-in-prorealtime/.
If you need to use N elements, whenever you need to add a new element you first will have to shift all elements one place leftwards (move elements 2 to N to positions 1 to N-1) so that you lose the oldest element to make room to the newer one. This is valid if you use a fixed number of elements only (such as 10); if you don’t plan any limit, just append elements to the array.