Vonasi
- Is the the logic behind using Qty / Random combo to give more than 100 results so that we input the worst 100 results into the Robustness Tester and so we have a worst case scenario??
- What do you think of the result attached for the code attached discussed on the link
https://www.prorealcode.com/topic/backtest-results-change-when-i-stop-using-variables/page/2/
I have created yet another robustness tester. I call this one the ‘Robustness Tester – WF Style’ because it splits the history being tested into lots of smaller sections and tests just on those sections.
To make the tester work it needs to know the value of barindex for the last bar on the chart. You can simply get this with the indicator RETURN BARINDEX and then enter the last value into the tester as BARSONCHART. You can also set a start date. Set this to zero if you want to test on all of history.
As with all the other robustness testers add the tester to the start of your strategy (under any DEFPARAMs) and ensure that all variables in the strategy are fixed values. Then add TRADEON to your entry conditions (being aware of how to exactly do this as previously discussed in this thread). Then you optimise the strategy with two variables DIVI and DIVI2.
DIVI one is how many bigger pieces the history being tested is divided into and DIVI2 is how many smaller pieces these bigger pieces are then divided in to. So with DIVI set to optimise from 1 to 0 step 1 and DIVI2 set to optimise from 1 to 4 step 1 we will have 40 different sections of data to test on. Be careful of setting the maximum values for DIVI and DIVI2 too high as otherwise the data is split into very small data samples that will not tell us very much at all when tested.
The results can then be dragged into Excel and analysed exactly the same as for the other testers.
//Robustness Tester - WF Style
//By Vonasi
//20190930

barsonchart= 2286// total number of bars on chart
startdate = 19950101// earliest start date of test period - set to zero to test all of history


if opendate = startdate then
testrange = barsonchart - barindex
testsize = (testrange / divi)
startindex = barindex - (testrange / divi)
endif

startbar = startindex + (testsize * divi)
endbar = startbar + ((barsonchart - startbar) / divi2)

tradeon = opendate > startdate and barindex >= startbar and barindex <= endbar

//graph barindex
Hello ,
is it possible to make a robustness test of this algorithm.
I remain at your disposal
cordially
Yes it is but that strategy has more BUY and SELLSHORT orders than I think I have ever seen in one strategy and it looks like it has the possibility to swap directions too and so adding the TRADEON condition to all the right places and still allow direction changes is going to be a bit of a mammoth task (possibly better done when I haven’t had a couple of glasses of wine!)
Changing trade direction always dilutes any robustness test a little – the more you change direction the less the robustness test can be trusted. Also because it is a 5 minute strategy the amount of data available for robustness testing is very limited compared to all of history so I am not sure exactly how conclusive the test will be but it is worth a look.
I’ll try to find time!
thank you vonasi,
strongly version 11 prt
I finally managed to find some time to try to add the ‘Robustness Tester – Random’ to fifi743 ‘s Vectorial DAX M5 code. I think that I added it correctly and it turned out not to be as difficult as I first thought despite the masses of BUY and SELLSHORT instructions in the code! In reality not many of them were buys or sellshort when not reversing direction.
The test on this strategy is very slow!!! – so results took quite a lot of time to get.
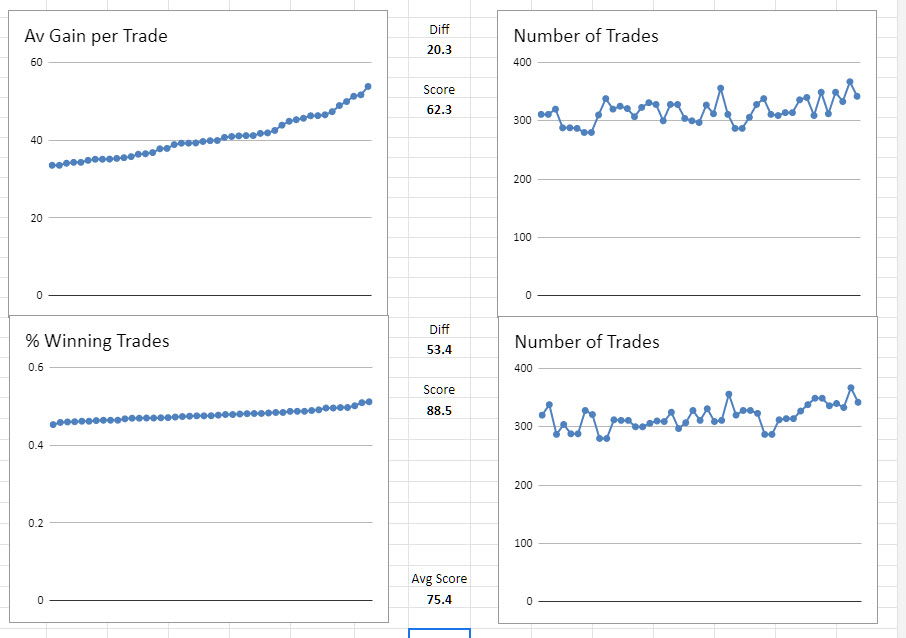
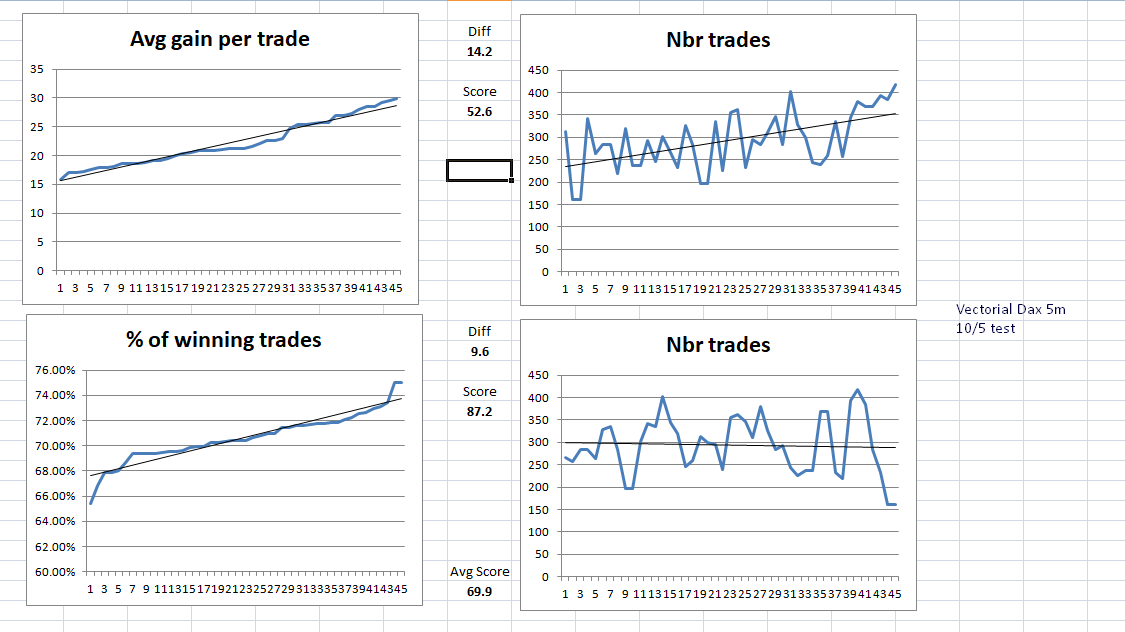
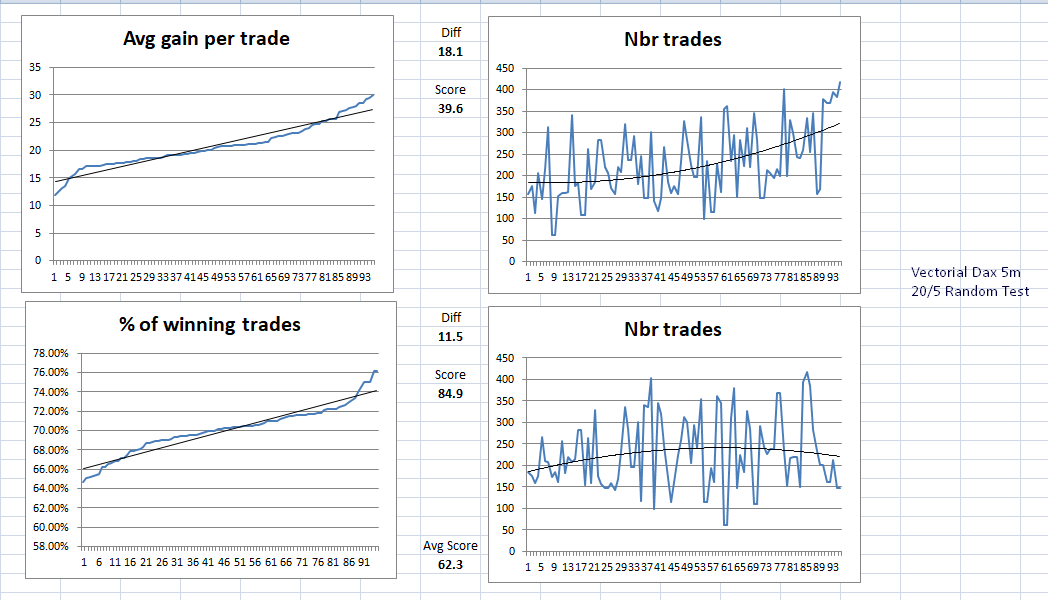
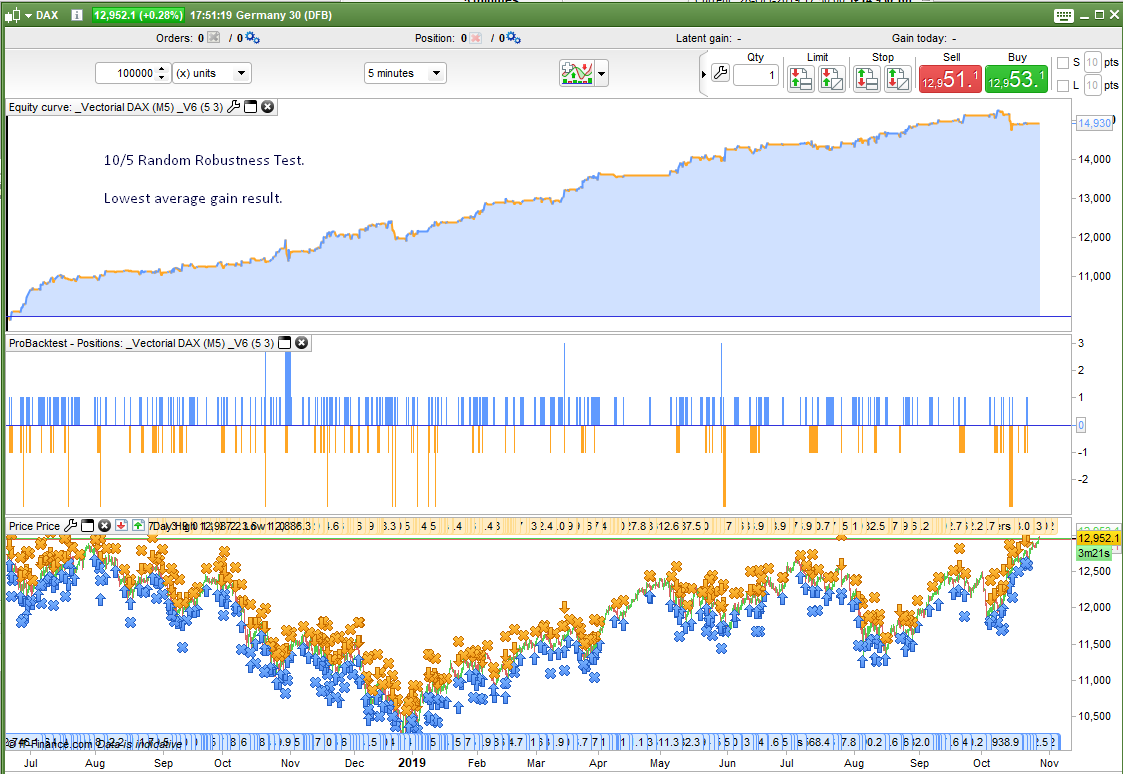
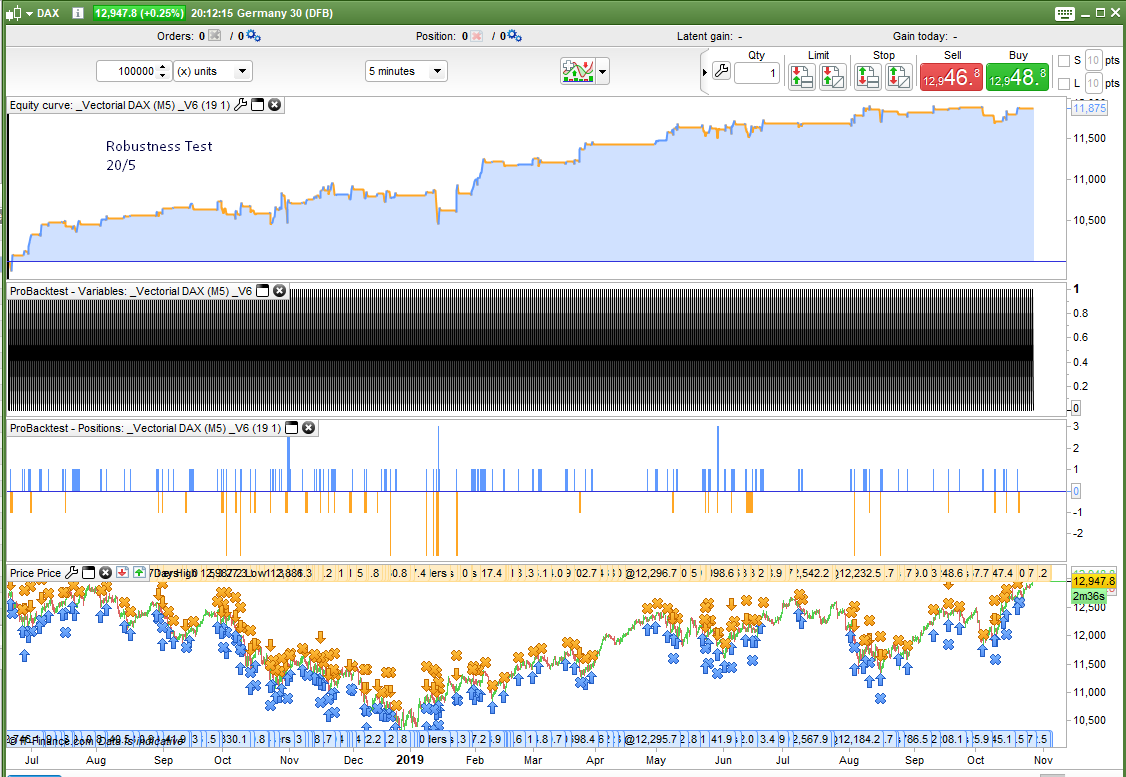
I tested with settings of 10/5 and 20/5 for QTY and RANDOM. So that is 45 random samples and 95 random samples. See the attached images for the results. The equity curves are for the lowest resulting average gain per trade in each test.
At first glance the results look pretty good. In the 20/5 test the average gain score is not very high but all tests in both tests resulted in positive equity curves and equity curves that closely resembled the original equity curve for the back test on all candles. The combined score in the 20/5 test was still pretty good thanks to the win rate% score being very good.
It would seem that the strategy on the data sample tested is pretty robust especially considering that the sample is very up and down and not just a bull market or a bear market. My only reservation being that the data sample of 100k 5 minute candles is a very small data sample considering the amount of history that precedes it that we have not tested on! I have attached the ITF file for the strategy modified to include the robustness tester random code. If anyone has 200k bars and wants to test it then it would be interesting to see the results.
hello vonasi
a big thank you for your work.
cordially
could you give us this bot
What bot are you referring to?
I included the VRT.itf in the post that you quoted.
Hi, GraHal! If the vrt.itf is there, but I don’t know how to remove the robustness test and have the bot to test it in demo. Could you hang it please? many thanks
Are you saying that you do not know how to use the vrt.itf in a bot in order to test your own bot’s robustness?
To stop the robustness tester from working just change the line in the code that says
tradeon = 0
to
tradeon = 1
Are you saying that you do not know how to use the vrt.itf in a bot in order to test your own bot’s robustness?
No, what I want is to put the bot in demo mode and it gives me an error
@josef1604 … did you follow Vonasi advice in the post above your last one?
If you want you could post your bot (.itf file be best) on here and I would try and run it for you on my Demo Platform?