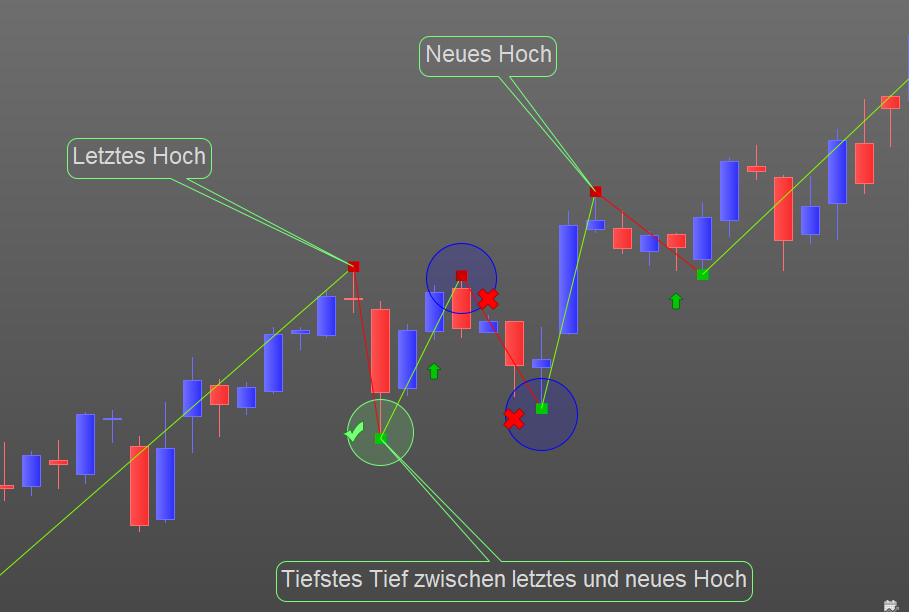
Hallo, dieser Indikator ist sehr gut. Ich hätte aber gern etwas geändert.
Im Bild ist ein Aufwärtstrend zu sehen wo blau markiert auch noch weitere Tiefpunkt und Hochpunkte zu sehen sind
Der Indikator soll ja den Trend anzeigen. Ist es möglich nur das eine tiefstes Tief zwischen dem letzten Hoch und dem neuen Hoch anzuzeigen. Hab ich mit grünem Kreis markiert.
Im Moment werden wie im Bild ersichtlich mehrere Tiefs zwischen dem letzten und dem neuen Hoch angezeigt. Die Zwischentiefs sollen nicht angezeigt werden. Mit blauem Kreis markiert.
Vielen Dank
Hier der Code:
defparam calculateonlastbars=30000
cp = 3
once lastpoint = 0
if high[cp] >= highest[2*cp+1](high) then
PEAK = 1
else
PEAK = 0
endif
if low[cp] <= lowest[2*cp+1](low) then
TROUGH = -1
else
TROUGH = 0
endif
if PEAK = 1 then
TOPy = high[cp]
TOPx = barindex[cp]
endif
if TROUGH = -1 then
BOTy = low[cp]
BOTx = barindex[cp]
endif
if PEAK>0 and (lastpoint=-1 or lastpoint=0) then
DRAWSEGMENT(lastX,lastY,TOPx,TOPy) COLOURED(127,255,0,1000)
DRAWTEXT(“■”,TOPx,TOPy,Dialog,Bold,10) coloured(200,0,0,255)
lastpoint = 1
lastX = TOPx
lastY = TOPy
endif
if TROUGH<0 and (lastpoint=1 or lastpoint=0) then
DRAWSEGMENT(lastX,lastY,BOTx,BOTy) COLOURED(255,0,0,255)
DRAWTEXT(“■”,BOTx,BOTy,Dialog,Bold,10) coloured(0,200,0,255)
lastpoint = -1
lastX = BOTx
lastY = BOTy
endif
//TREND ATTEMPT
atr=AverageTrueRange[14](close)
if TOPy > TOPy[1] and topy<>lasttop then
drawarrowup(barindex,low-atr/2) coloured(0,200,0)
lasttop=topy
trendup = 1
else
trendup = 0
endif
RETURN TOPy as “TOPy”, BOTY as “BOTy”, trendup as “trendup”