By the way, in case someone does not like to use the pure martingale, this is the option to multiply by 1.5. You may not fully recover from previous losses, but most of them with less risk.
IF PositionPerf(1) < 0 THEN
OrderSize = OrderSize*1.5
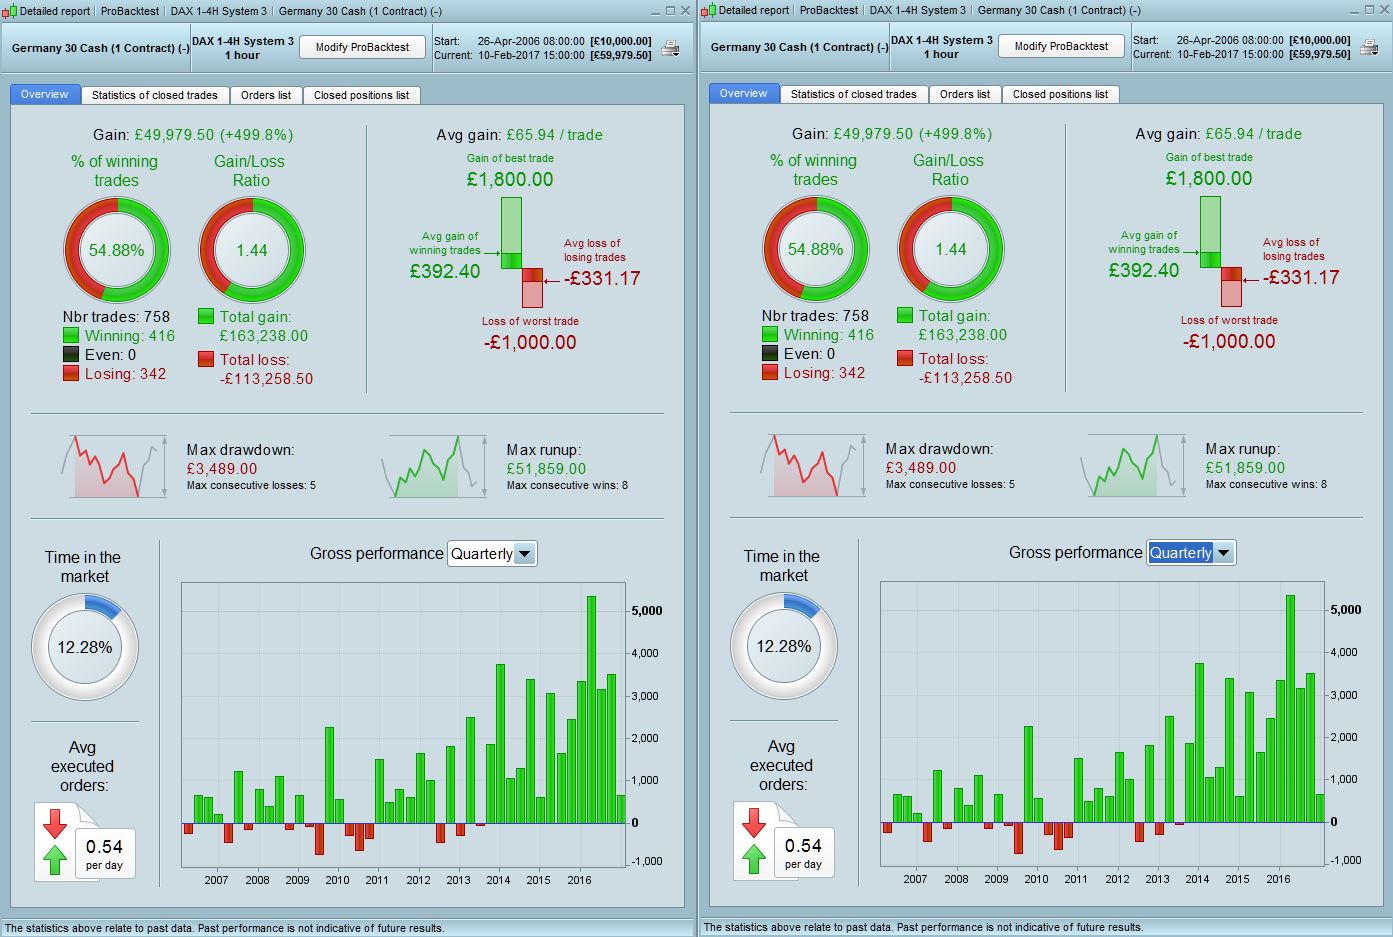
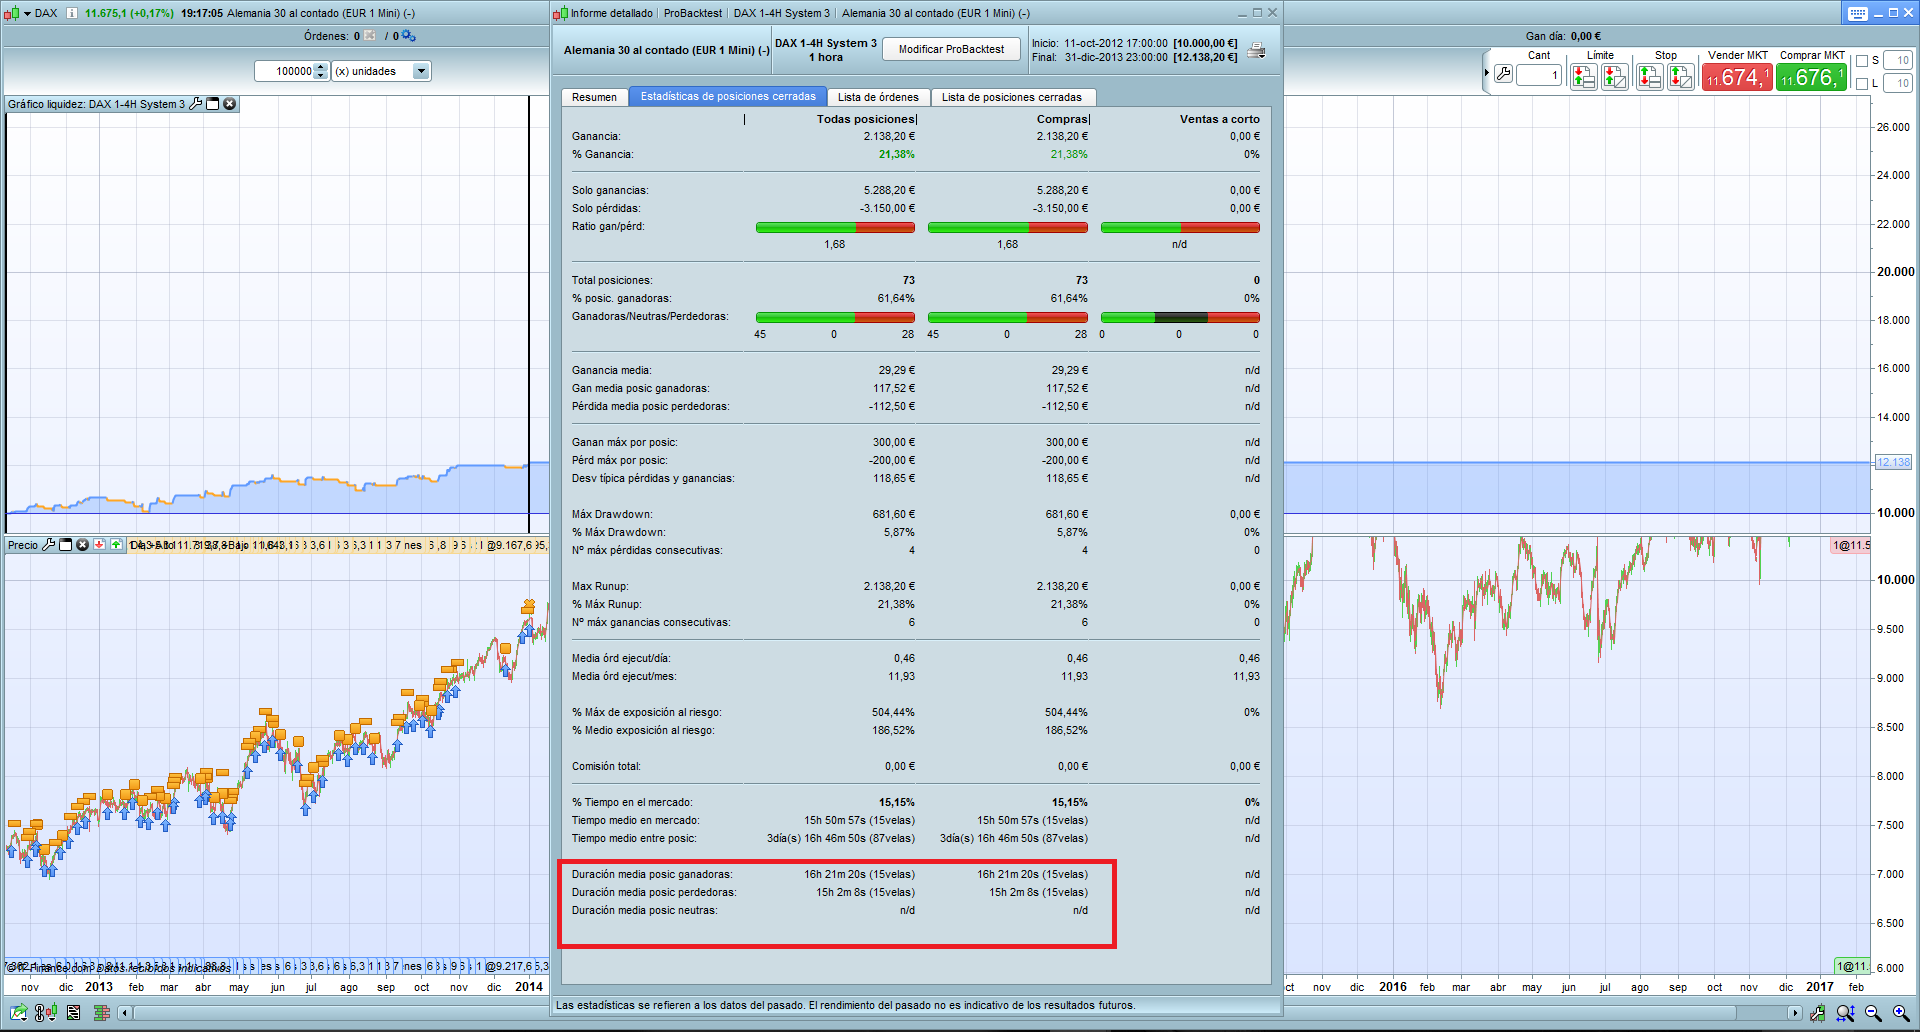
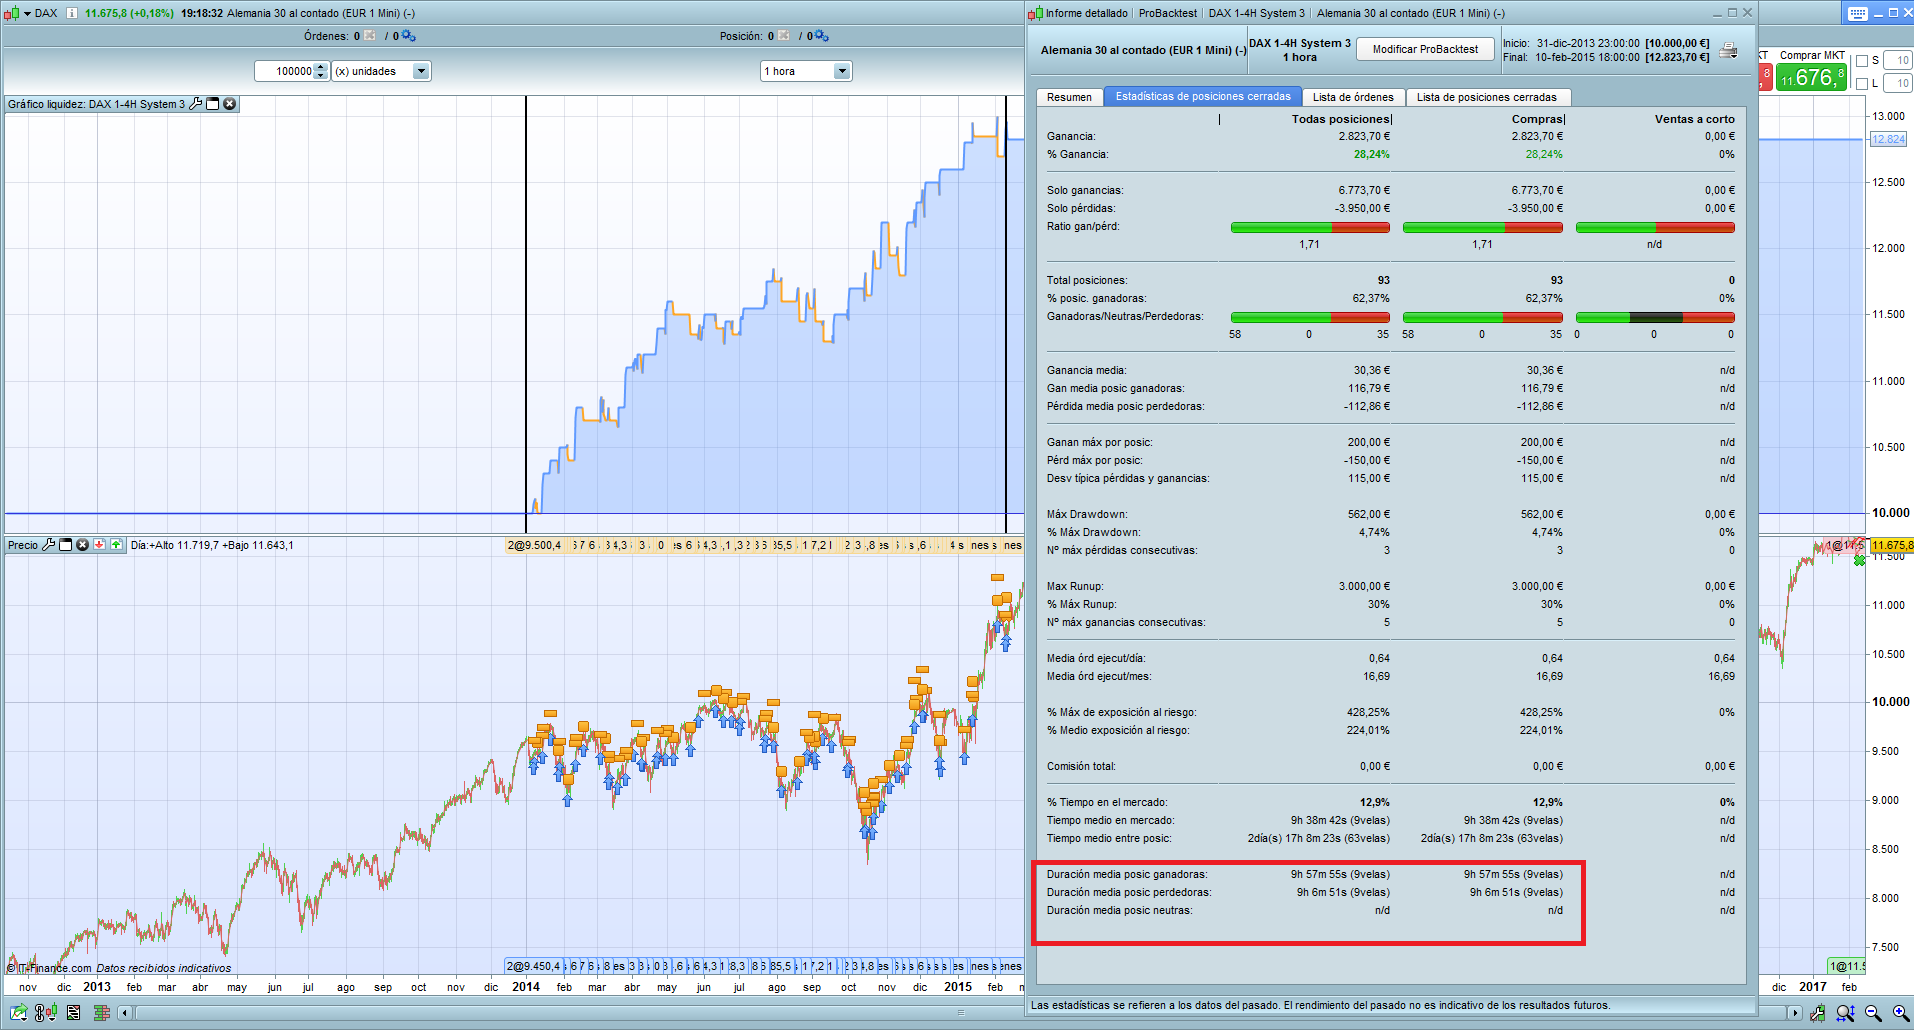
Raul – There is no difference in results from the exit day being 4 or 5. See attached, 4 on left and 5 on right. System 3 was the only code that had the exit day as 5 so I assume that’s what you wanted checked, the rest (including fixed contract) were already on day 4. This is probably because in-between Tuesday and Thursday there has always been a 50pt move up or down from the position entry level, hence no position left live when you get to Day 5.
I will post the 4 hr results shortly but they are worse than the 1hr ones so using this on a 1hr timescale is definitely better.
Hi Raul, and congratulation on your latest strategy. I’ve been following some of your posts and It seems like you are conscious about your money management and risk.
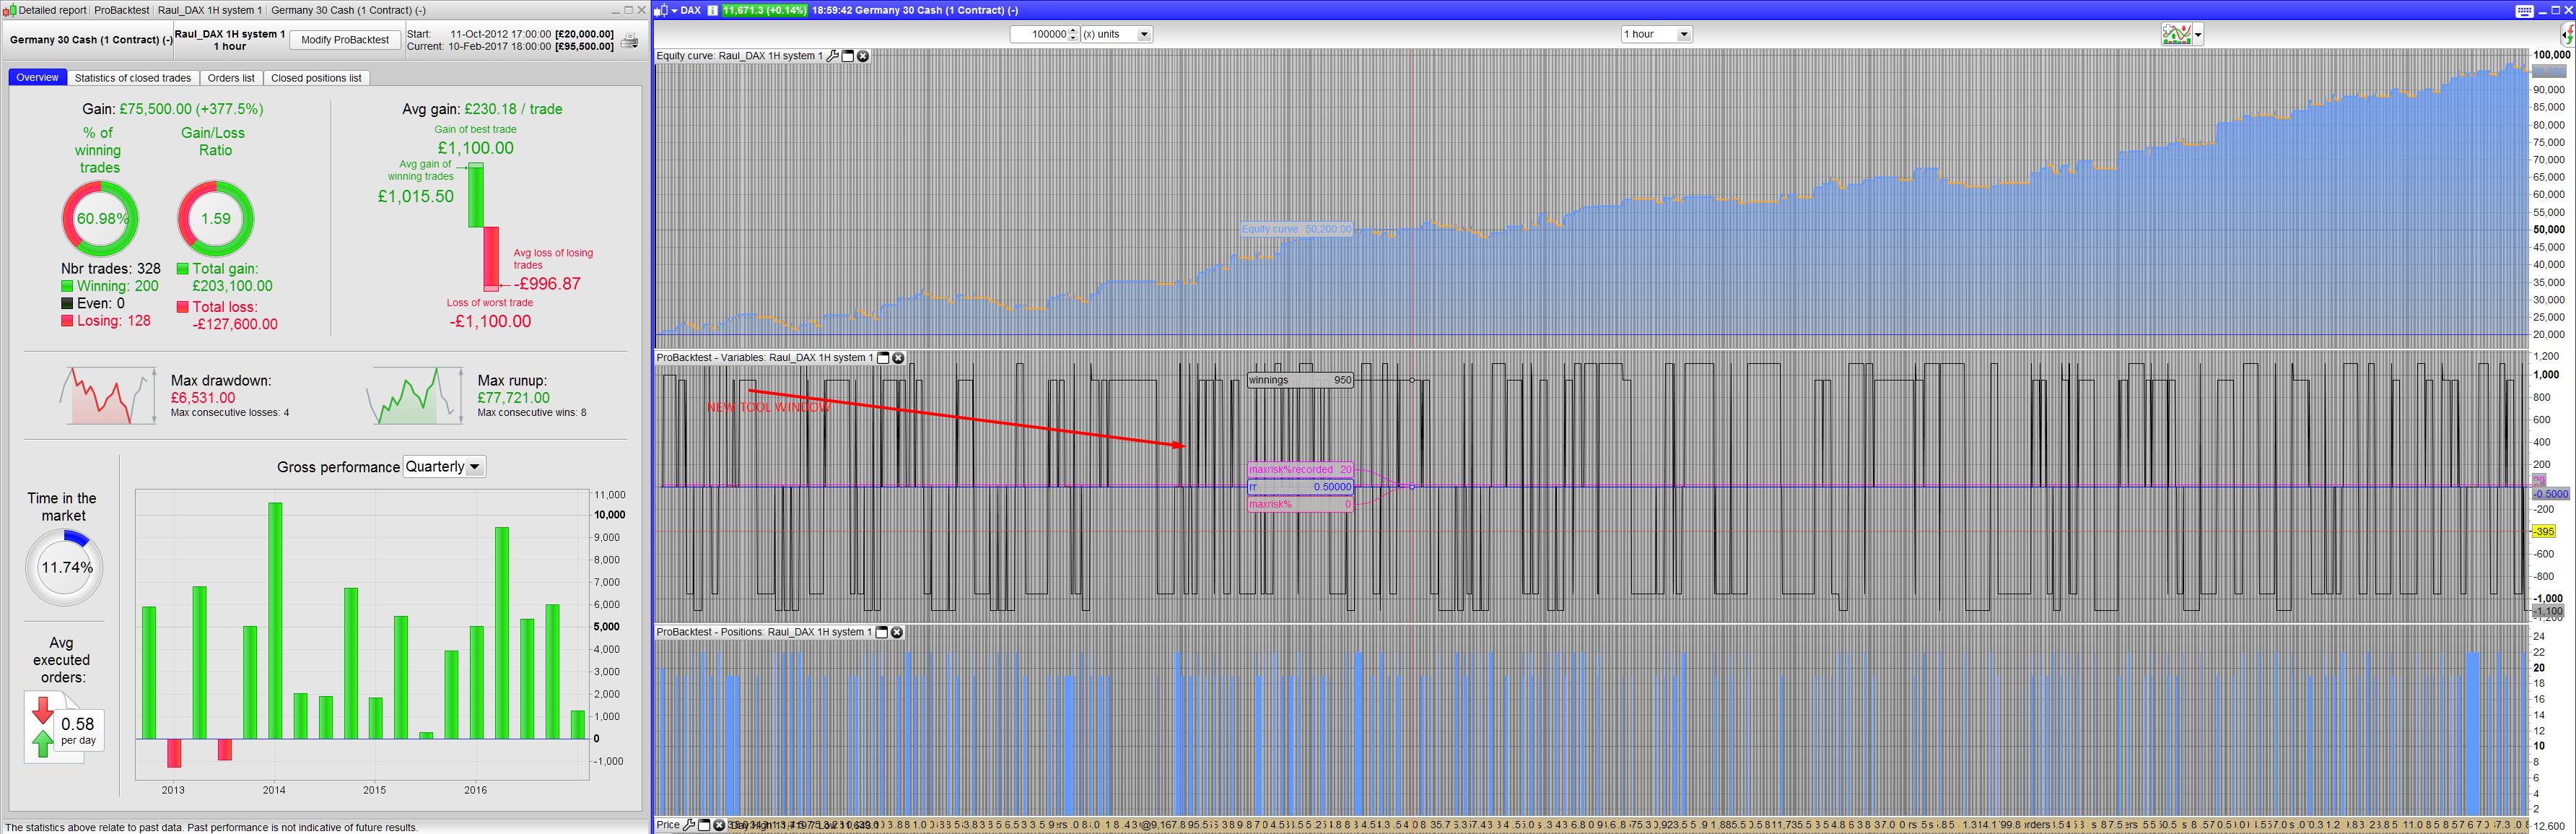
I have made these small tools in graph and added a small positionsize code, slightly changed from Nicolas’ original.
If I can suggest that you look at these together with you latest code- it would give some good information even though it’s still in development.
I hope to use this to make better risk analysis and position management. There is information both on market and off market.
Cheers Kasper
//REM Money Management
Reinvest=1
if reinvest then
Capital = 10000
Risk = 1//in % pr position
StopLoss = 100 // Could be our variable X
REM Calculate contracts
equity = Capital + StrategyProfit
maxrisk = round(equity*(Risk/100))
MAXpositionsize=625
MINpositionsize=20
ordersize= MAX(MINpositionsize,MIN(MAXpositionsize,abs(round((maxrisk/StopLoss)/PointValue)*pipsize)))
else
ordersize=1
Endif
//===============Graphs RR, Winnings, Max recorded risk, Max risk%
ONCE maxriskrecorded=0
If onmarket then
maxriskrecorded=ABS((COUNTOFPOSITION*stoploss*pipsize*pointvalue/equity)*100)
if maxriskrecorded<maxriskrecorded[1]then
maxriskrecorded=maxriskrecorded[1]
else
maxriskrecorded=maxriskrecorded
endif
endif
if not onmarket then
winnings=StrategyProfit-StrategyProfit[1]
else
winnings=0
endif
riskprtrade=abs(COUNTOFPOSITION*stoploss*pipsize)
RR=winnings/riskprtrade[1]
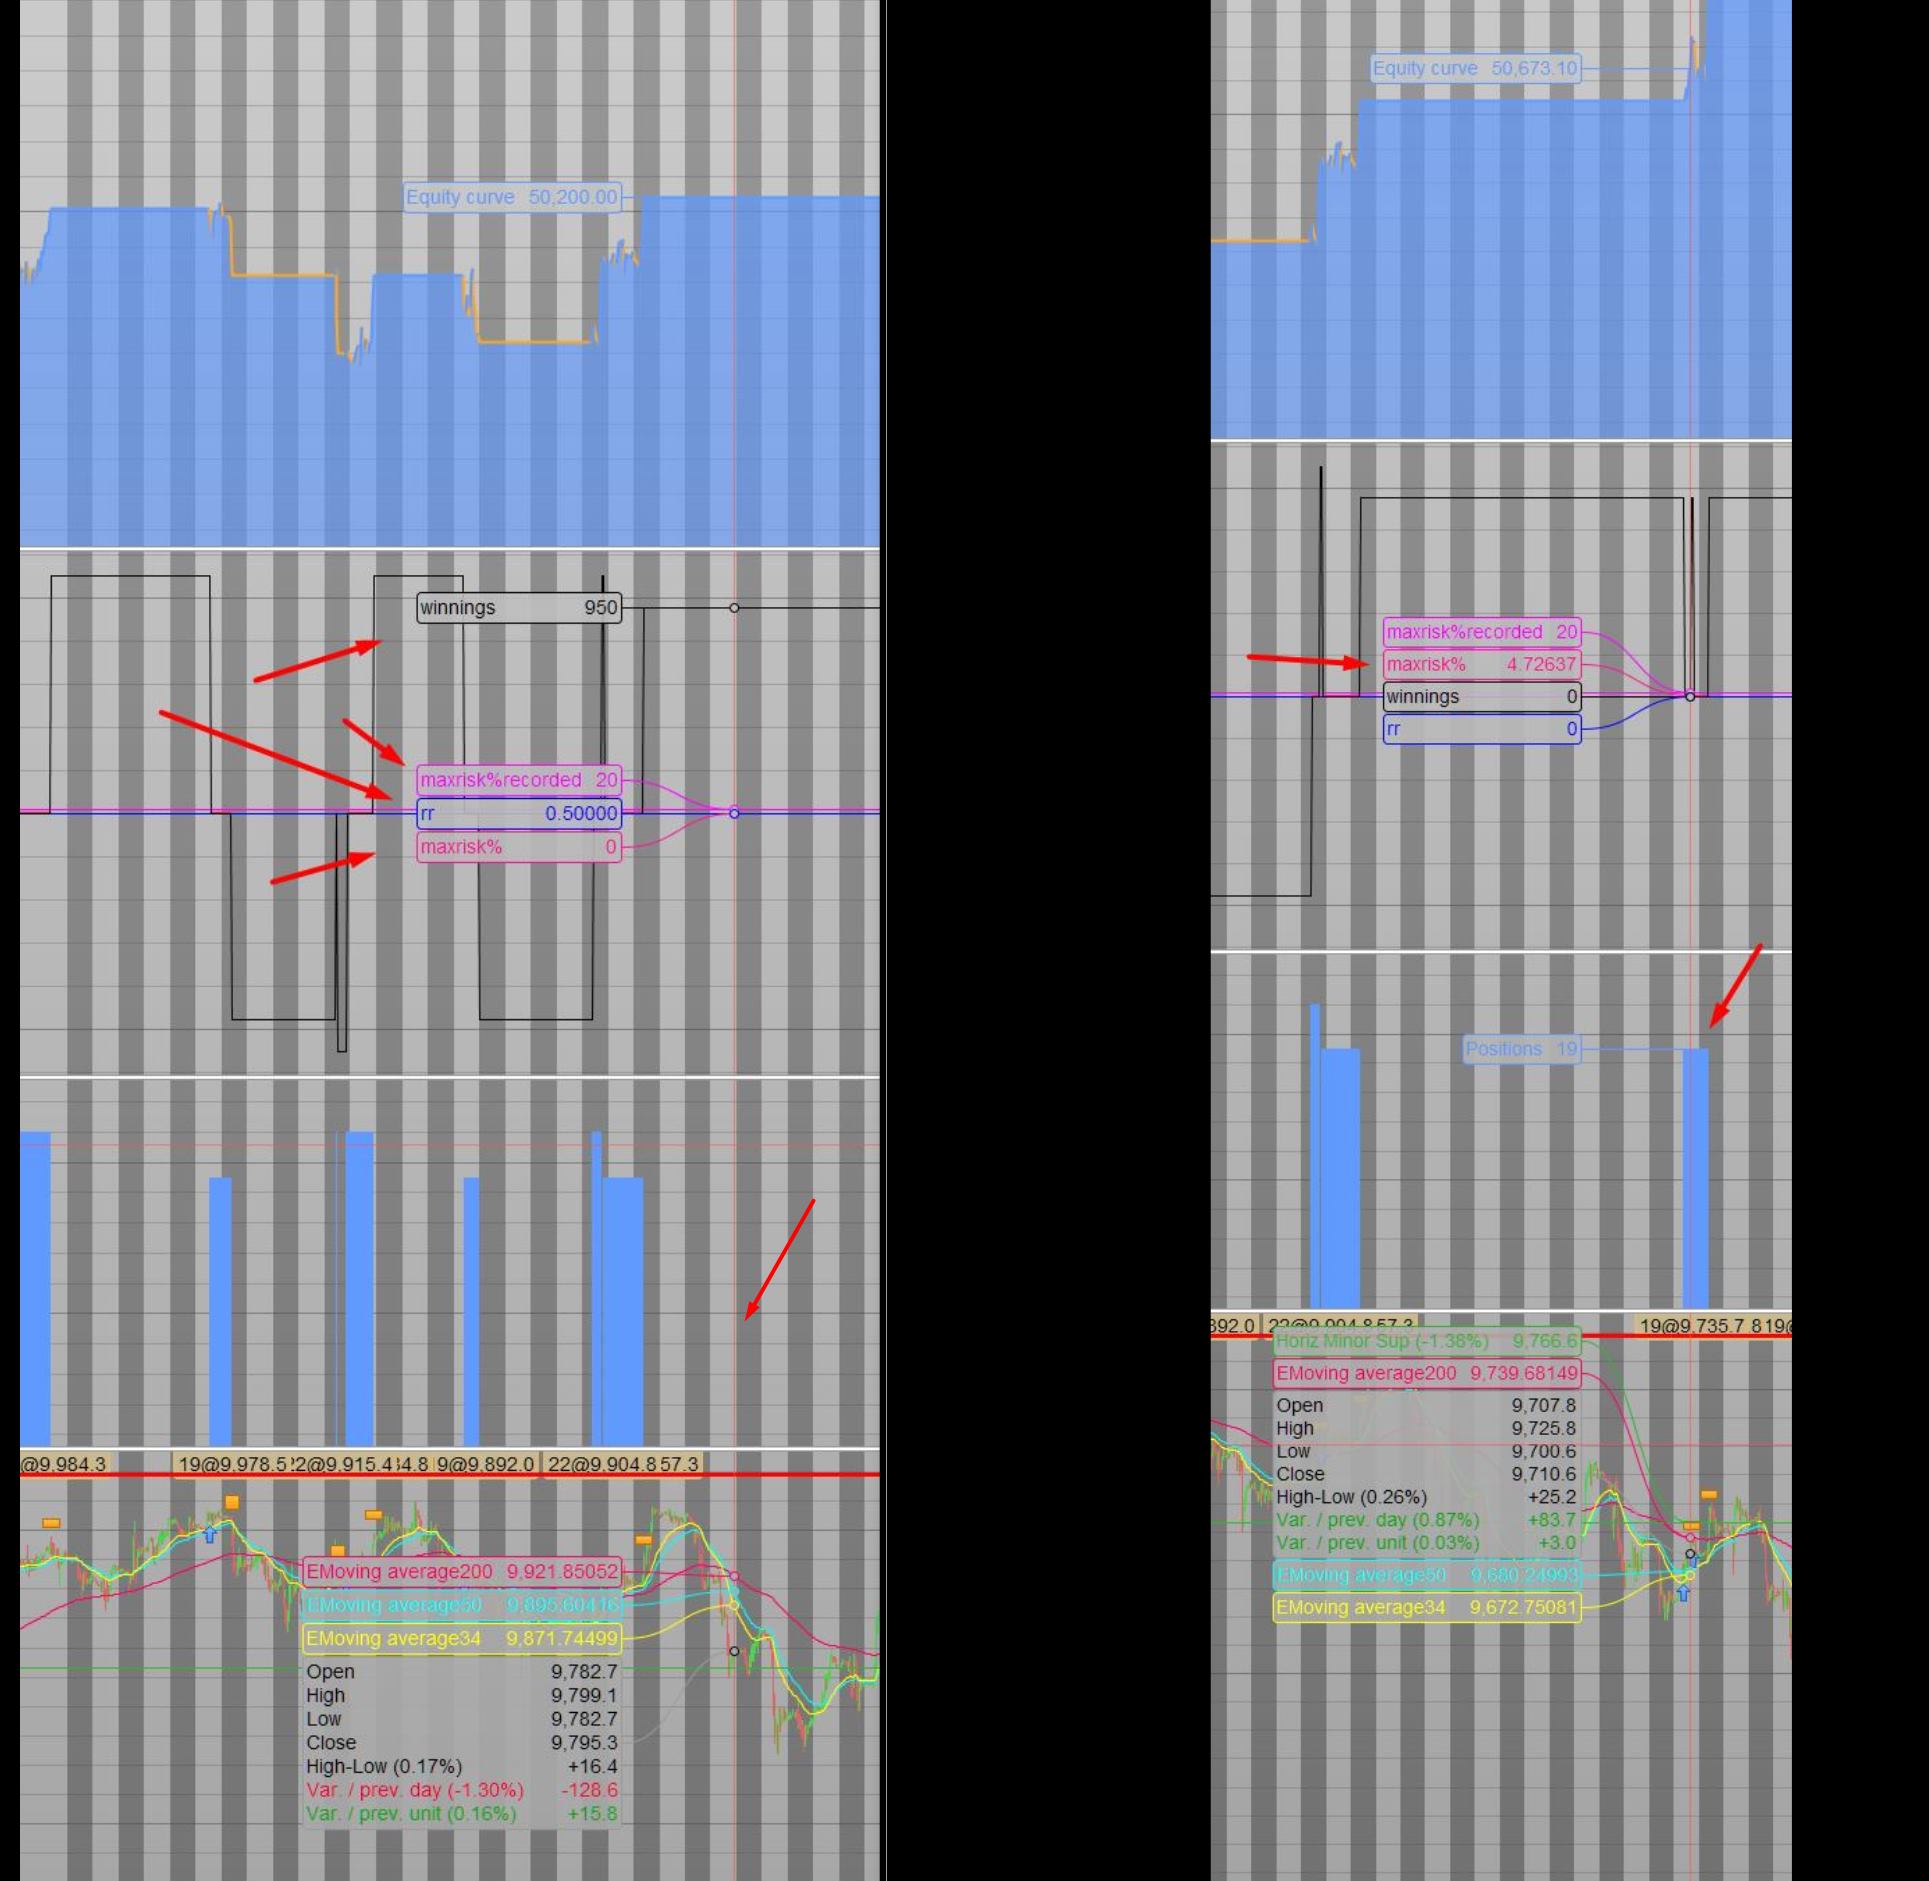
graph abs((COUNTOFPOSITION*stoploss*pipsize*pointvalue/equity)*100) COLOURED(255,20,147) AS "MAXRISK%"
graph maxriskrecorded COLOURED(255,0,255) AS "MAXrisk%recorded"
graph RR COLOURED(0,0,255) AS "RR"
graph winnings COLOURED(0,0,0) AS "Winnings"
Raul – Good spot on the SMI index. I agree, like I detailed before, I prefer System 3 as it mostly strikes the right balance between all the risk/rewards
Hello @kasper, I can not understand what you mean, sorry, it will be for the language. The first part is a risk manager, but I can not know that it is the second part, I do not know how to implement it in the code, copy and paste and does not perform any operation. Thank you
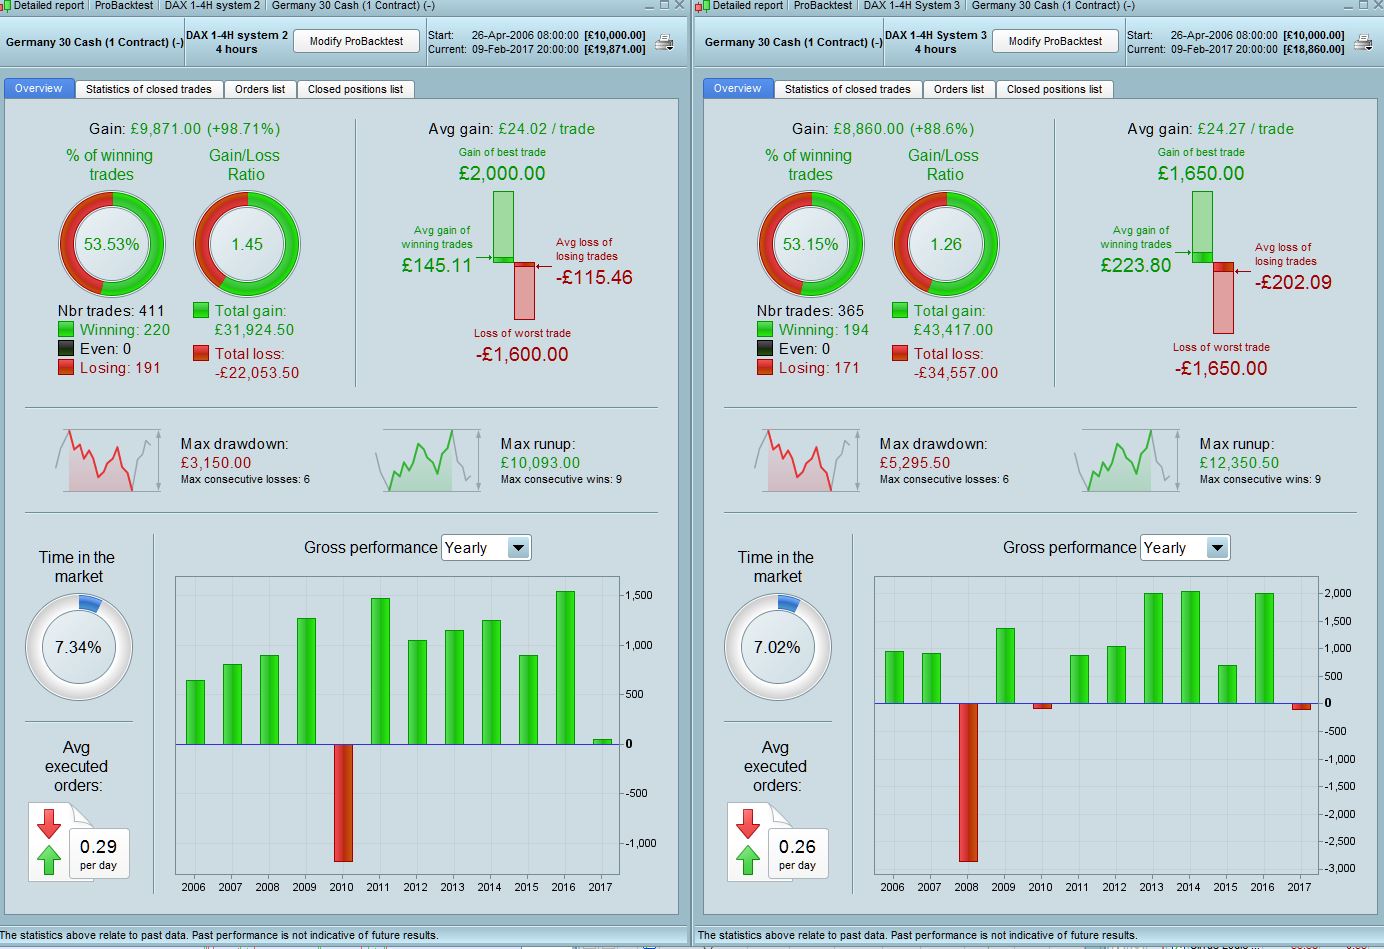
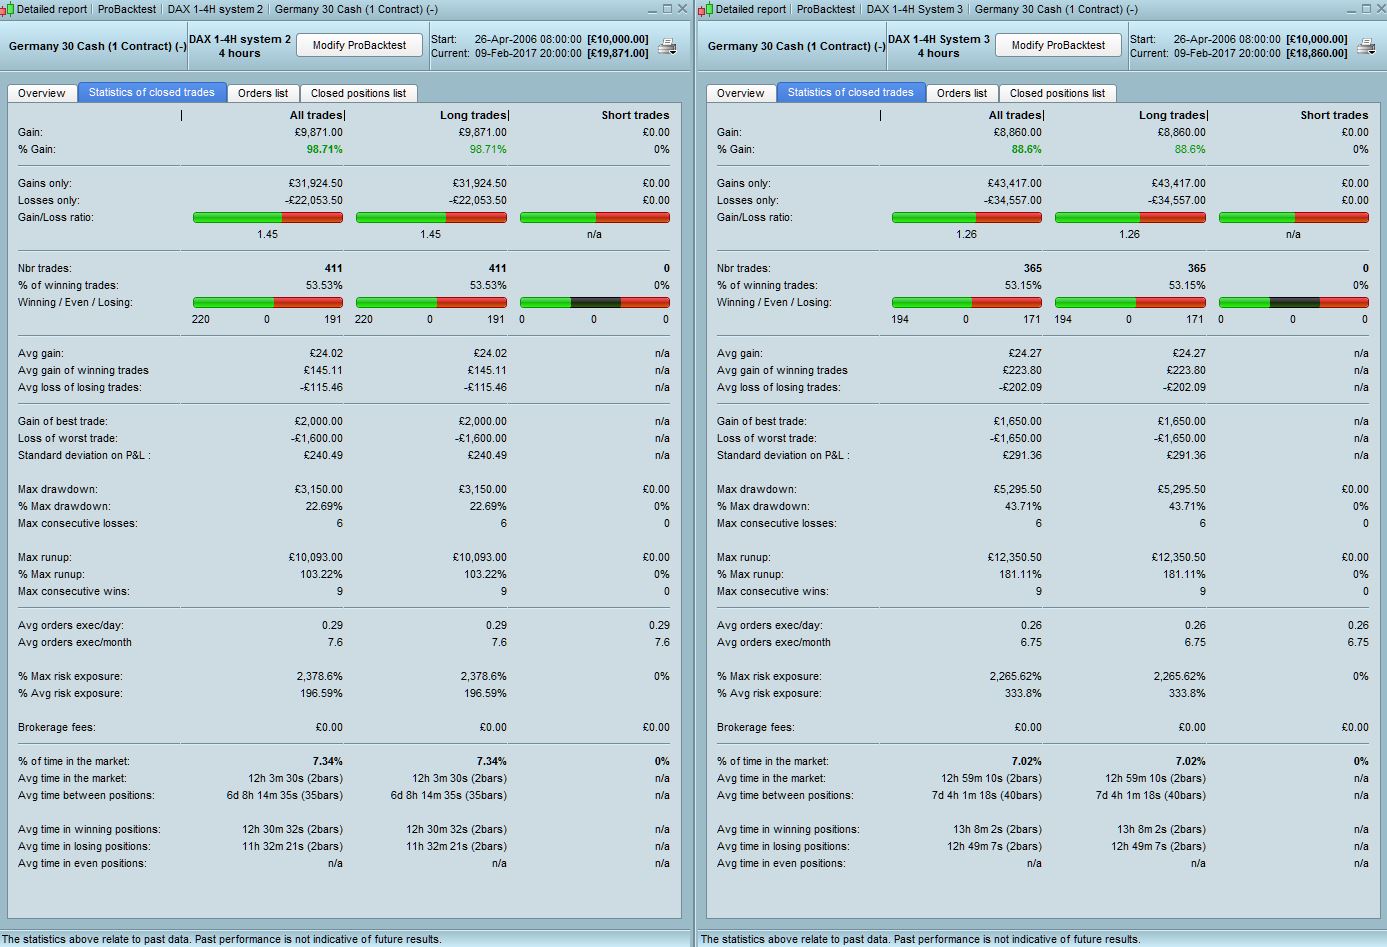
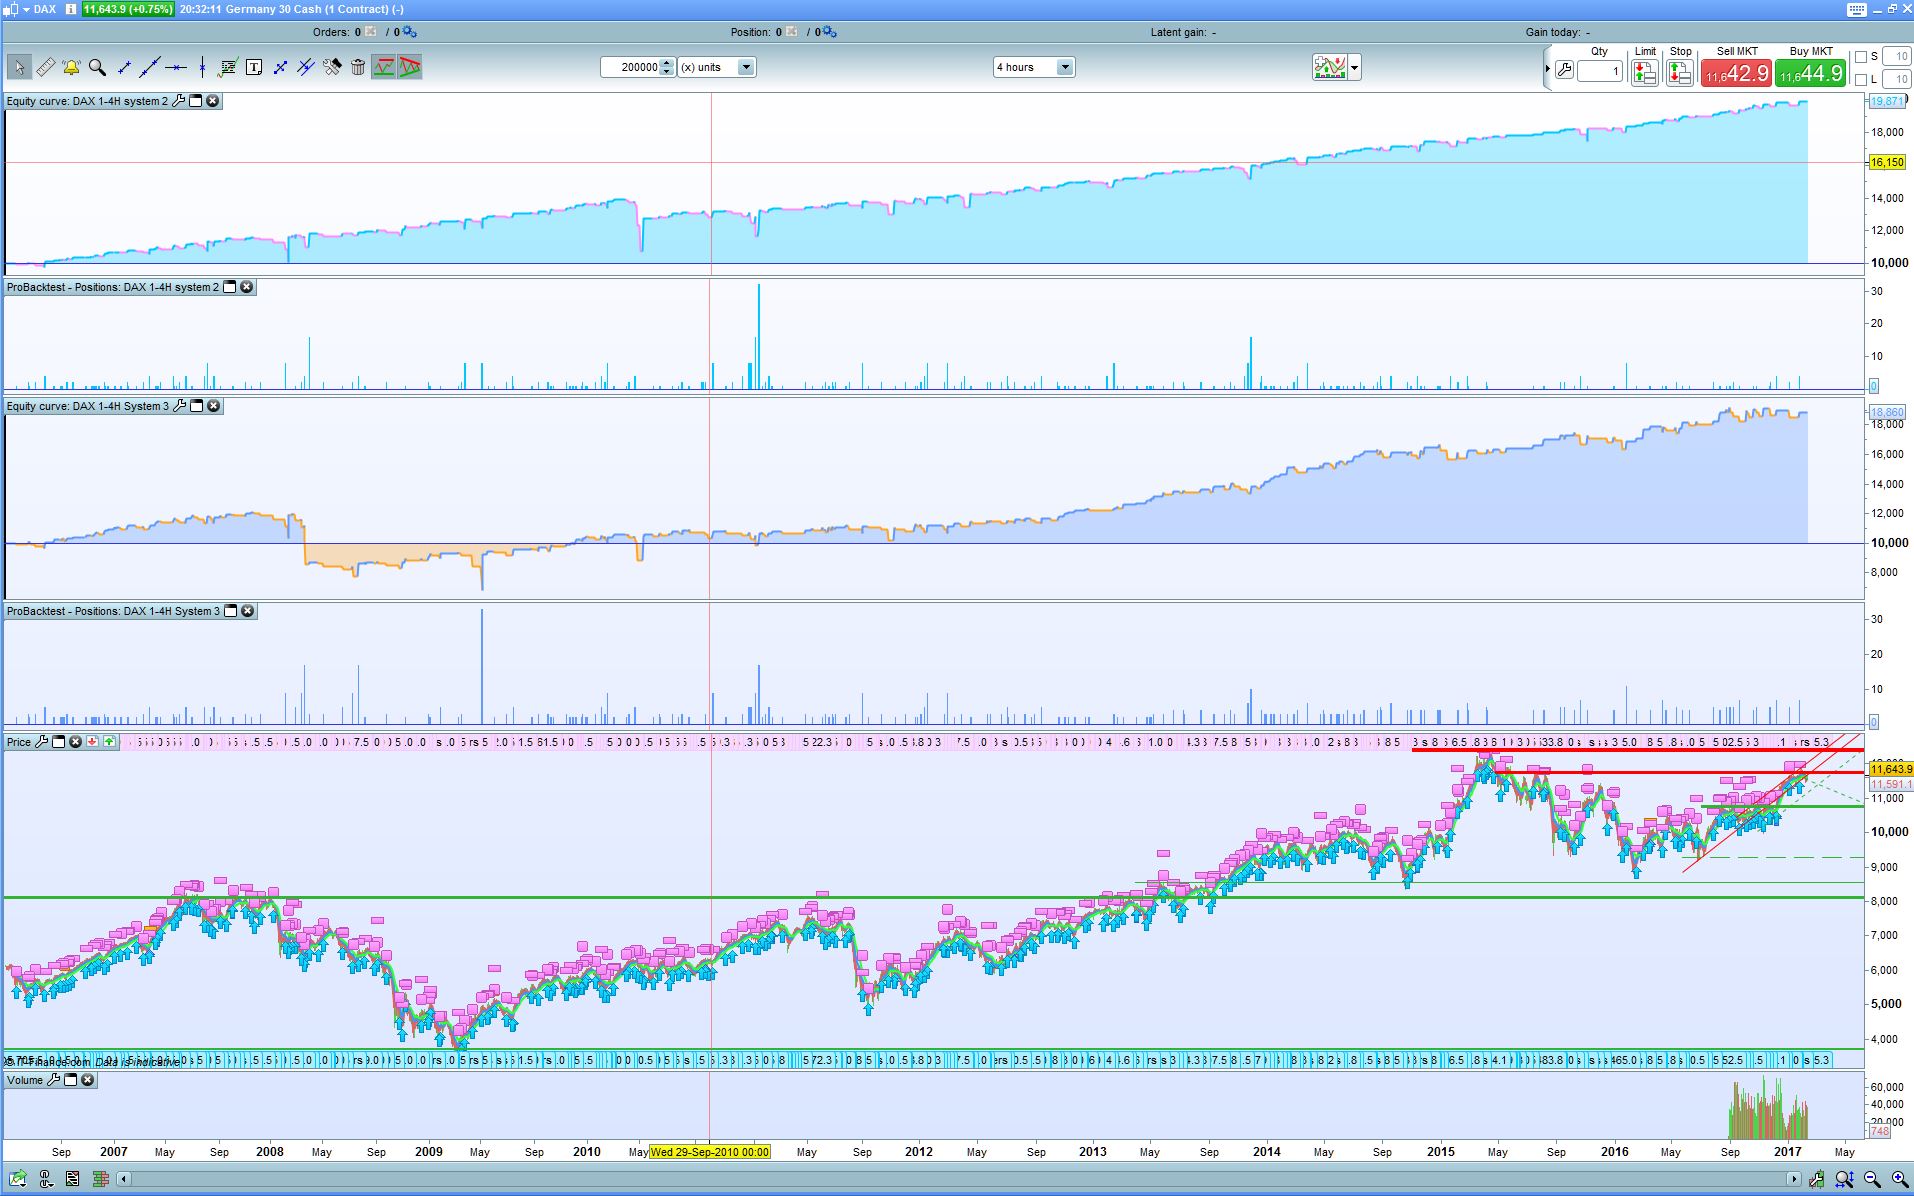
Attached are the 4hr results for system 2&3. Not much to say apart from results are not as good (partly due to less trades obviously) but also that the draw is quite big at 23% and 44% respectively. System 2 performs better in this timeframe as its more consistent with less draw and is also mostly positive in prior years to 2012 (except 2010).
thank you very much! I think we have to continue working in the direction of system 3 in 1 hour timeframe, it seems the best by far
Okay 🙂
It is a tool to know the:
- Maxrisk (for the whole backtest)
- Risk at each trade
- RR (Risk/Reward) at each trade
Optimize line 23 and 29 for risk management
I have made a complete code with the DAX-1H-system-1.itf
here it is:
If any questions just ask 🙂
DEFPARAM CumulateOrders = true
once ordersize=1

// Conditions

MA1 = Average [1]
MA2 = Average [2]

c1 = Ma1>MA2

t1 = time >= 090000
t2 = time = 180000

d1 =dayofweek = 2
d2 = dayofweek = 4


//REM Money Management
Reinvest=1
if reinvest then
Capital = 10000
Risk = 1//in % pr position
StopLoss = 100 // Could be our variable X
REM Calculate contracts
equity = Capital + StrategyProfit
maxrisk = round(equity*(Risk/100))
MAXpositionsize=625
MINpositionsize=20
ordersize= MAX(MINpositionsize,MIN(MAXpositionsize,abs(round((maxrisk/StopLoss)/PointValue)*pipsize)))
else
ordersize=1
endif

indicator13 = MACD[12,26,9](close)
c13 = (indicator13 < 30)

indicator11 = ExponentialAverage[20](close)
c11 = (close >= indicator11)

indicator1 = MACDline[12,26,9](close)
indicator2 = ExponentialAverage[12](indicator1)
c12 = (indicator1 > indicator2)

If   d1 And t1 and c1 and c11 and c12 and c13 THEN
if not onmarket then
IF c1 THEN
IF PositionPerf(1) < 0 THEN
OrderSize = OrderSize+2
if ordersize<1 then
ordersize=1
ENDIF
ELSIF PositionPerf(1) > 0 THEN
OrderSize = Ordersize-1
if ordersize<1 then
ordersize= 1
ENDIF
endif
buy ordersize Contract At Market
Endif


If d2 and t2 then
sell at market
endif
endif
endif

Set Stop Ploss 50 // from Trade
Set Target PProfit 50 // from Trade

//===============Graphs RR, Winnings, Max recorded risk, Max risk%
ONCE maxriskrecorded=0
If onmarket then
maxriskrecorded=ABS((COUNTOFPOSITION*stoploss*pipsize*pointvalue/equity)*100)
if maxriskrecorded<maxriskrecorded[1]then
maxriskrecorded=maxriskrecorded[1]
else
maxriskrecorded=maxriskrecorded
endif
endif
if not onmarket then
winnings=StrategyProfit-StrategyProfit[1]
else
winnings=0
endif
riskprtrade=abs(COUNTOFPOSITION*stoploss*pipsize)
RR=winnings/riskprtrade[1]


graph abs((COUNTOFPOSITION*stoploss*pipsize*pointvalue/equity)*100) COLOURED(255,20,147) AS "MAXRISK%"
graph maxriskrecorded COLOURED(255,0,255) AS "MAXrisk%recorded"
graph RR COLOURED(0,0,255) AS "RR"
graph winnings COLOURED(0,0,0) AS "Winnings"
Yes, System 3 1Hr is looking consistent across all. I think there are a couple of things we can perhaps look to do around risk management but also we don’t want to over-tweak it to fit results either. It should be applicable to other markets as well. Next perhaps I would prefer to see a % stop/limit in the code and then we can really see if it is robust as that should help reduce the effect of the absolute index value and also the type of index itself.
Thank you very much kasper! Improves program performance considerably with that risk management
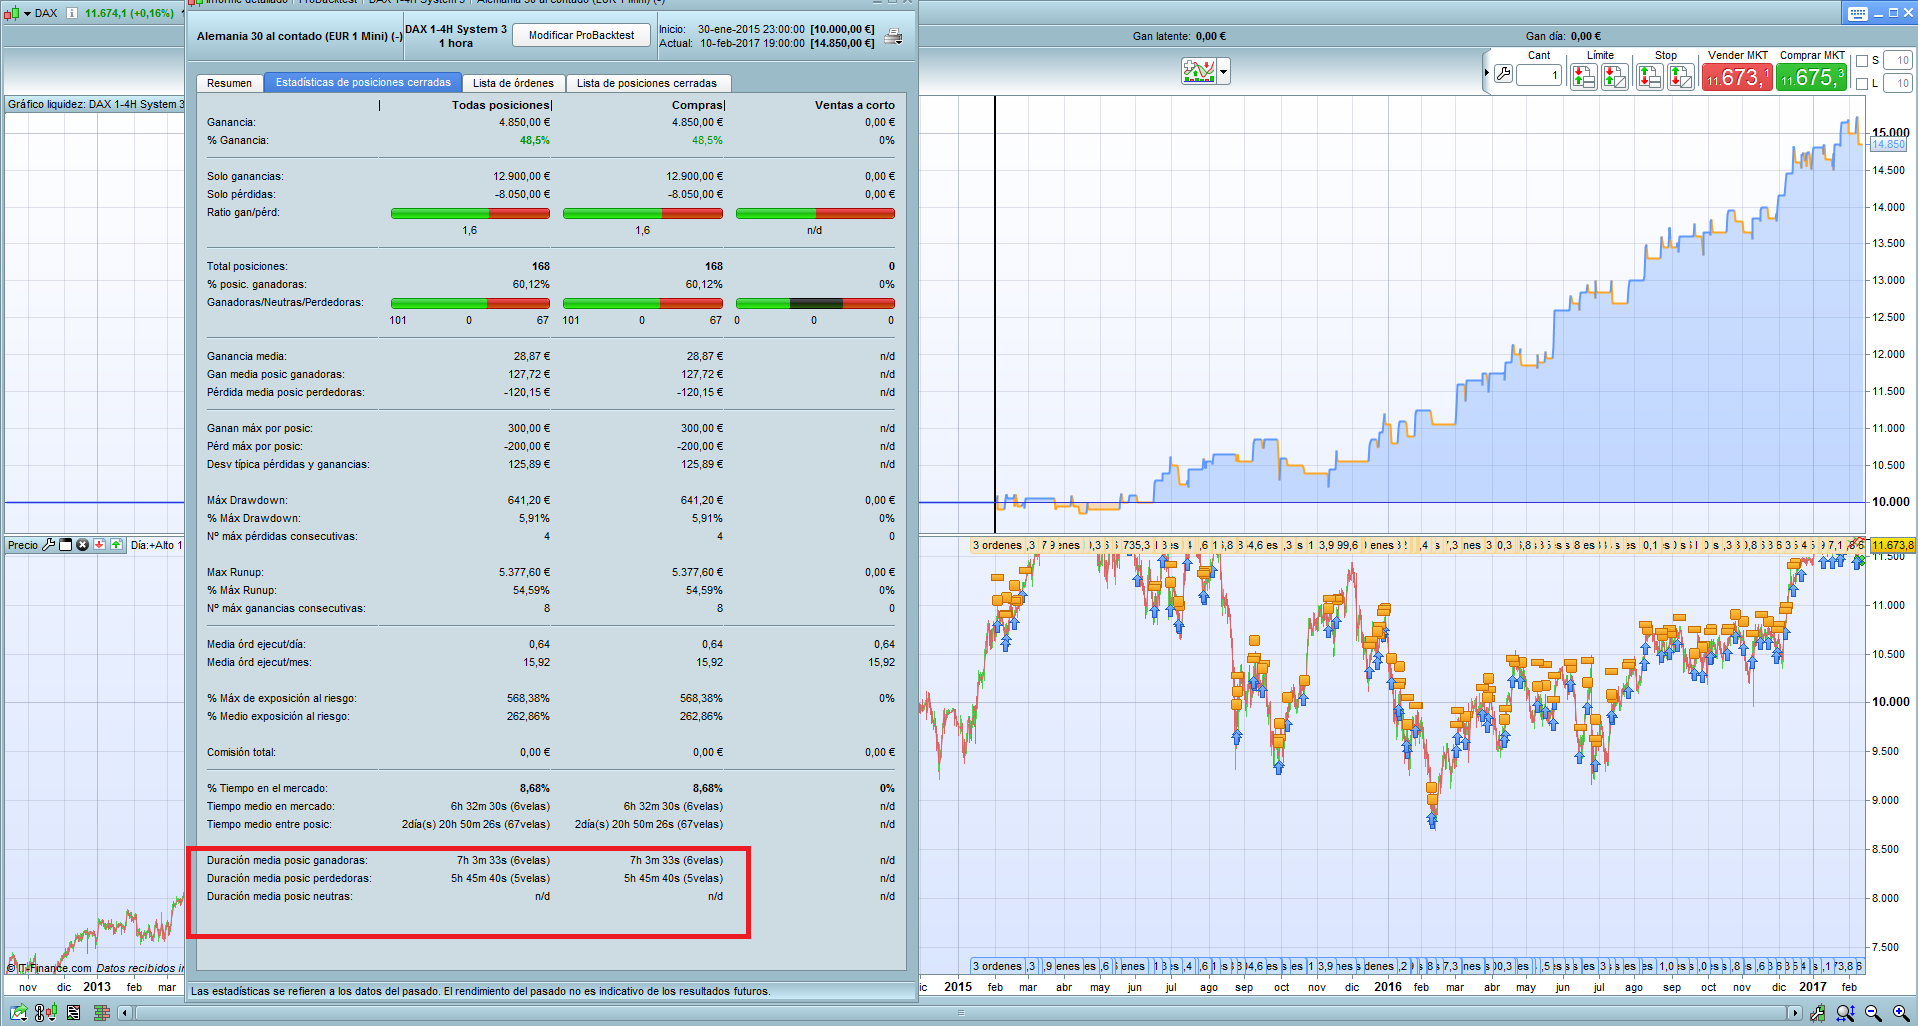
On the other hand, it seems that you were right, attached the data. We see that in the first year of my backtest (end of 2012 to 2014) the average time of operations is higher than in the last years. They go from lasting about 16 hours on average to about 5 or 6 hours with the highest volatility in the market in recent years. That may be why it’s been 10 years running slower than these last years.
Happy you like it- for lower risk adjust line 29 for:
MINpositionsize=1
it will lower the gain, but only risk 1% pr position at each trade.
Hope it makes sense?
Br. Kasper
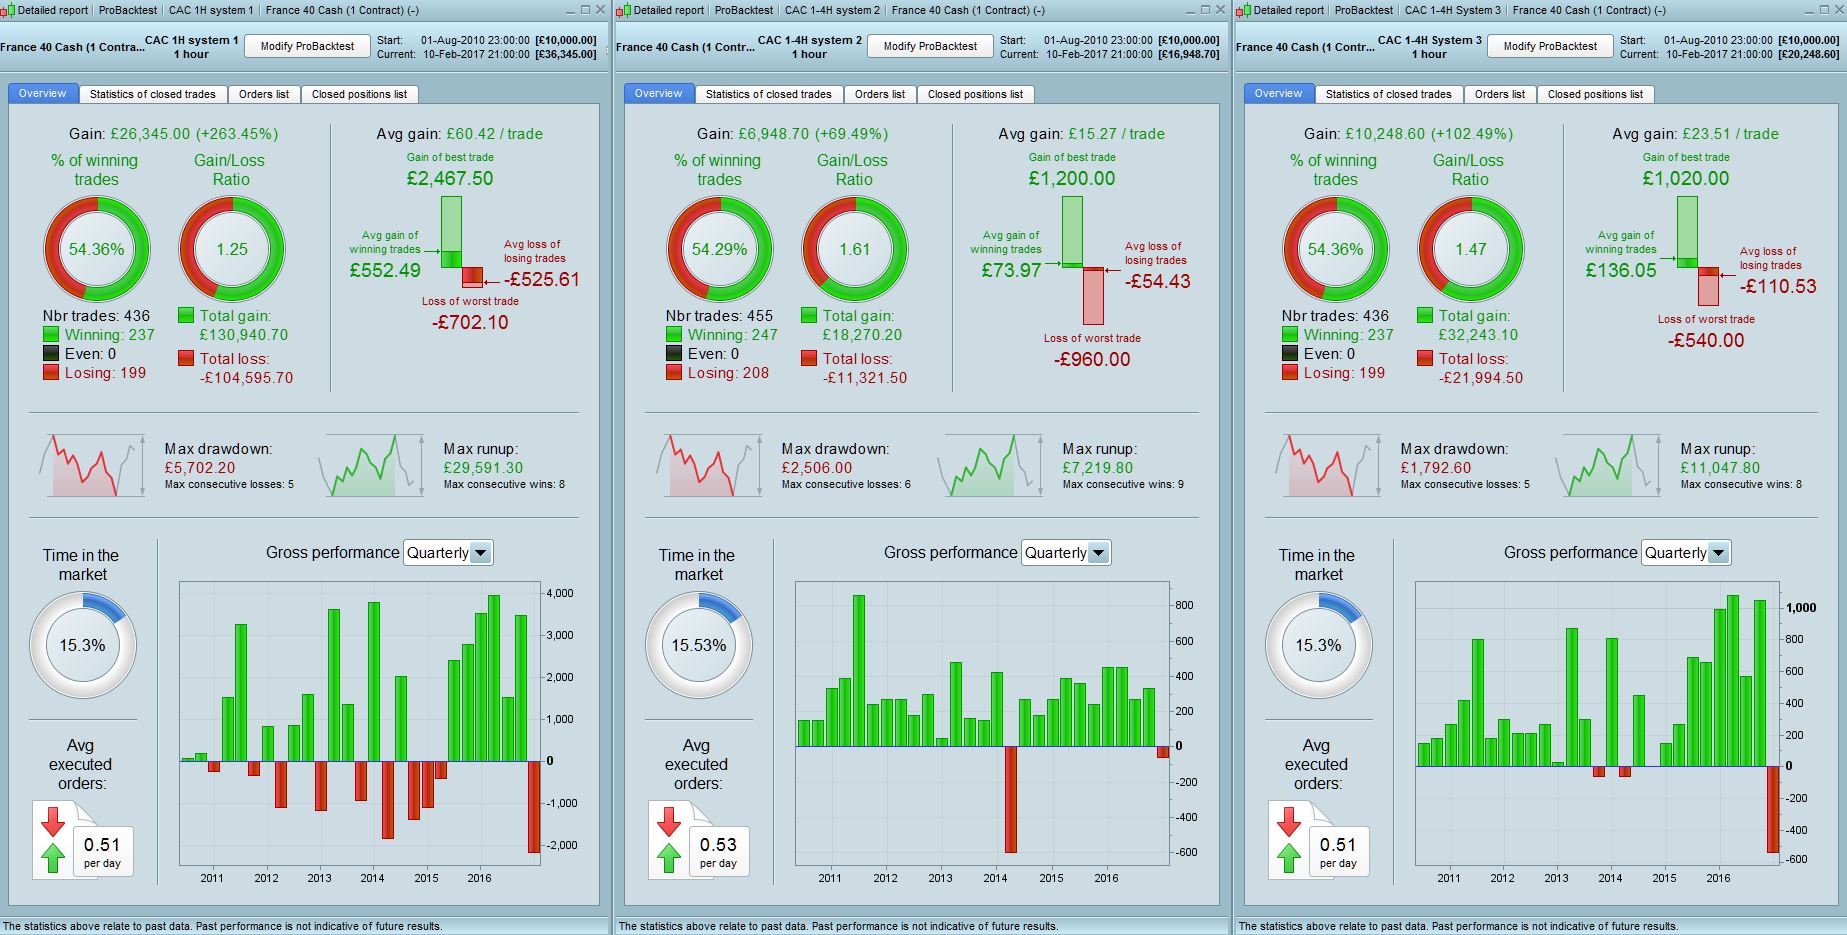
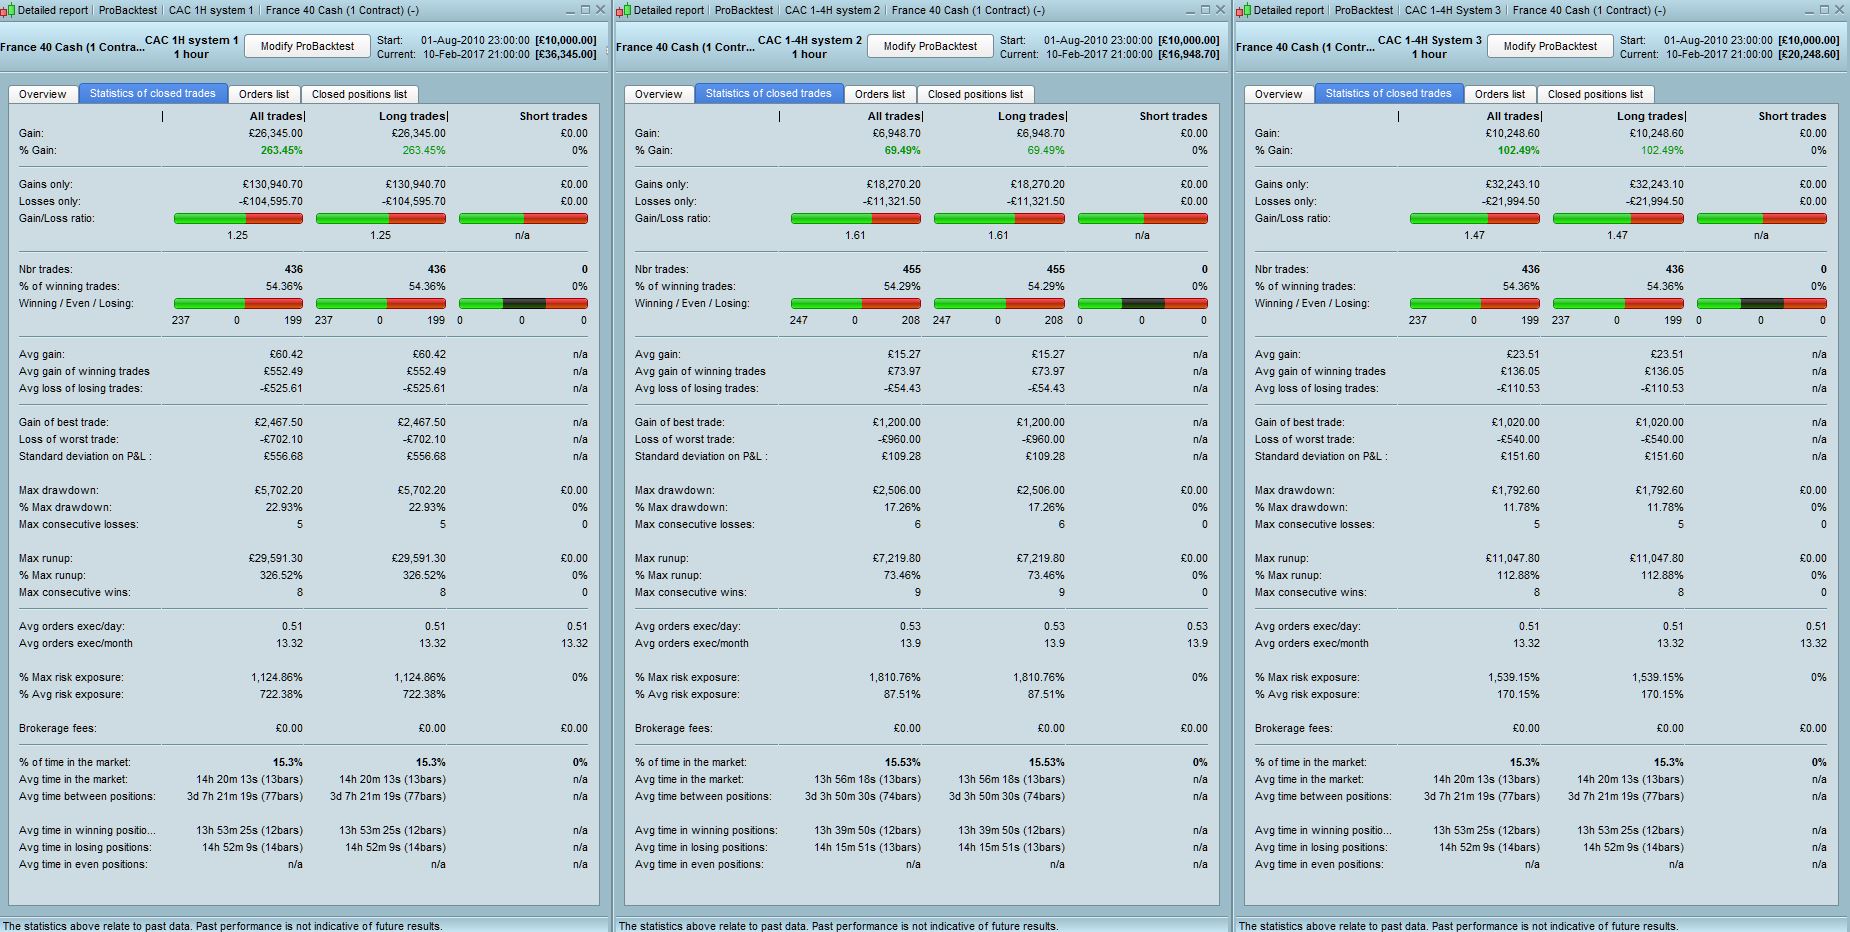
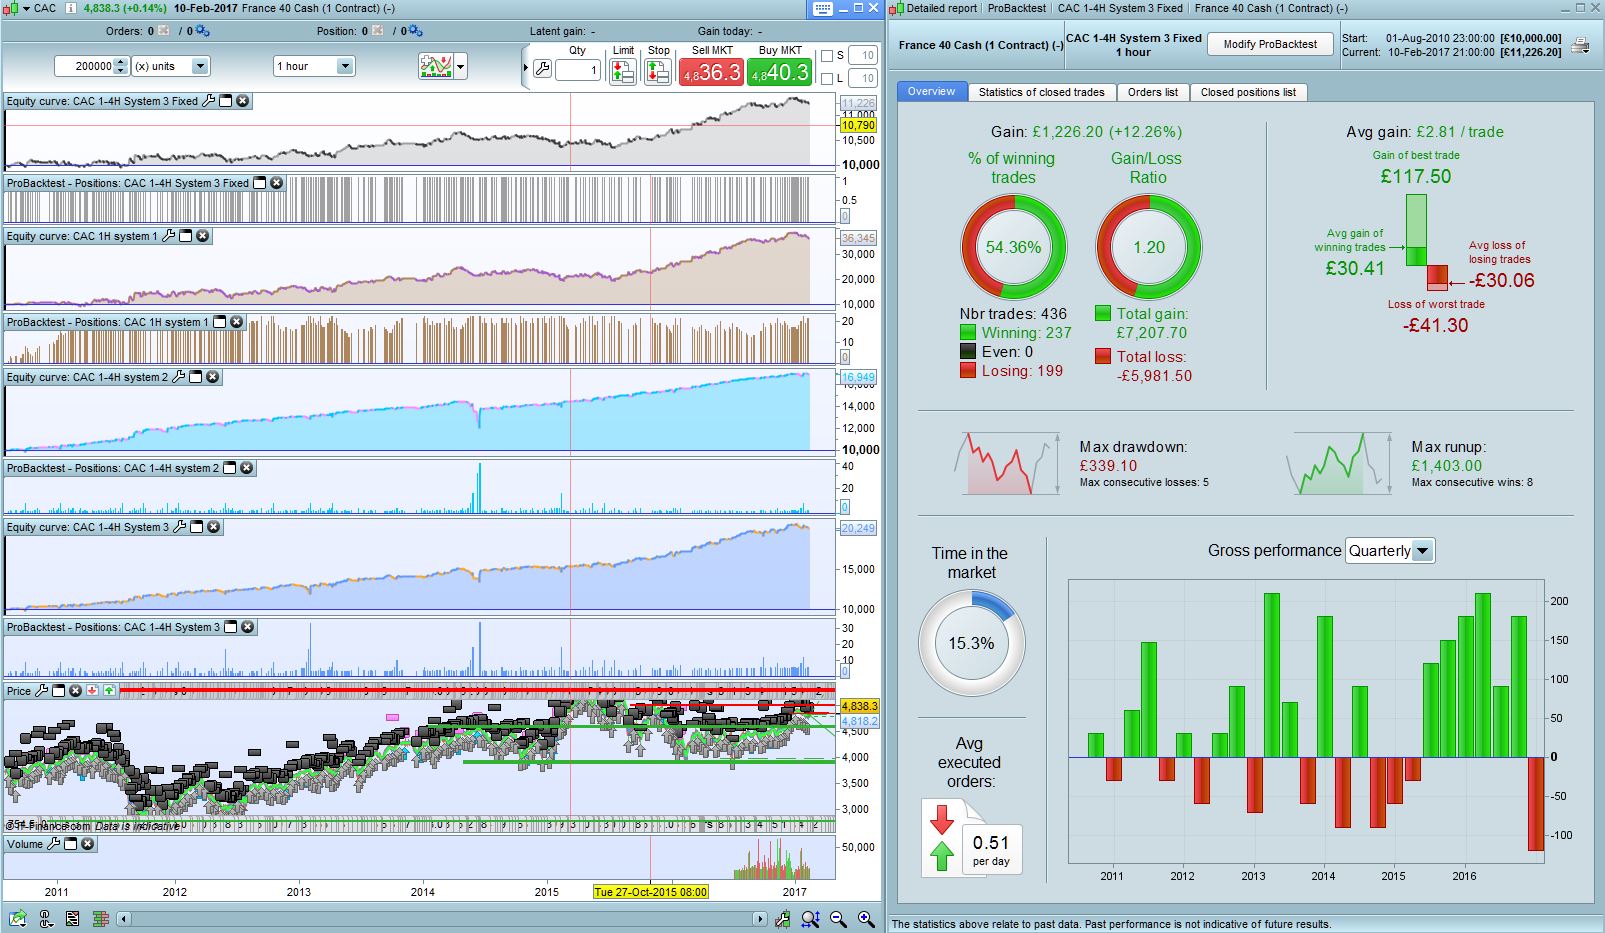
Attached are results for the CAC index for system 1-3 + fixed. Works quite well. Only change made to the code is that the sl/tp is changed to 30 from 50 due it having a much lower index value. System 3 still performs consistently with a max draw of 11.8%. I have tested tick by tick so I would think it means that the zero bar results are also accurate so no gains to adjust for, but am slightly puzzled why PRT did not return an error message while testing over this large timeframe as it did with the DAX.
Yep, good detective there on the average position times. Think thats backs up our theory that to achieve the 50 point levels in earlier years took longer hence contributing to the less reliable performance figures.
Adapting Takeprofit on average daily range could be an idea to explore. I made this calculation in an indicator recently :
https://www.prorealcode.com/prorealtime-indicators/daily-atr-range-for-intraday-chart/
I let you test this Sunday morning idea for me 🙂