Hi guys!
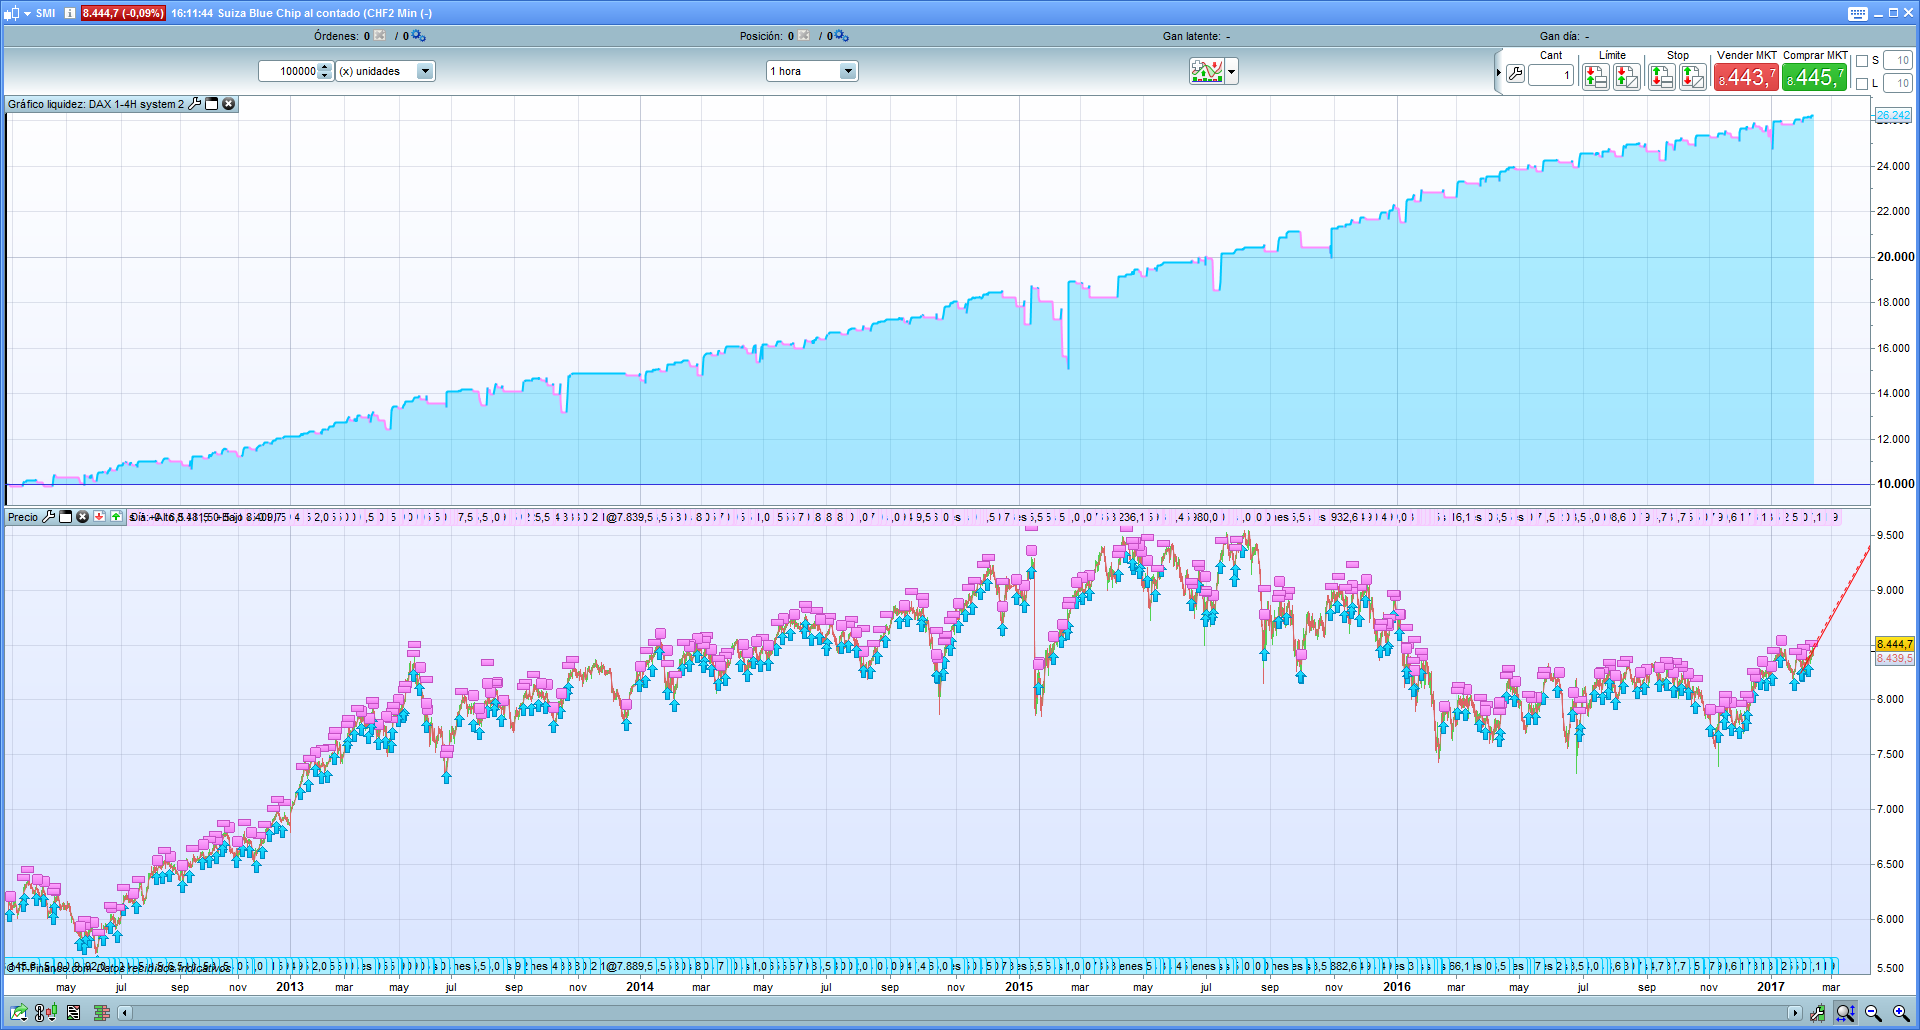
I hope your constructive criticism as always to improve the system. This system is an adaptation of a system of a companion of the web. Attach the screenshots. System 2 and 3 operate on DAX 1H and 4H, System 1, only with DAX 1H.
As soon as I can upload the library, I attach the .itf below.
Here is a quick test and review with 200k bars for the 1 hour strategy (still don’t have import the 4 hours ones).
- even if it’s long only strategy it performs with less efficacy in 2009/2010/2011
- good point that no indicators periods have been optimised (MACD 12,26,9)
- semi-martingale (*2 order size if its a loss and minus 1 lot if its a gain) could be modified to see if the strategy is still as good with fixed lot size?
- tp/sl 1:1 is nice, what happen if the RR is more than 1?
Thanks again for sharing codes and ideas! 🙂 Another thread that will certainly grow up in the next days.
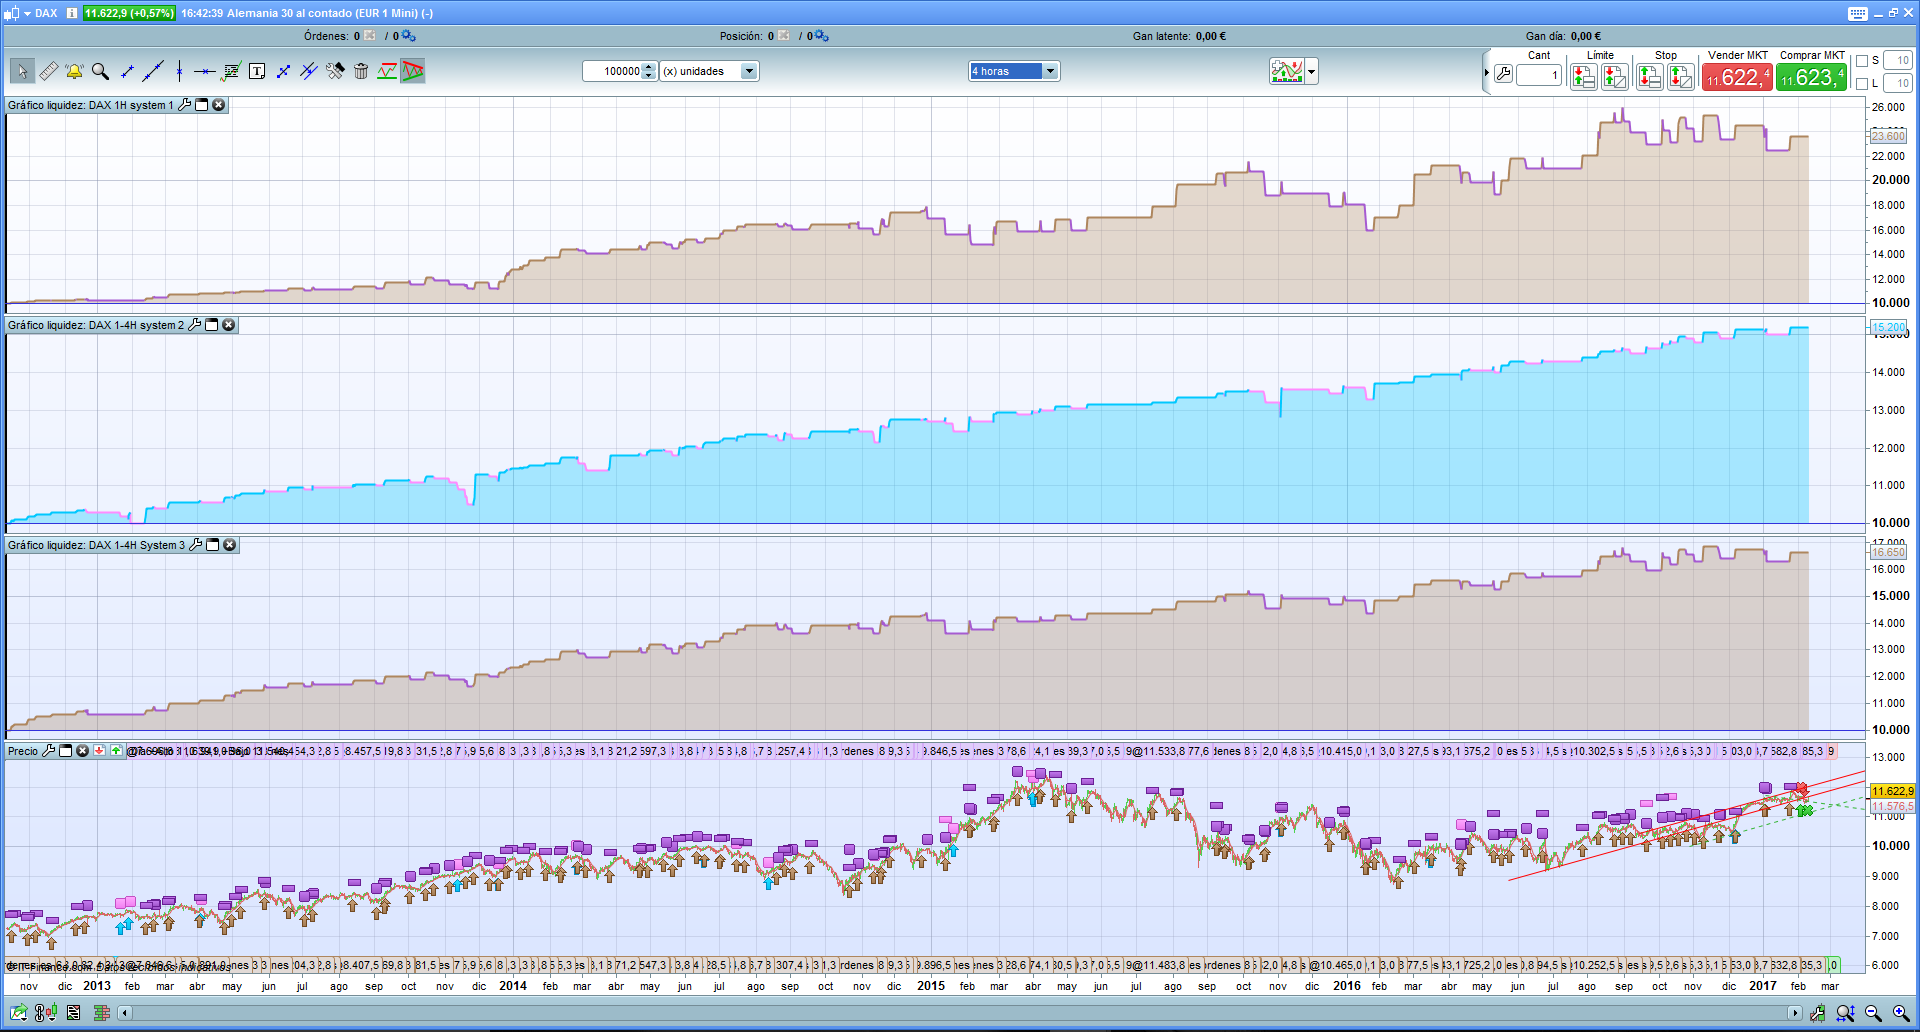
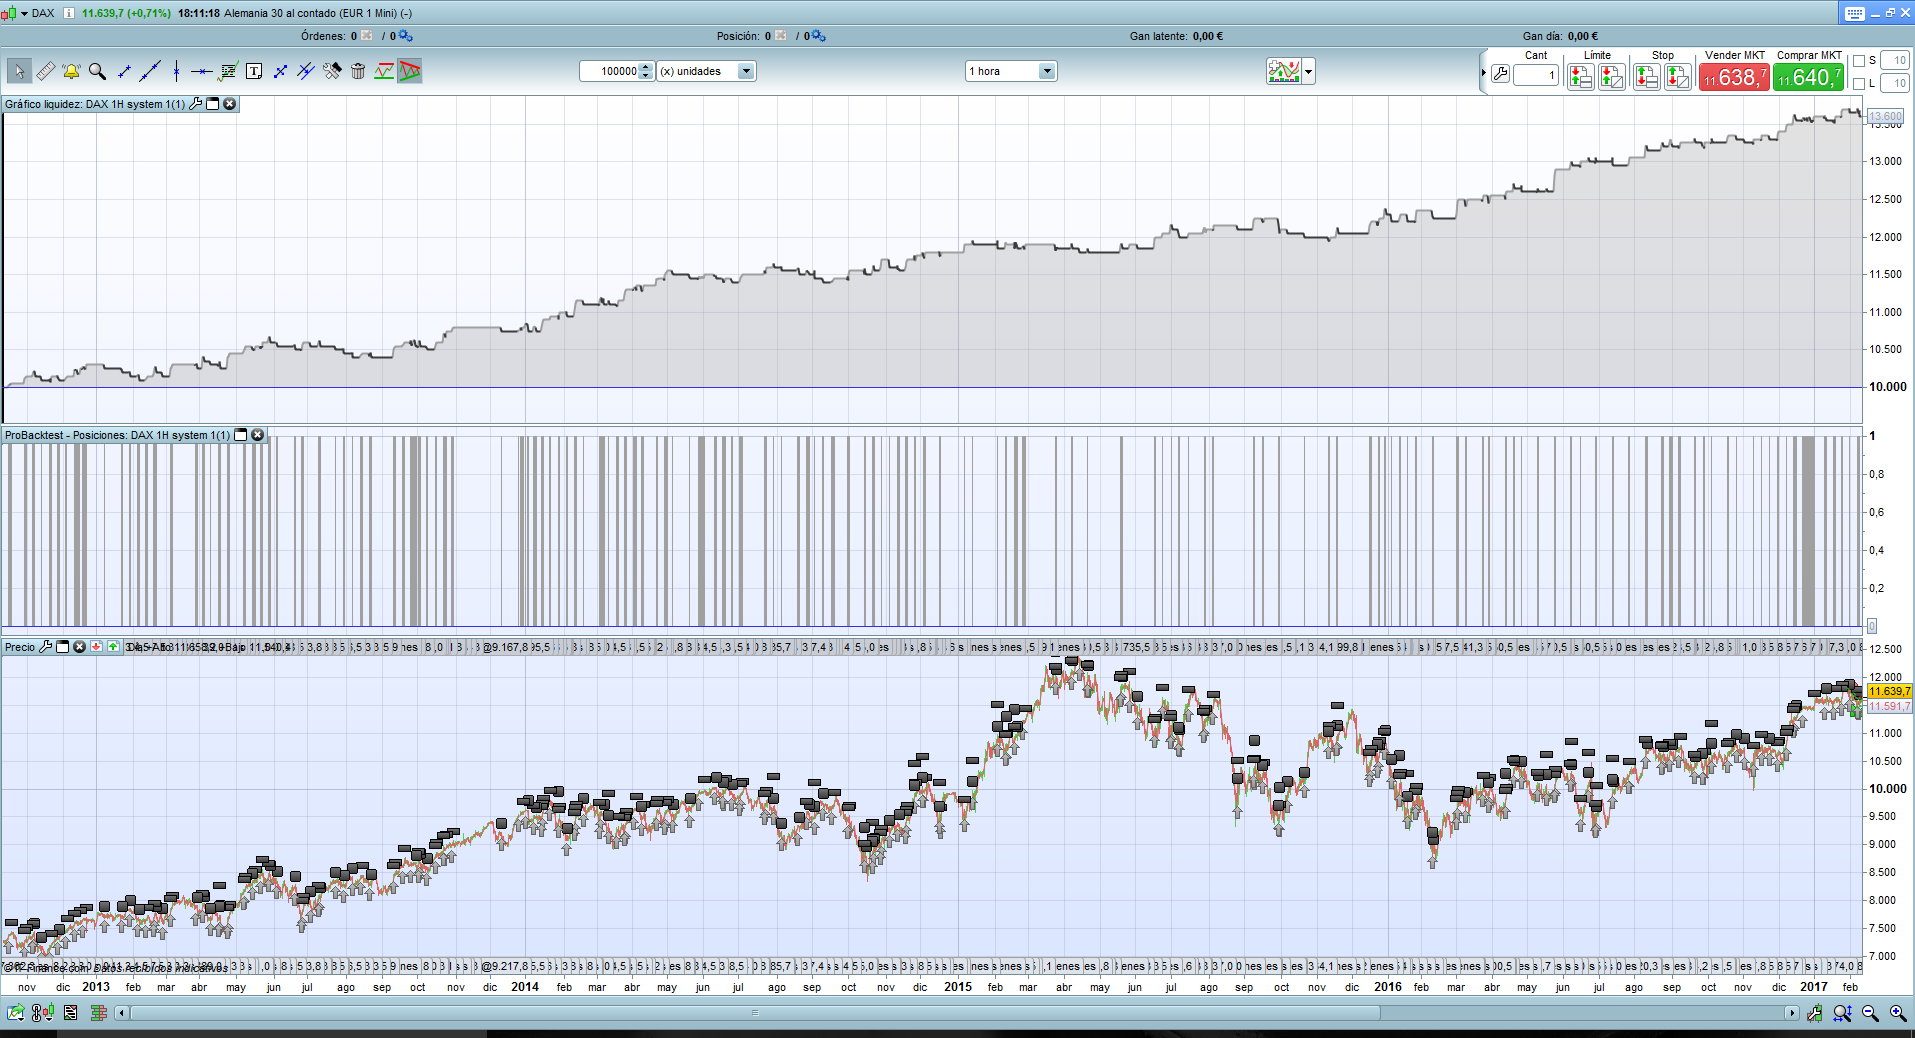
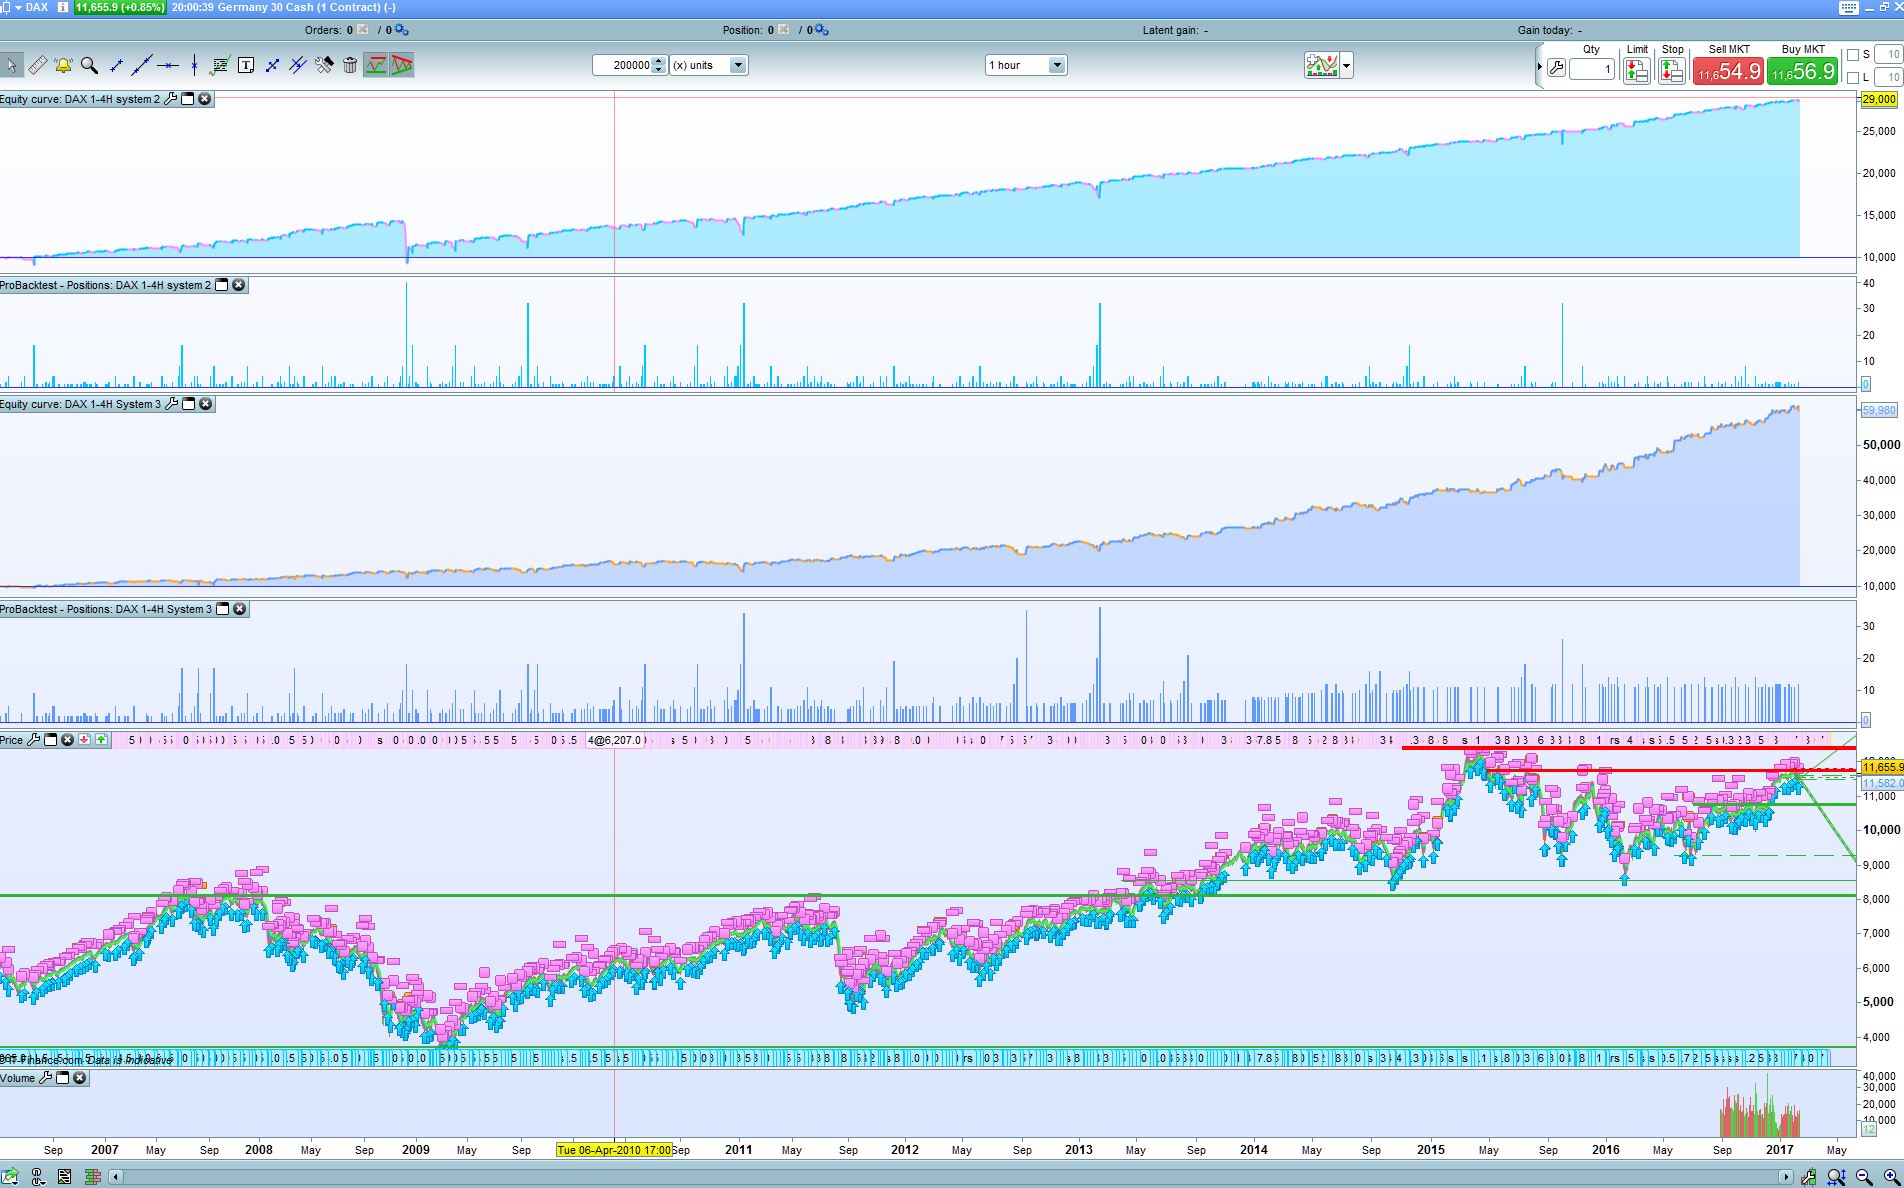
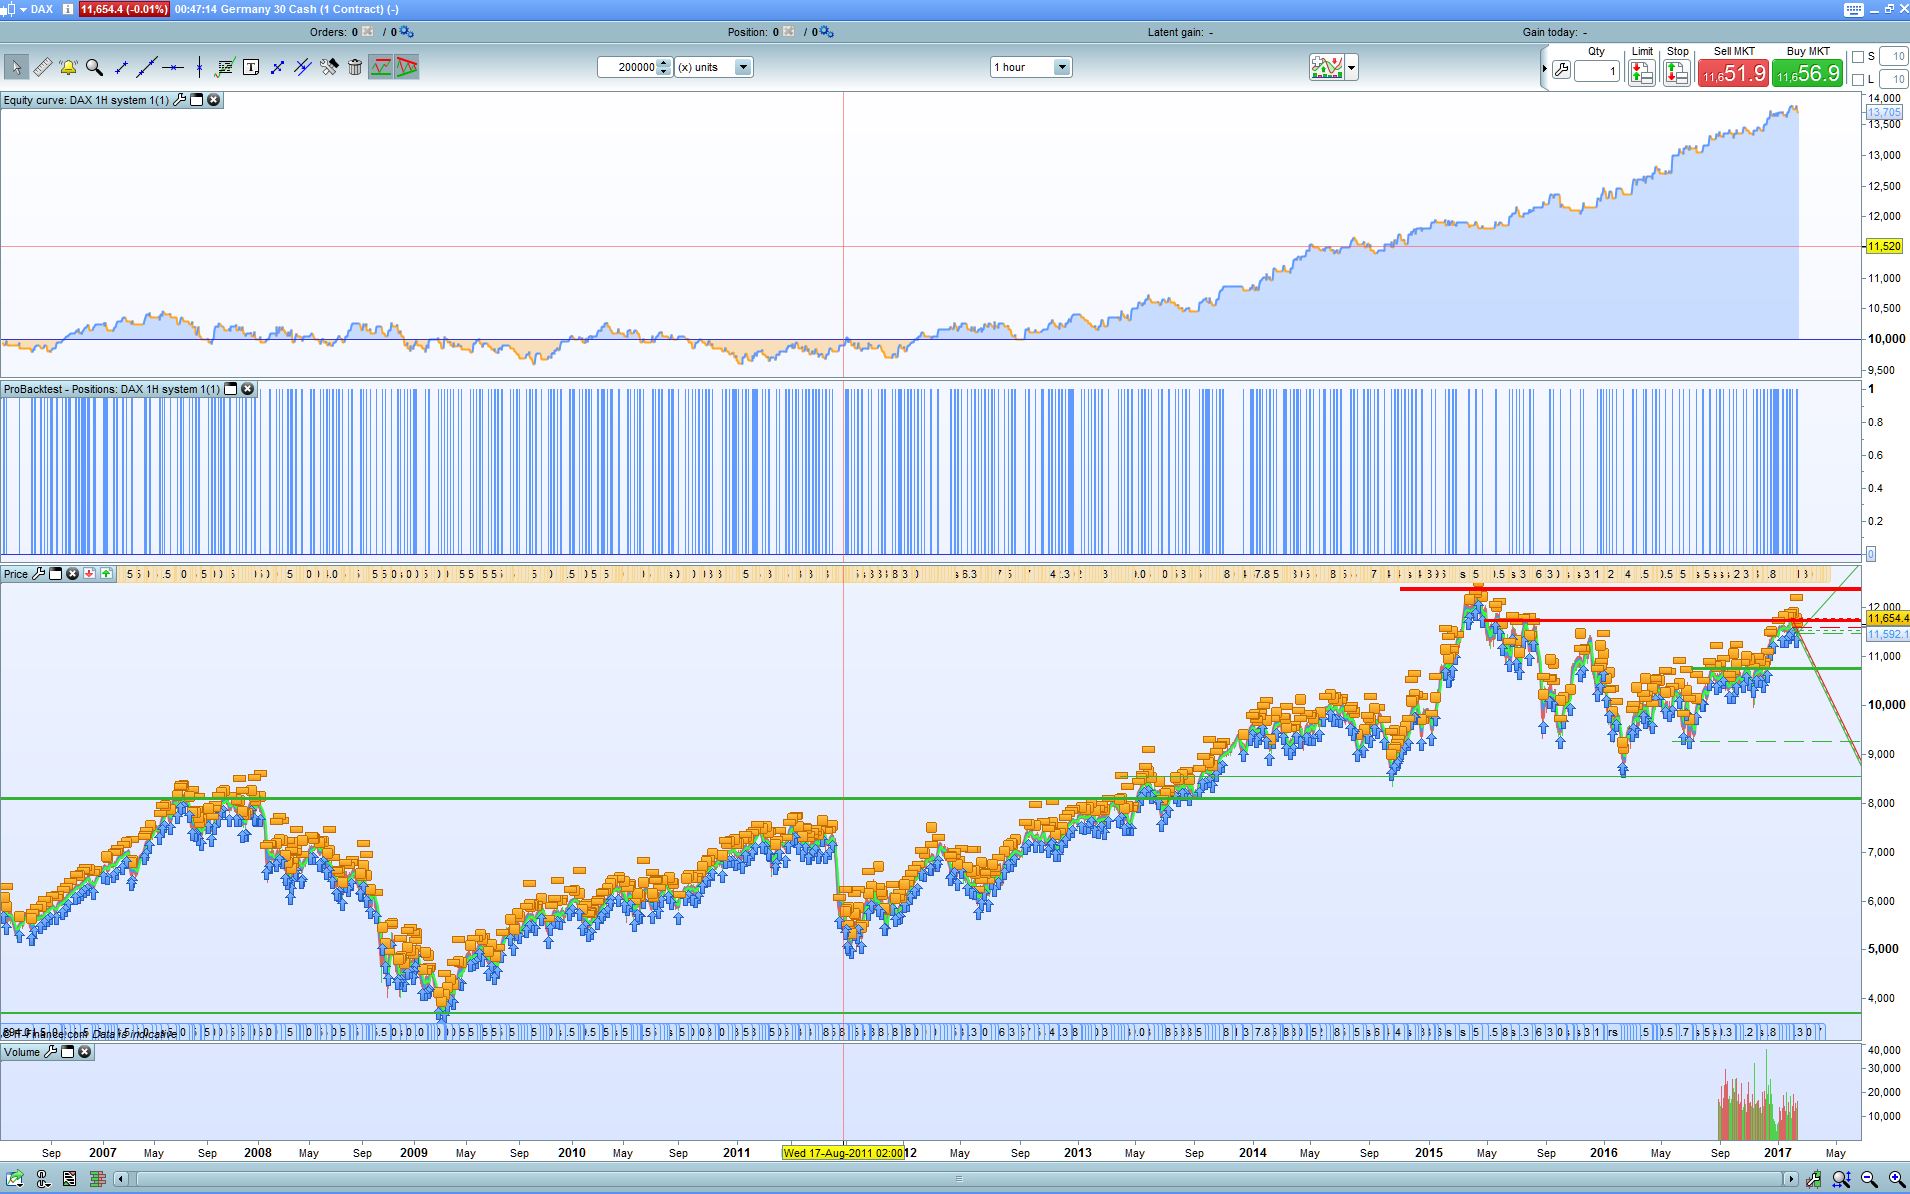
Hello nicolas, attached screen capture with 1 fixed contract, without semi-martingale. (Image 1)
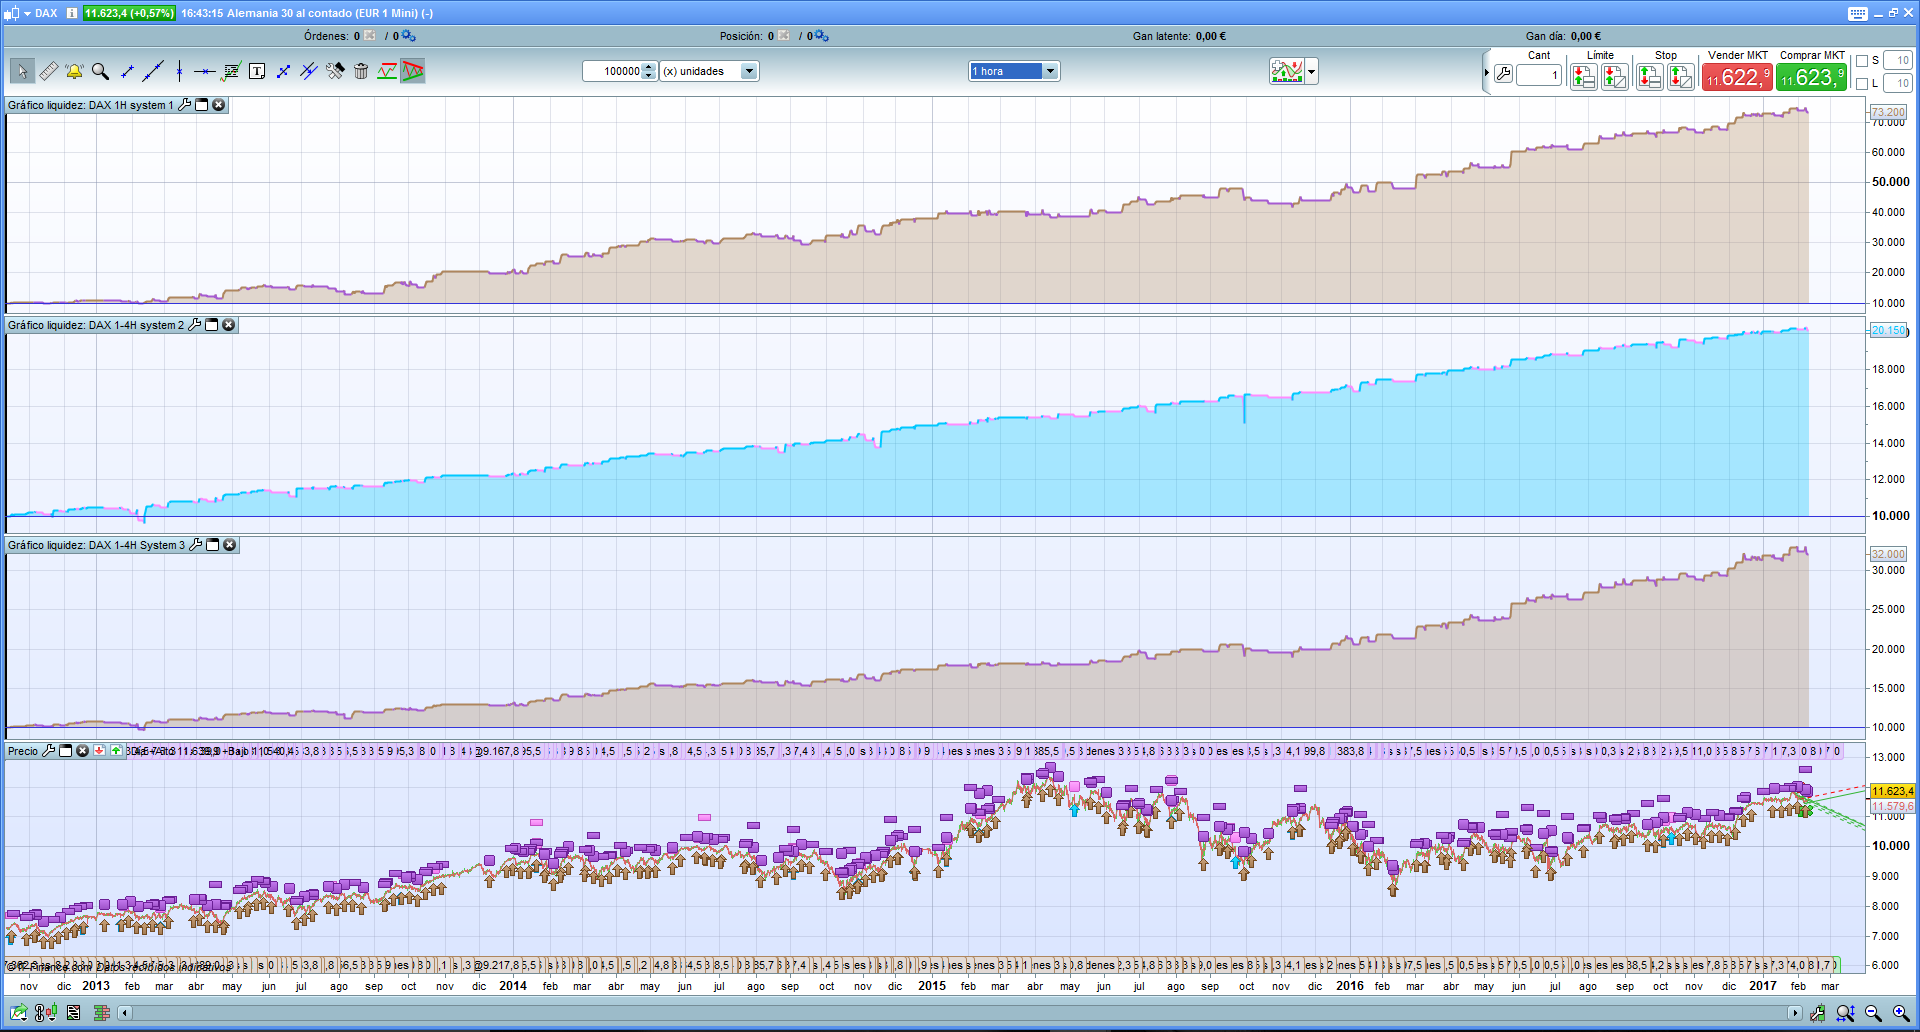
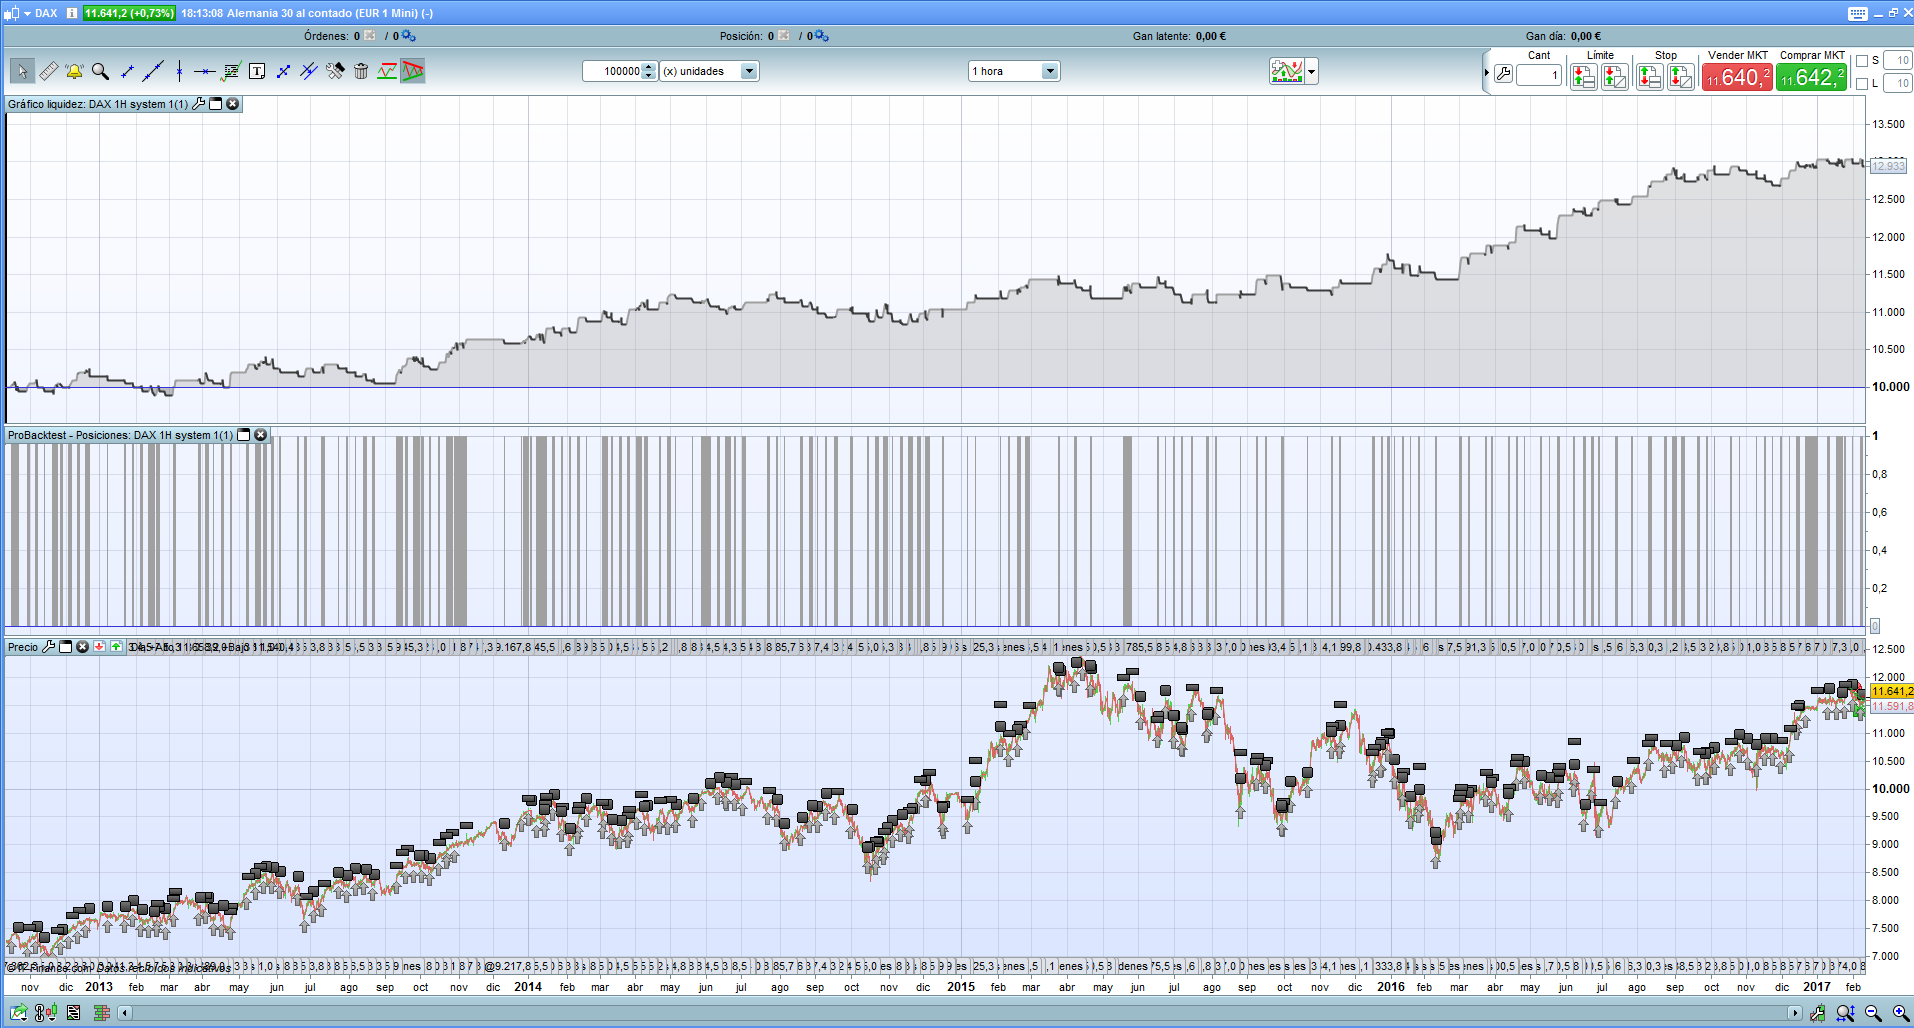
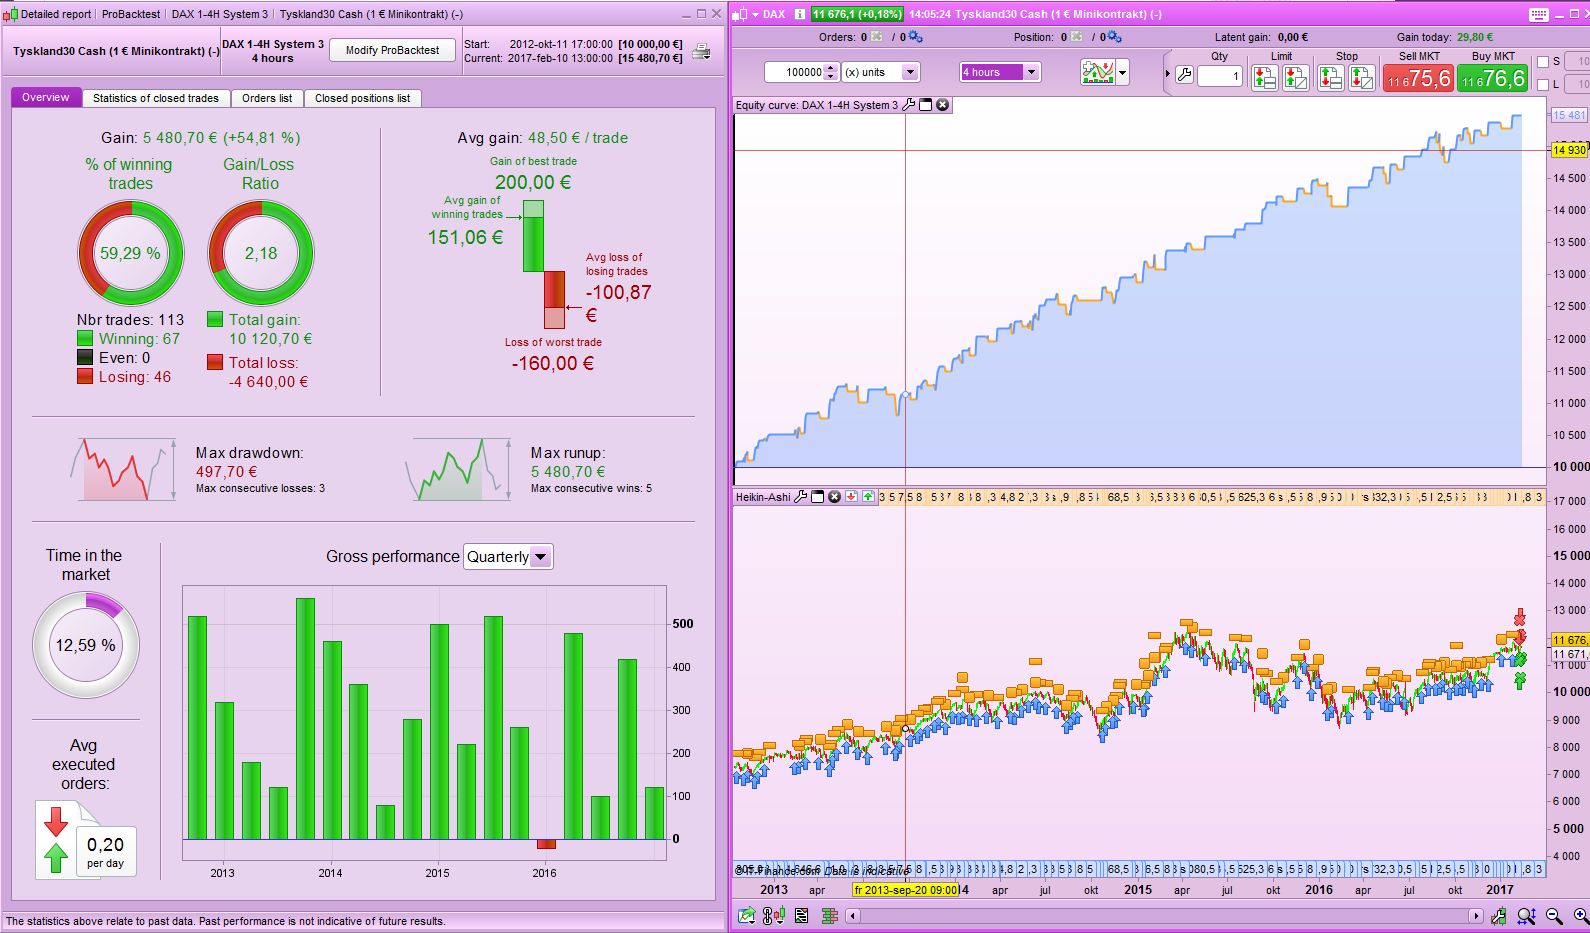
Screenshot with 1 fixed contract and with stop 50 and take 100. (image 2)
To see if anyone has time and can test the 3 systems or any of them with a single contract always with 200,000 bars.
Attached robot that only introduces a contract always.
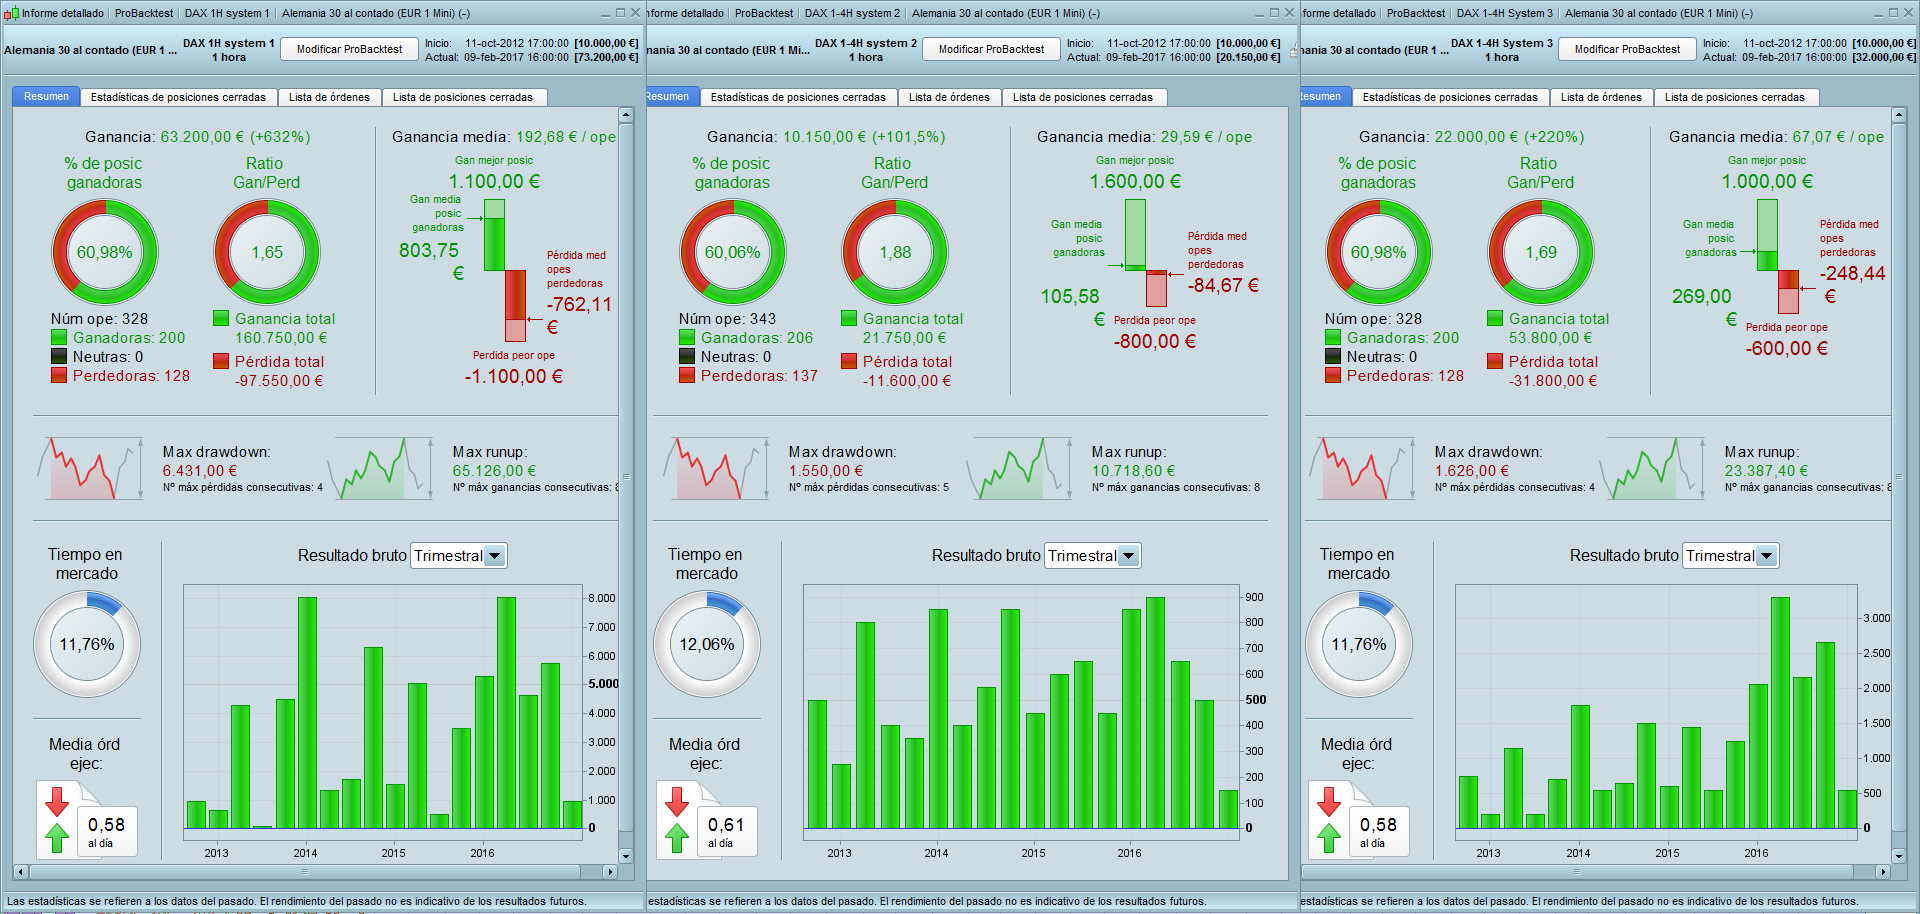
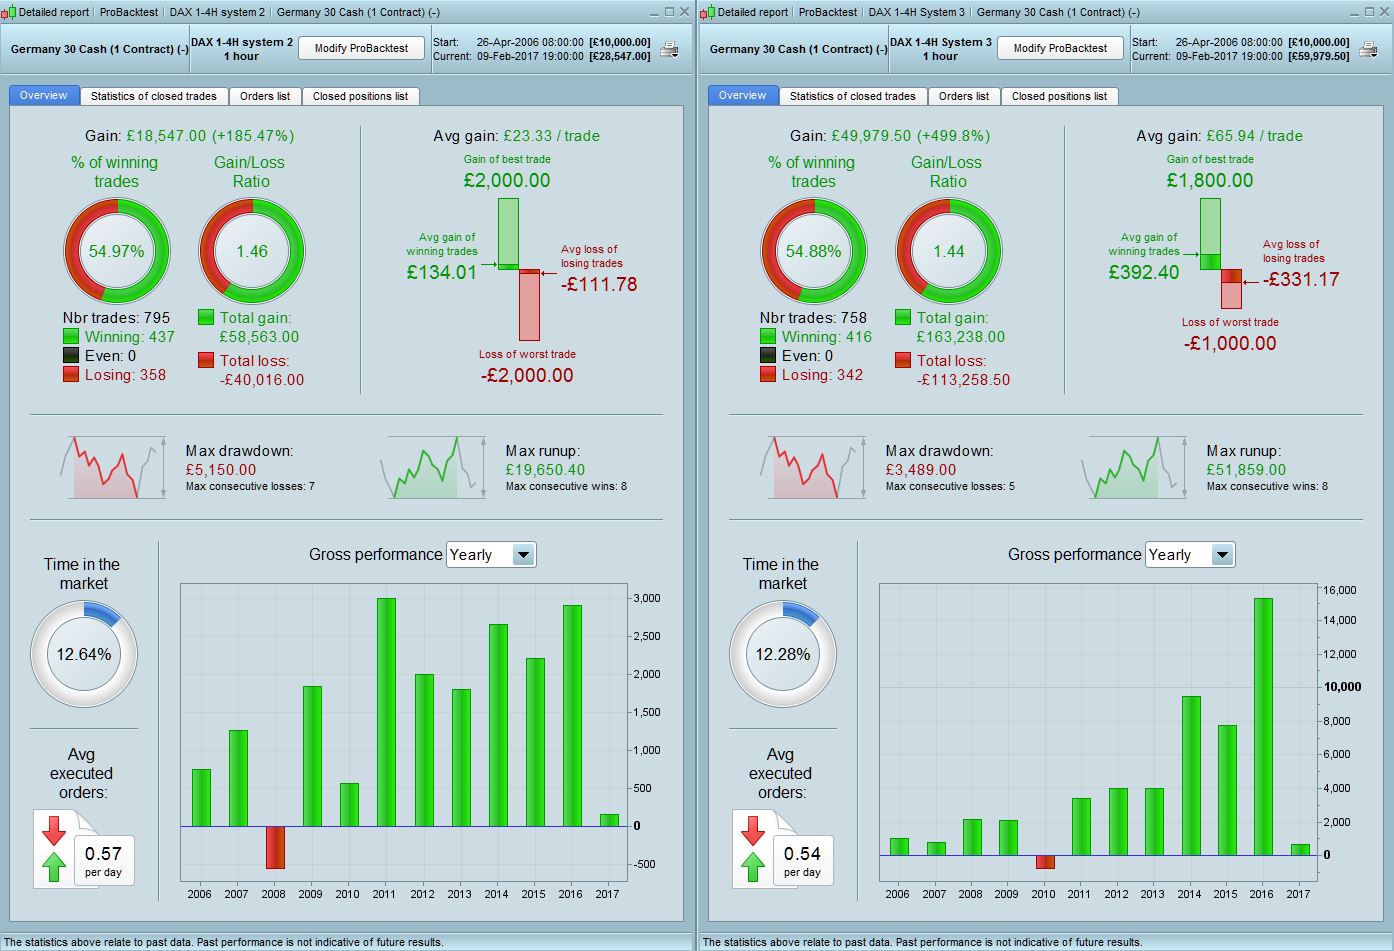
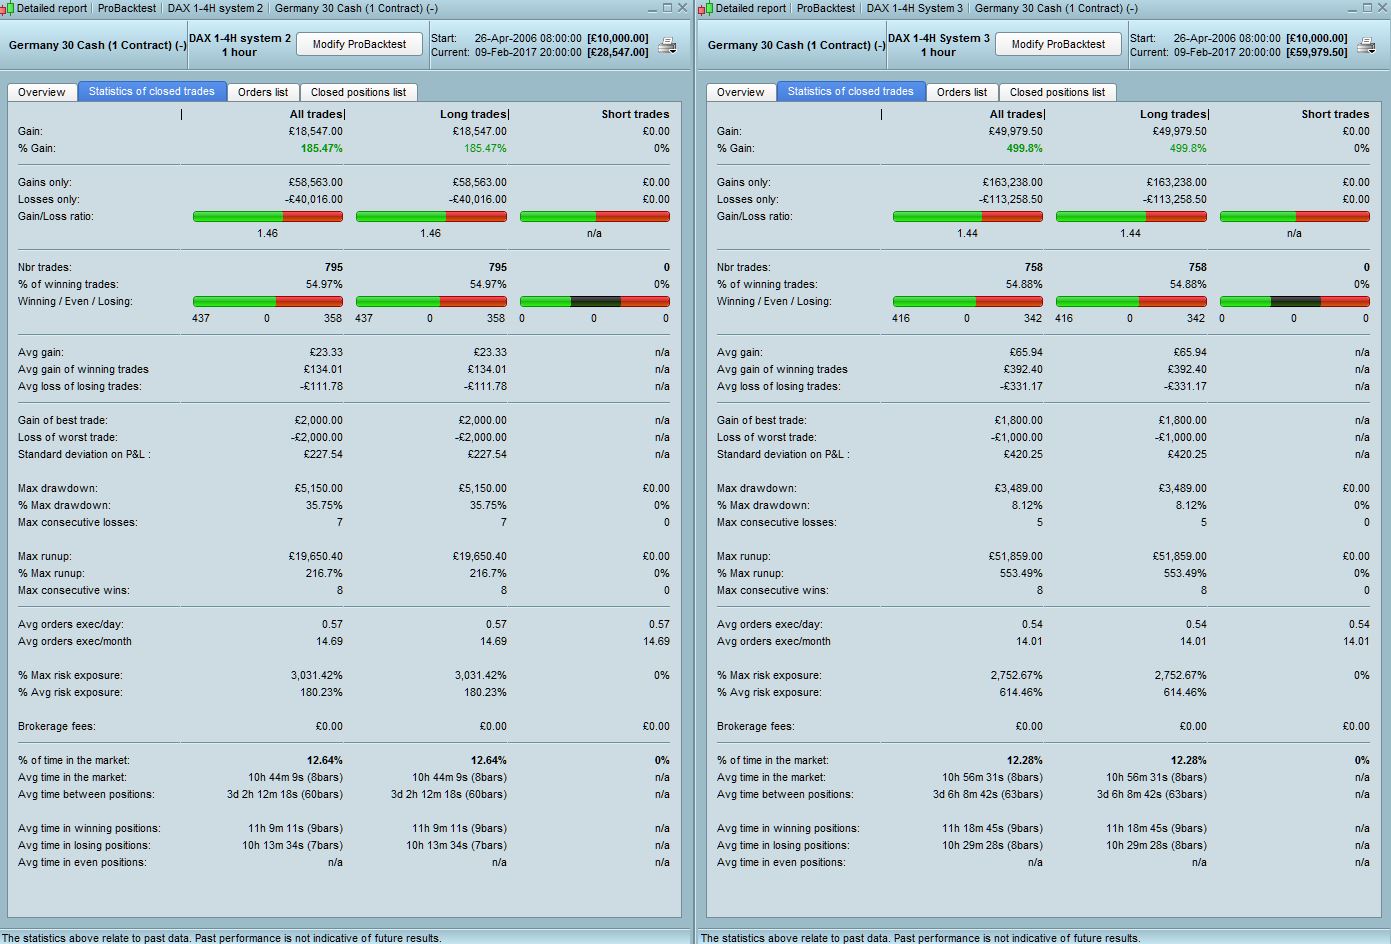
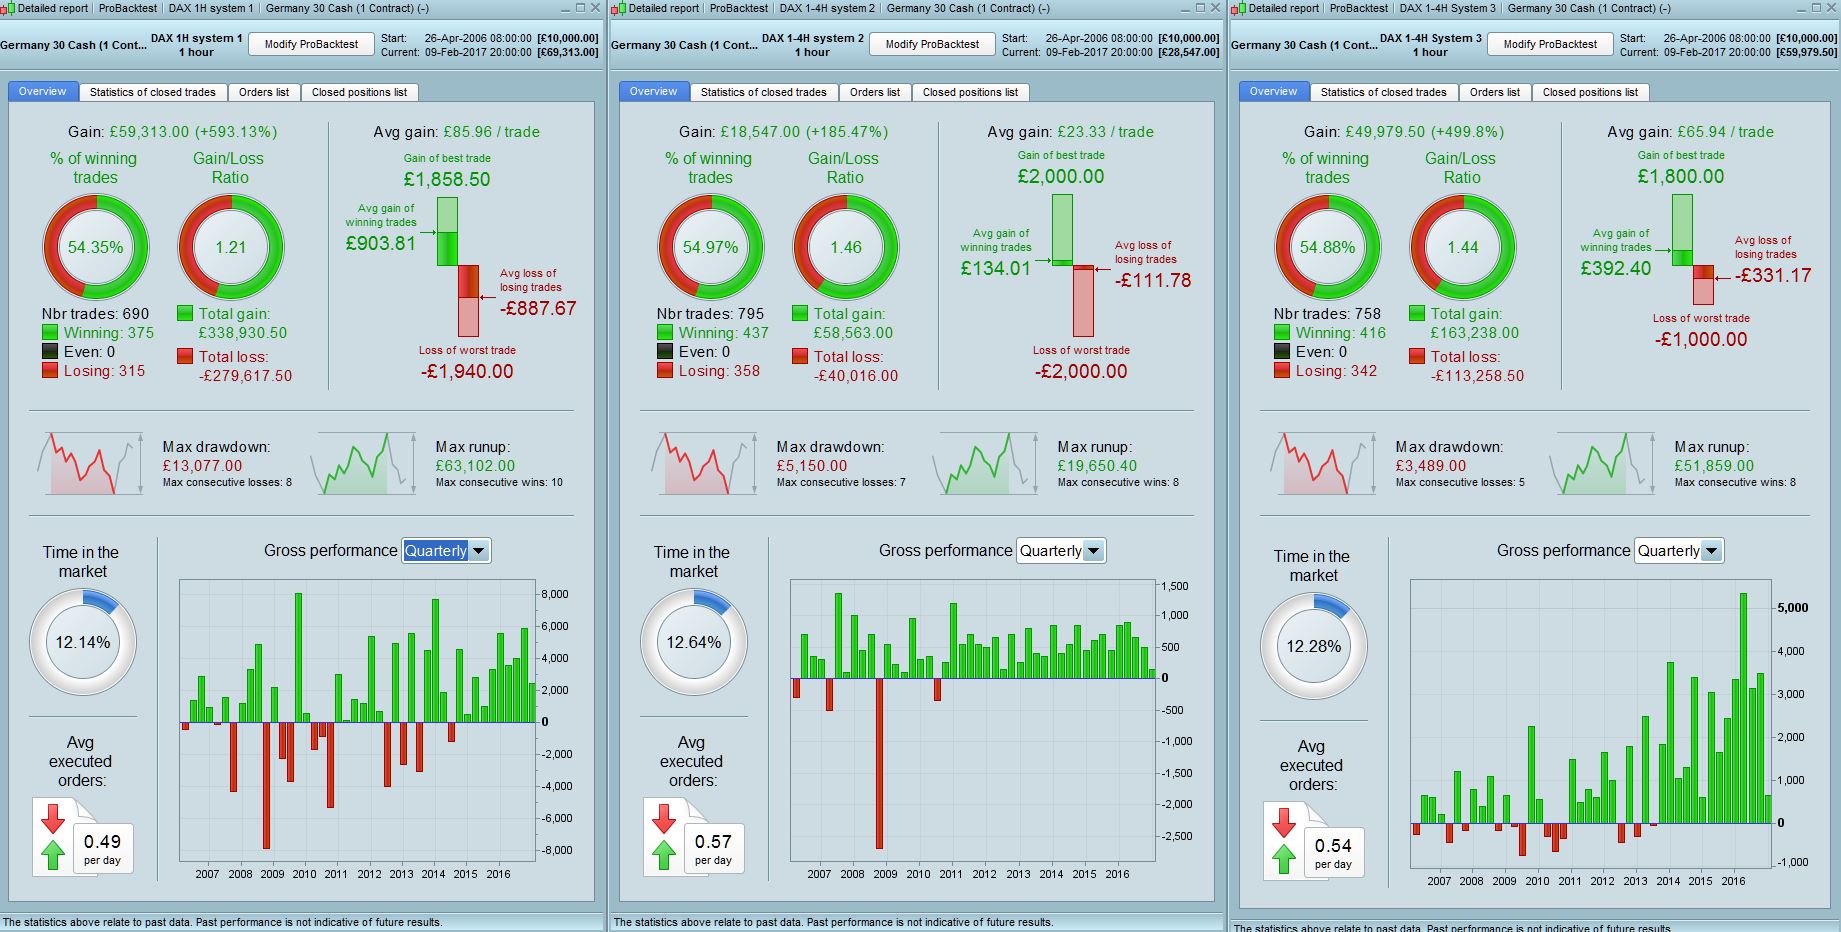
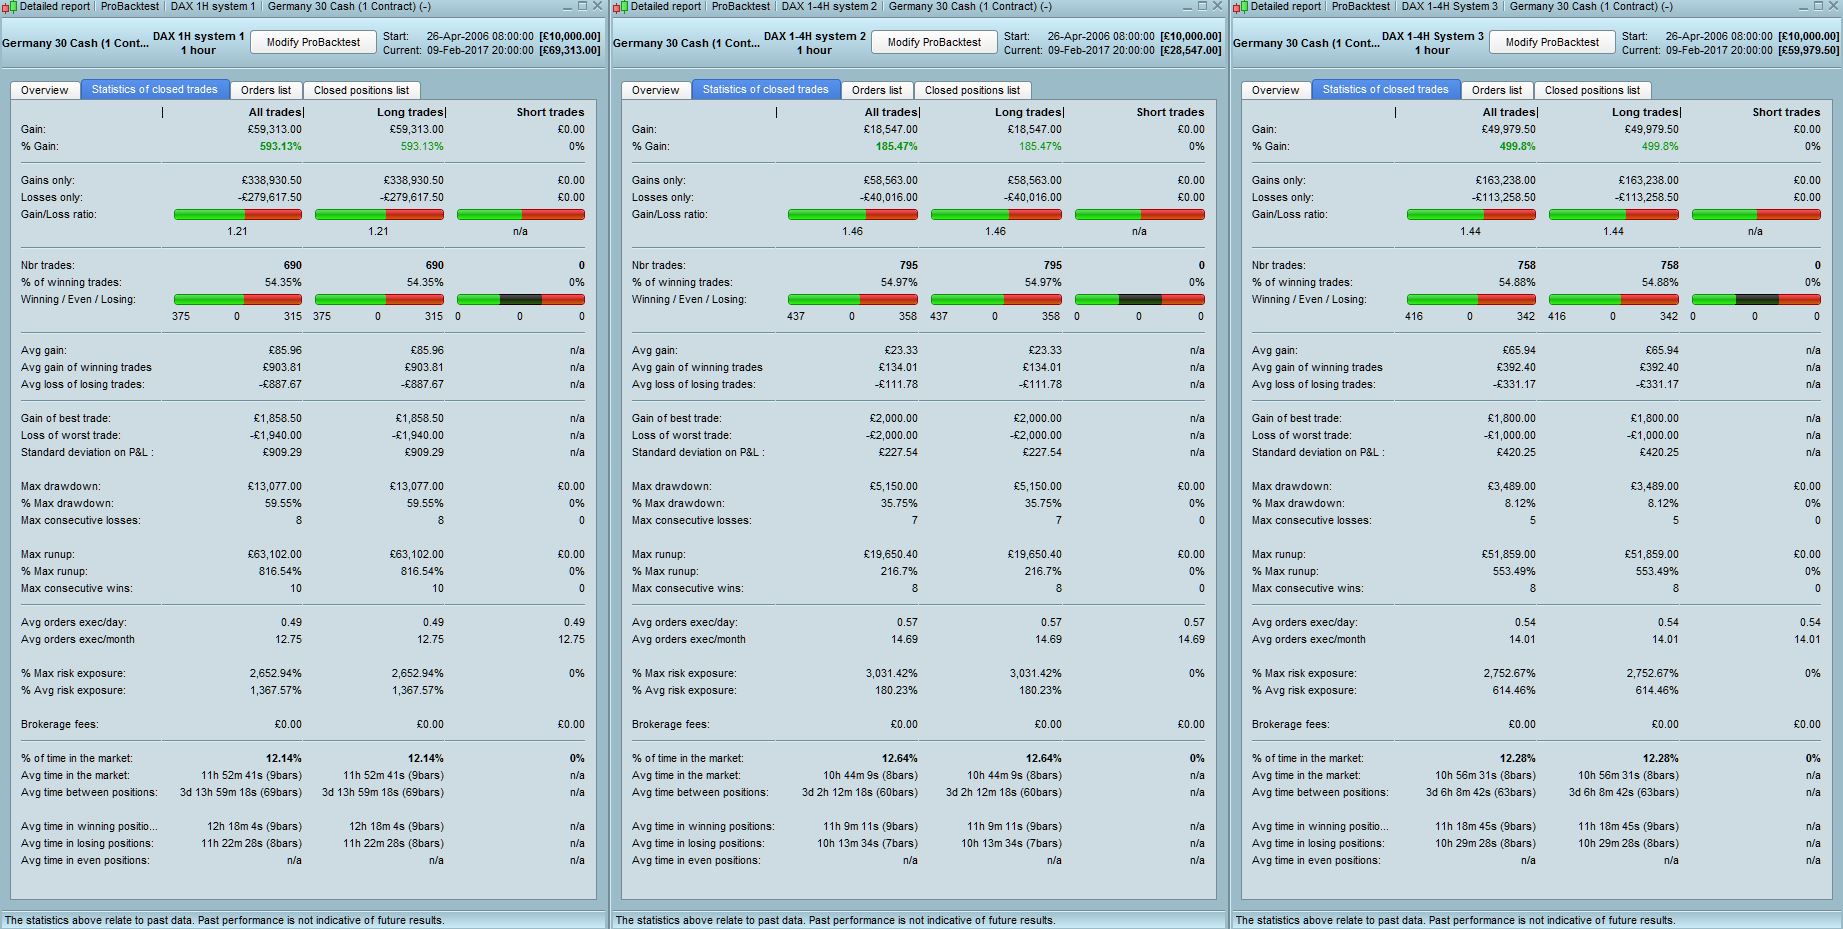
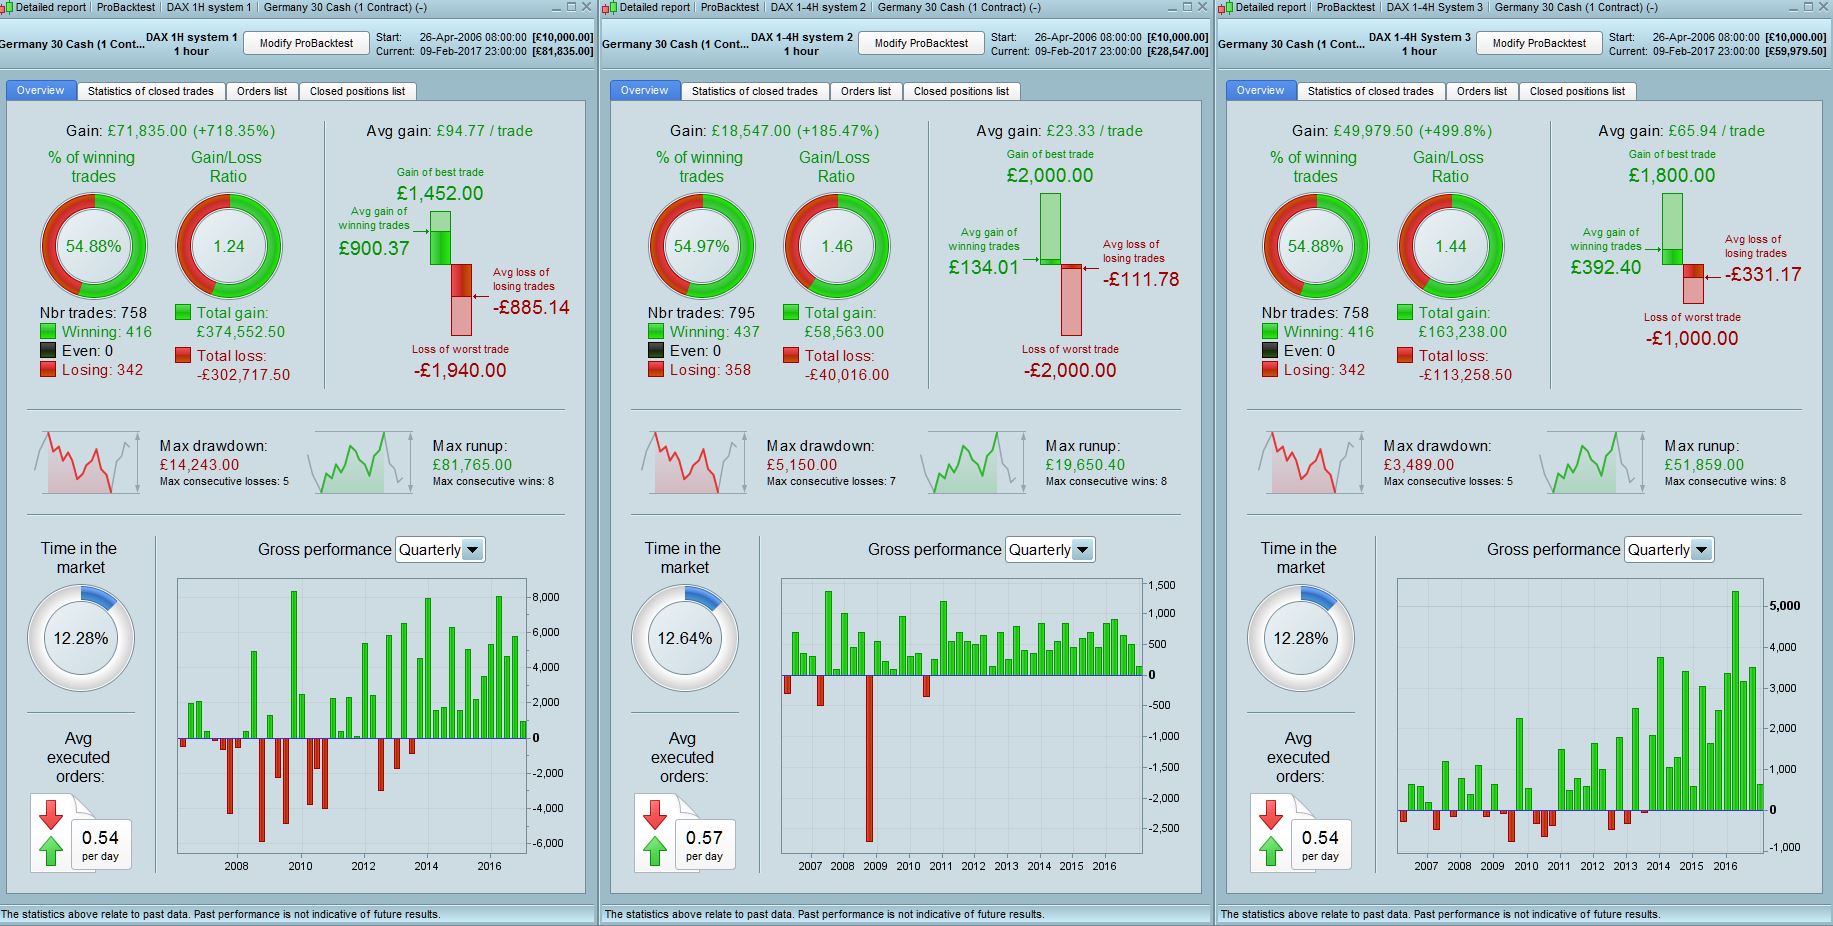
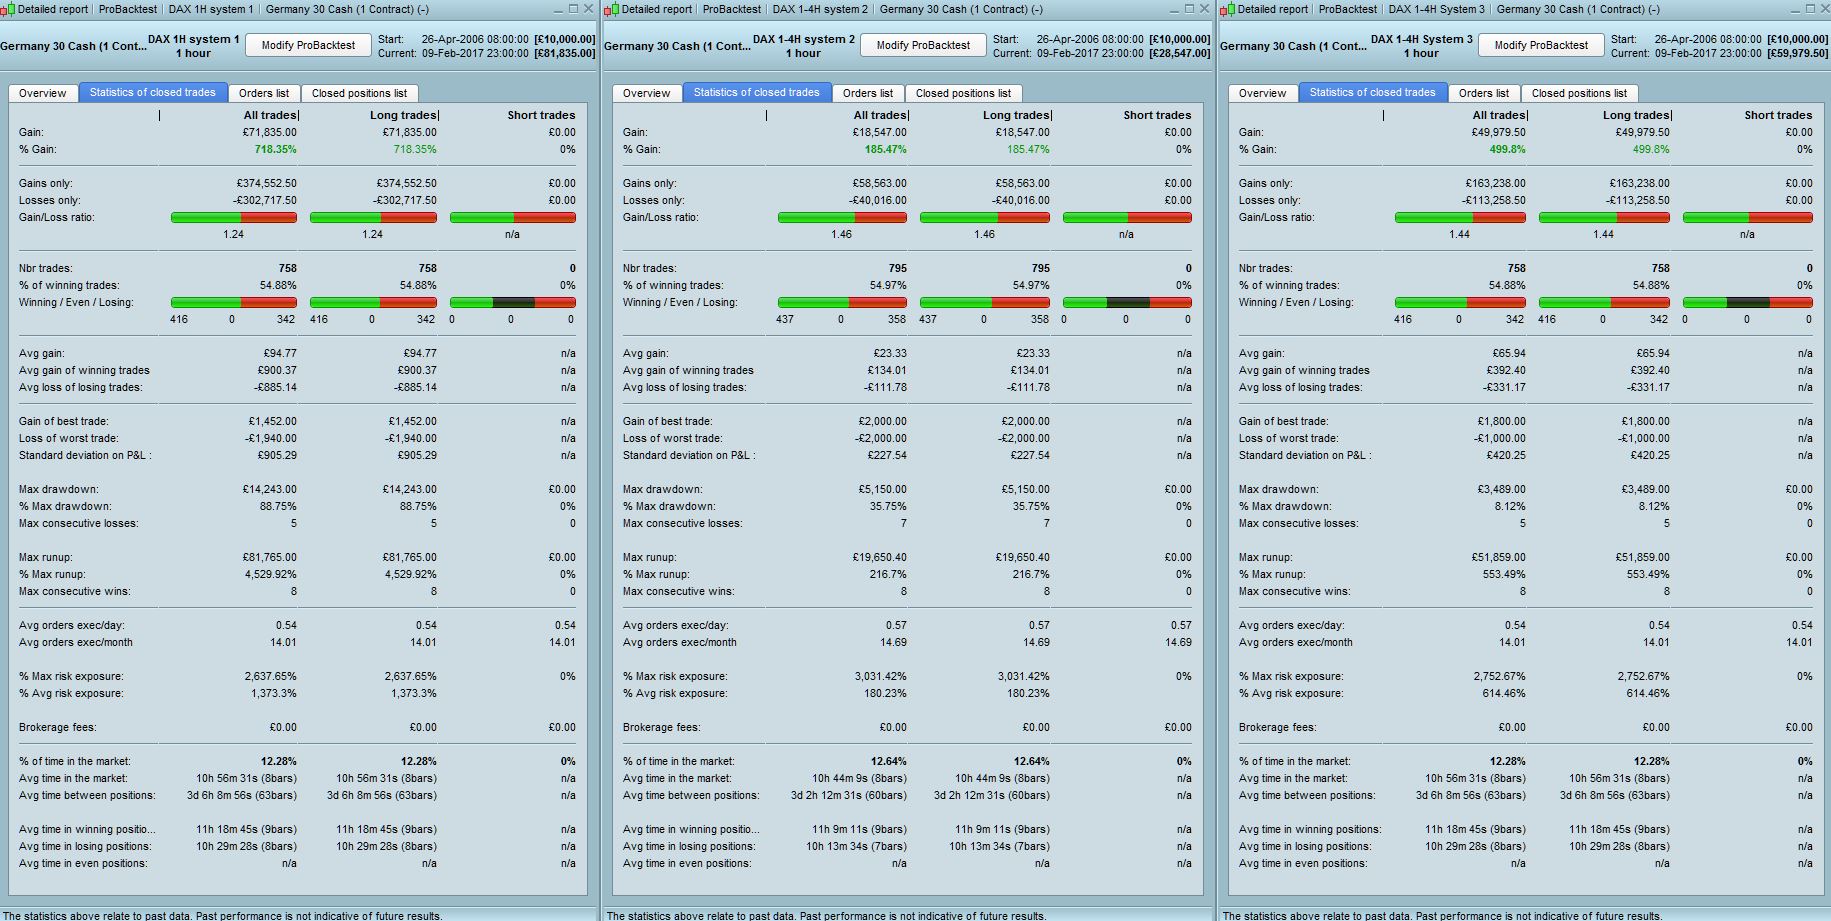
Hi Raul – Many thanks for sharing your hard work. I have tested system 2 &3 in 1Hr TF over 200,000 bars. Attached are the results.
- System 2 looks to be more consistent for those with a lower volatility appetite
- System 2 – The Max drawdown of £5k+ (35%) occurs over the Dec 2008 period when there was considerable gapping and volatility hence why the draw is so high so probably not reflective of a usual result. Would need to look at periods post this to see what the next biggest or a “normal draw” would be
- System 3 has better results due to consistent scaling up of positions and the draw is only 8% which is pretty good.
- There are zero bars in both cases (we cannot test tick by tick test that far back) but the net total of these is £4.6k for system 2 and £10.6k for system 3 so roughly 20% of the gain, which is still acceptable. Of course there may be an effect on the scaling of positions and it may result in lower numbers overall but there is no way to work that out that unless we can tick by tick backtest that far back. Hence the fixed contract backtest will give us a better idea though.
- The system is supposed to only have entry trades on or after 8am UK/9am CET but I have found positions being opened at 7am so this needs to be looked at but there are not very many of these.
I will run the 4hr versions next and then onto the 1 fixed contract versions over the same TF
P.S.- Nicolas, is there an easy way to convert the the drag and drop PRT results into excel and convert the figures to number format. I used a value replace excel formula but it took some time…..
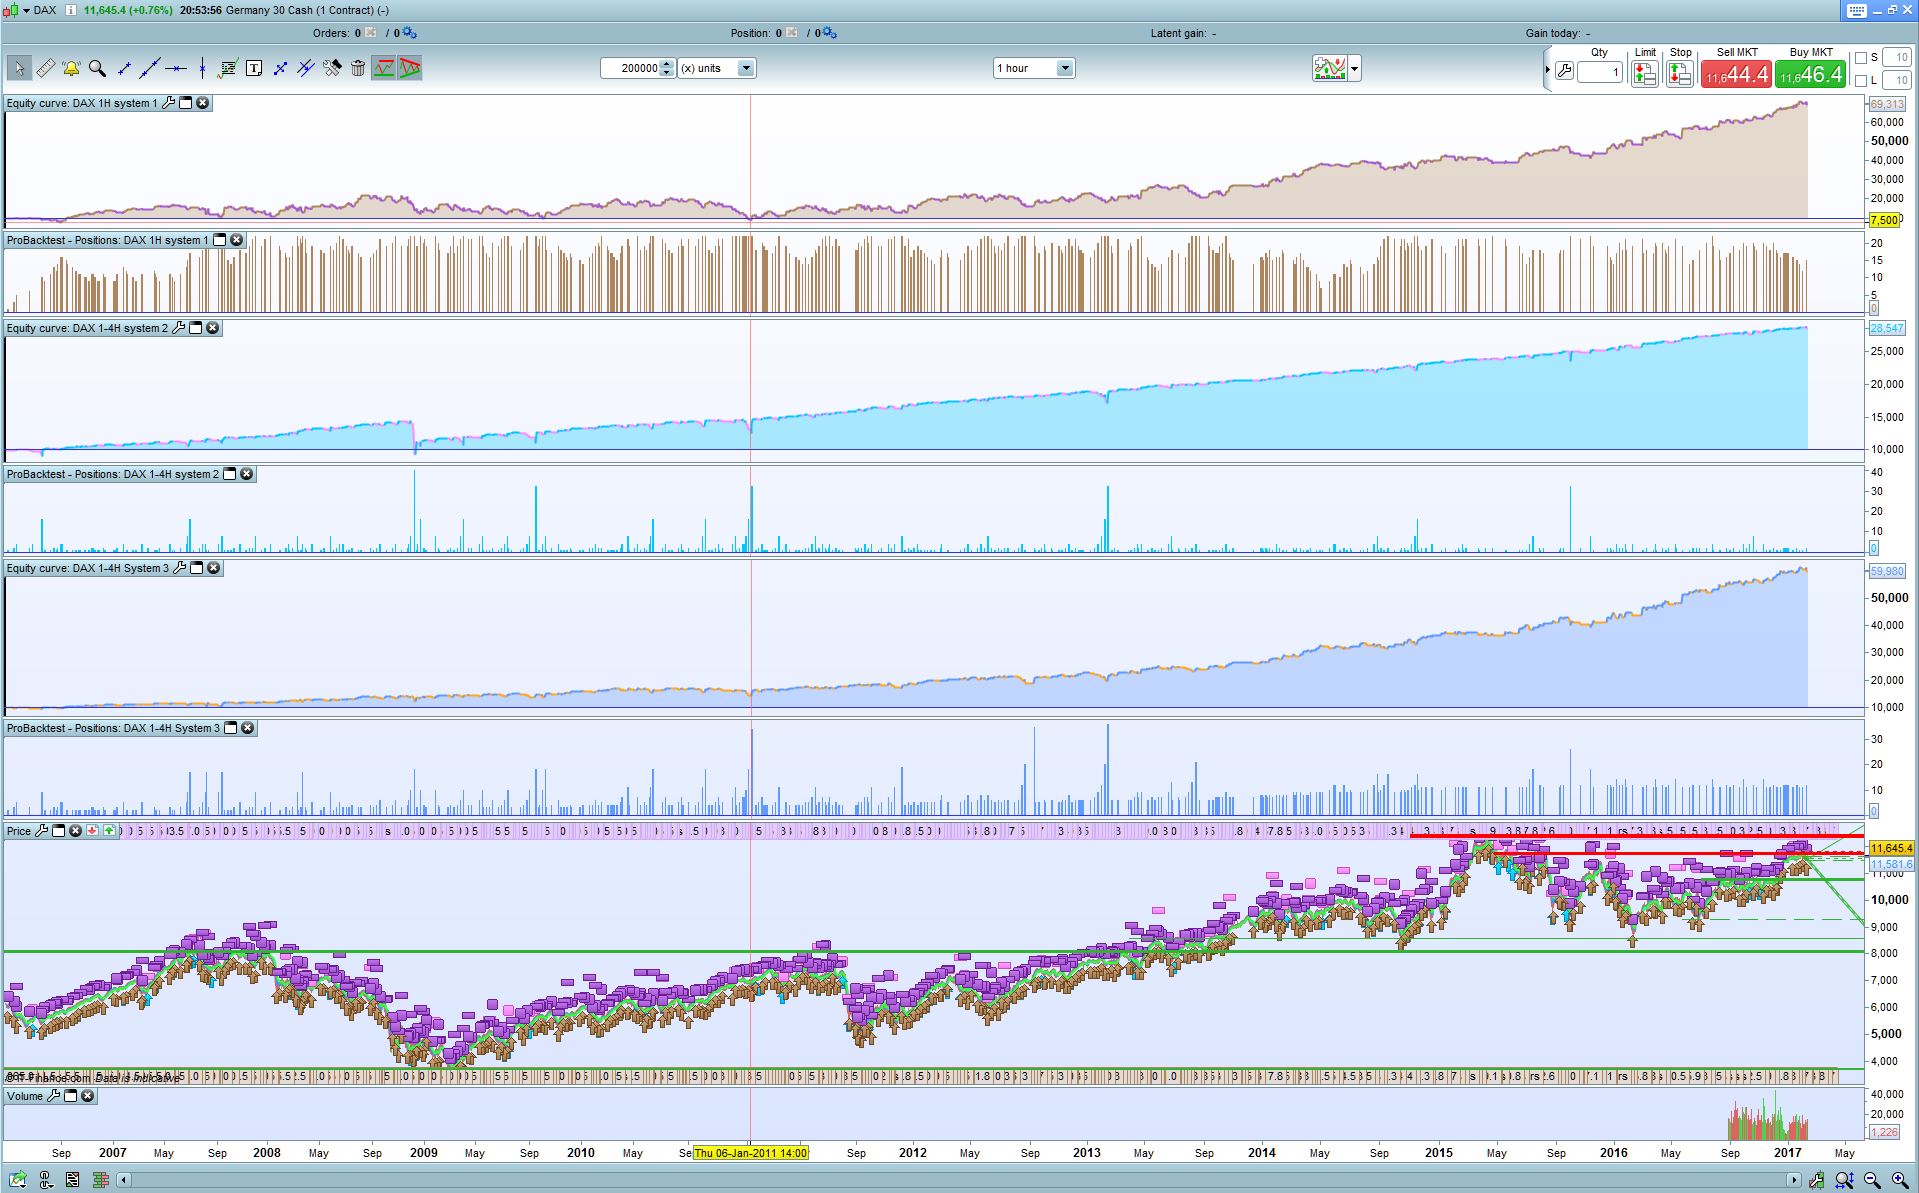
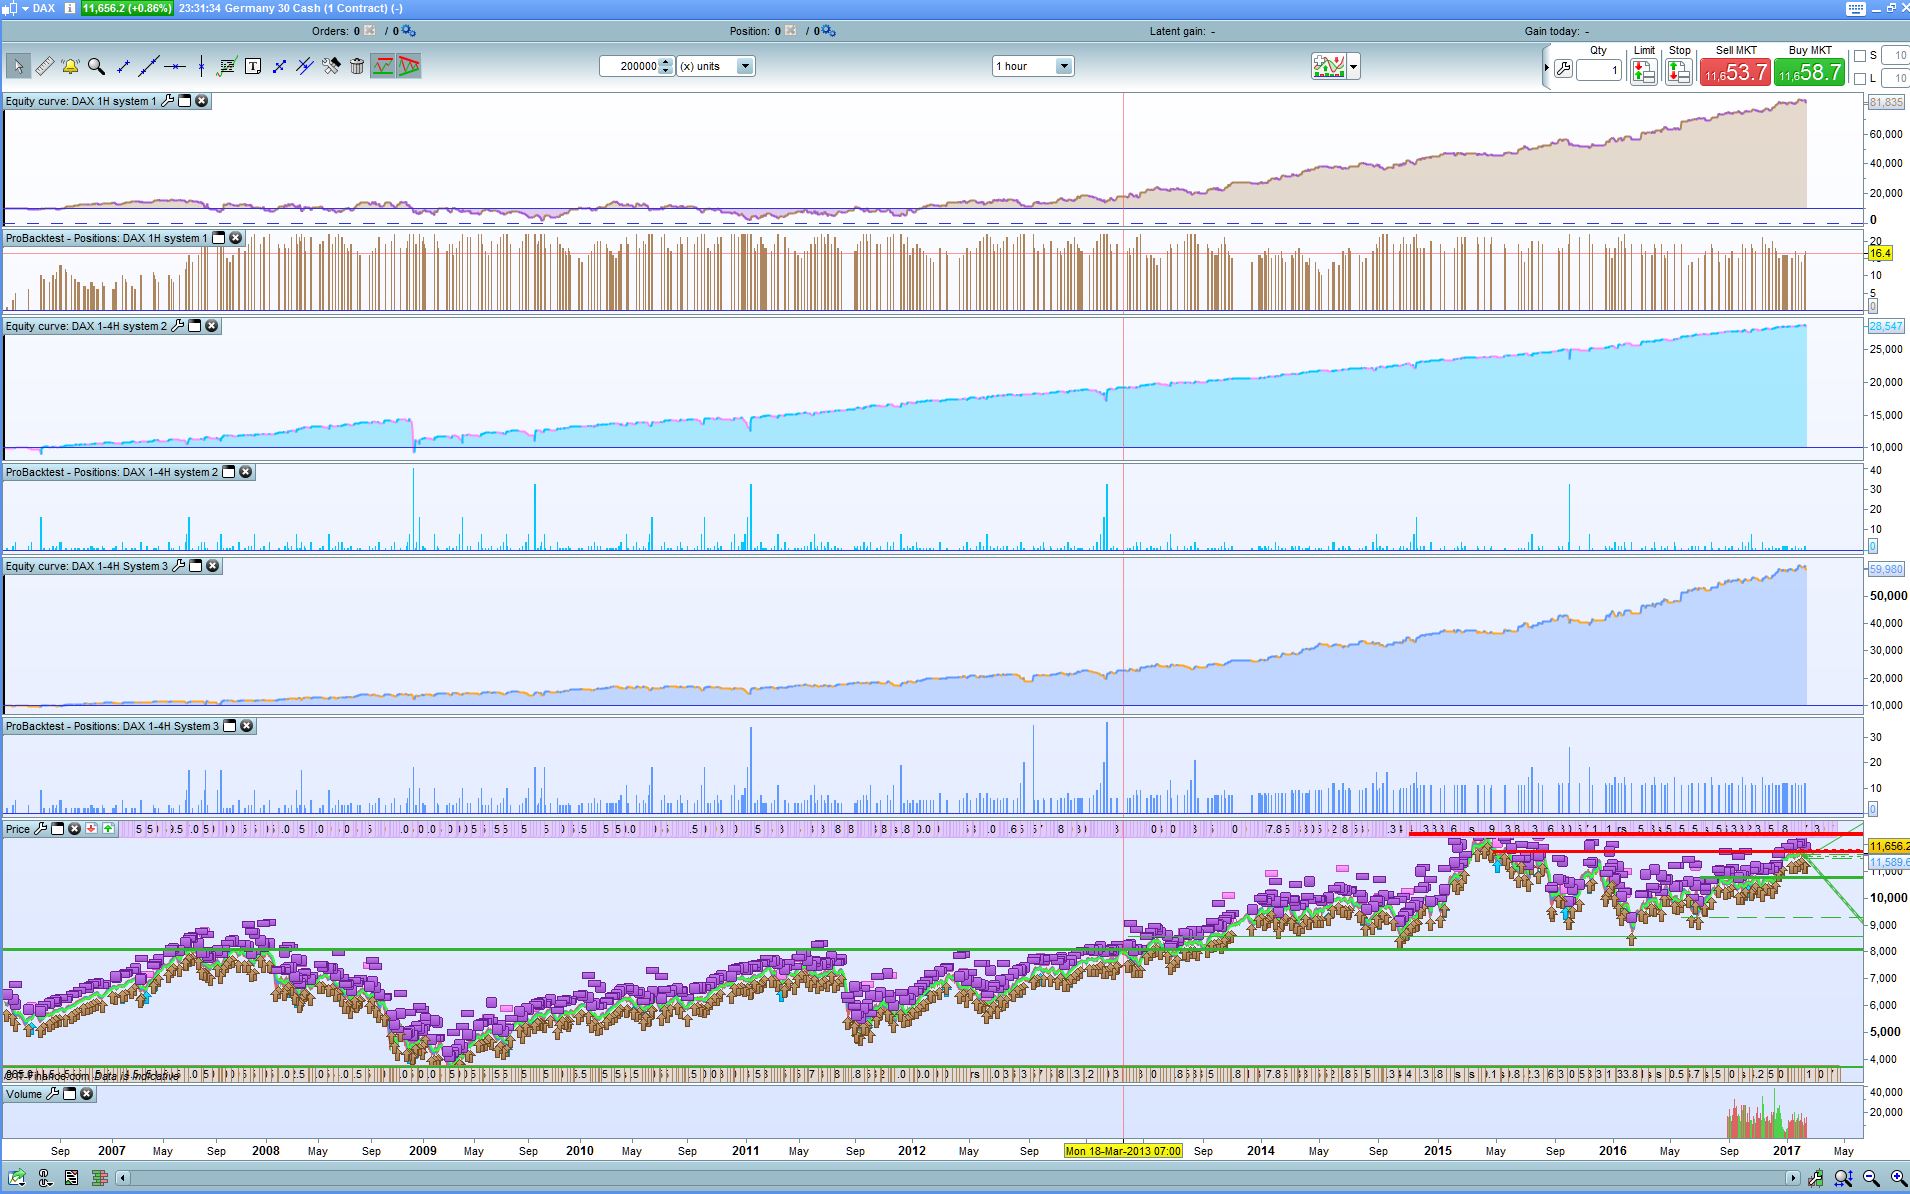
Thought I’d post all three side by side in 1hr TF so it’s easier to analyse for people. The fact that 2&3 still work across 2008-11 is positive. One thing to note, the system 1 results shown here should match those posted by Nicolas above but they don’t for some reason. Not sure why. His show fairly negative performance until 2013 whilst mine show a flat to slightly positive until then, resulting in a net difference of almost 14k in gains. Mystery for the moment.
I have shown the results broken down by quarter to demonstrate the volatility of gains and it’s quite interesting. System 1 has a high draw at the beginning of almost 60%. In my opinion system 3 edges it over system 2 due to a much lower draw, consistent and less volatile returns and the potential for higher gains due to scaling up of positions if the system continues to works well.
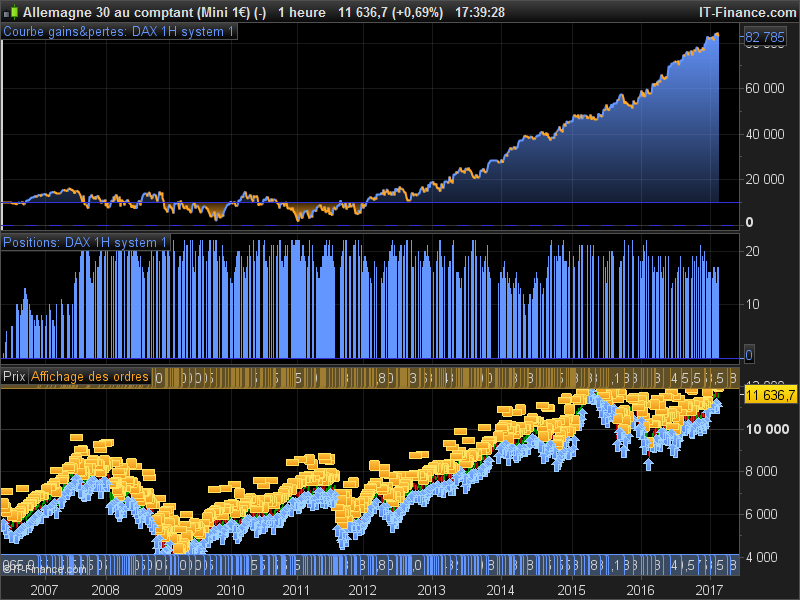
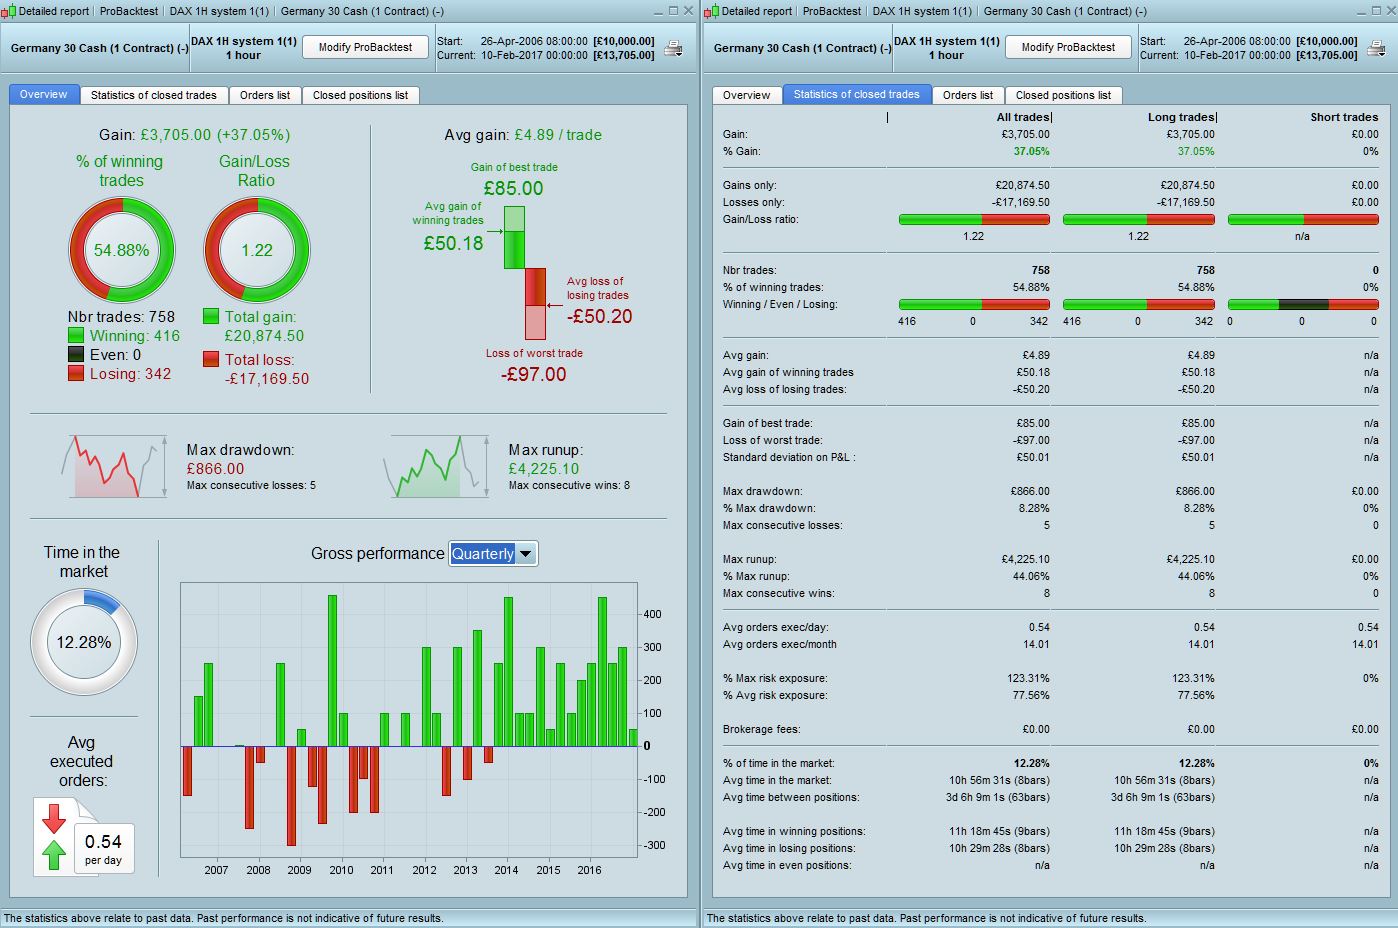
Found the issue – I did not adjust the code in system 1 for UK time. Sorry ! It’s too late in the day….. System 1 now matches Nicolas results above. Of note though, there is a huge draw of 89% because as Nicolas mentioned, that system only starts being consistently positive from mid 2012 onwards.
Raul – attached is the fixed 1 contract backtest of system 1 on 200,000 bars. I noticed that the exit day here is set to Thursday instead of Friday as in System 3. Not sure if that is deliberate by you or an oversight. The main conclusion is that it does not perform the 5yrs before 2012 after which period it is then fairly consistently positive in performance. The good thing though is that there are also no large draws in that 5yr period either (max 8%). Therefore, the scaling up positioning strategy seems to add some real value to both prior and post 2012 periods without affecting the overall draw% (as shown in the results of system 3 above) which is very encouraging.
Did not tested myself the 4h system – 2 , but seems like an averaging down strategy, easily recognisable with this kind of typical equity curve. Manel is right about scaling up that do not affect significantly the drawdown, which is an interesting fact.
@manel
Thanks for the help, because in system 1 appears that ed until Friday must be a mistake and may be the reason why it does not work well before 2012, if you can modify it to day 4 like the other 2 systems and try it I would appreciate.
hi guys
i m affraid of one thing .
the reason that the system does not work well before 2012 it is maybe because we choose the system withe best result since 2012 .
best results between 2012 and now , so i m affraid that we don t have good result for the future like before 2012 .
be aware of ultra optimisation .
what do you think ?
No problem Raul, will run the results and post back shortly.
@ Paris – yes you make a good point, we need to be aware of over optimisation. But in this case the indicator periods have not been optimised which is good. Raul can confirm what other parameters have been (day of the week, take profit etc). One thing I would mention is that by using a fixed points stop/limit you run into issues of index values contributing to skewed results i.e 50 points on the Dax when the index is 7000 is harder to achieve in % terms than when the Dax is sitting at almost 12,000 points like it is today when +/- 50 points happens almost daily. This could also be one of the reasons that the strategy does not work as well in prior years – not definite though, just a thought.
@Paris, this is what we are thinking of at the first glance you are right, but like manel said, I do not see any kind of optimising in the code: indicator periods are the default one, SL and TP are round numbers. I have the same conclusion as manel, the daily range of DAX has a lot increased since the last economic crisis, that should be one of the reason the strategy perform better since 2012.
This is what I would do with system 3 -4h.
DEFPARAM CumulateOrders = false
once ordersize=1

// Conditions

MA1 = Average [3]
MA2 = Average [4]

c1 = Ma1>MA2

t1 = time >= 090000
t2 = time = 173000


d1 =dayofweek = 2
d2 = dayofweek = 5

if ordersize>0 then
ordersize=1
endif

n=0

indicator13 = MACD[12,26,9](close)
c13 = (indicator13 < 30)

indicator11 = ExponentialAverage[20](close)
c11 = (close >= indicator11)

indicator1 = MACDline[12,26,9](close)
indicator2 = ExponentialAverage[12](indicator1)
c12 = (indicator1 > indicator2)

If   d1 And t1 and c1 and c11 and c12 and c13 THEN
if not onmarket then
IF c1 THEN
IF PositionPerf(1) < 0 THEN
OrderSize = OrderSize*2
if ordersize<1 then
ordersize=1
ENDIF
ELSIF PositionPerf(1) > 0 THEN
OrderSize = 1
if ordersize<1 then
ordersize=1
ENDIF
endif
buy ordersize+n Contract At Market
Endif


If d2 and t2 then
sell at market
endif
endif
endif

Set Stop Ploss 80 // from Trade
Set Target PProfit 100 // from Trade
Hi! It may be due to the fact that these years the market is more volatile. But anyway the system 3 I see that works very well over these 10 years.
@Joachim Nilsson great job !! Can also be used for the Swiss index.