Thanks very much for your help Roberto.
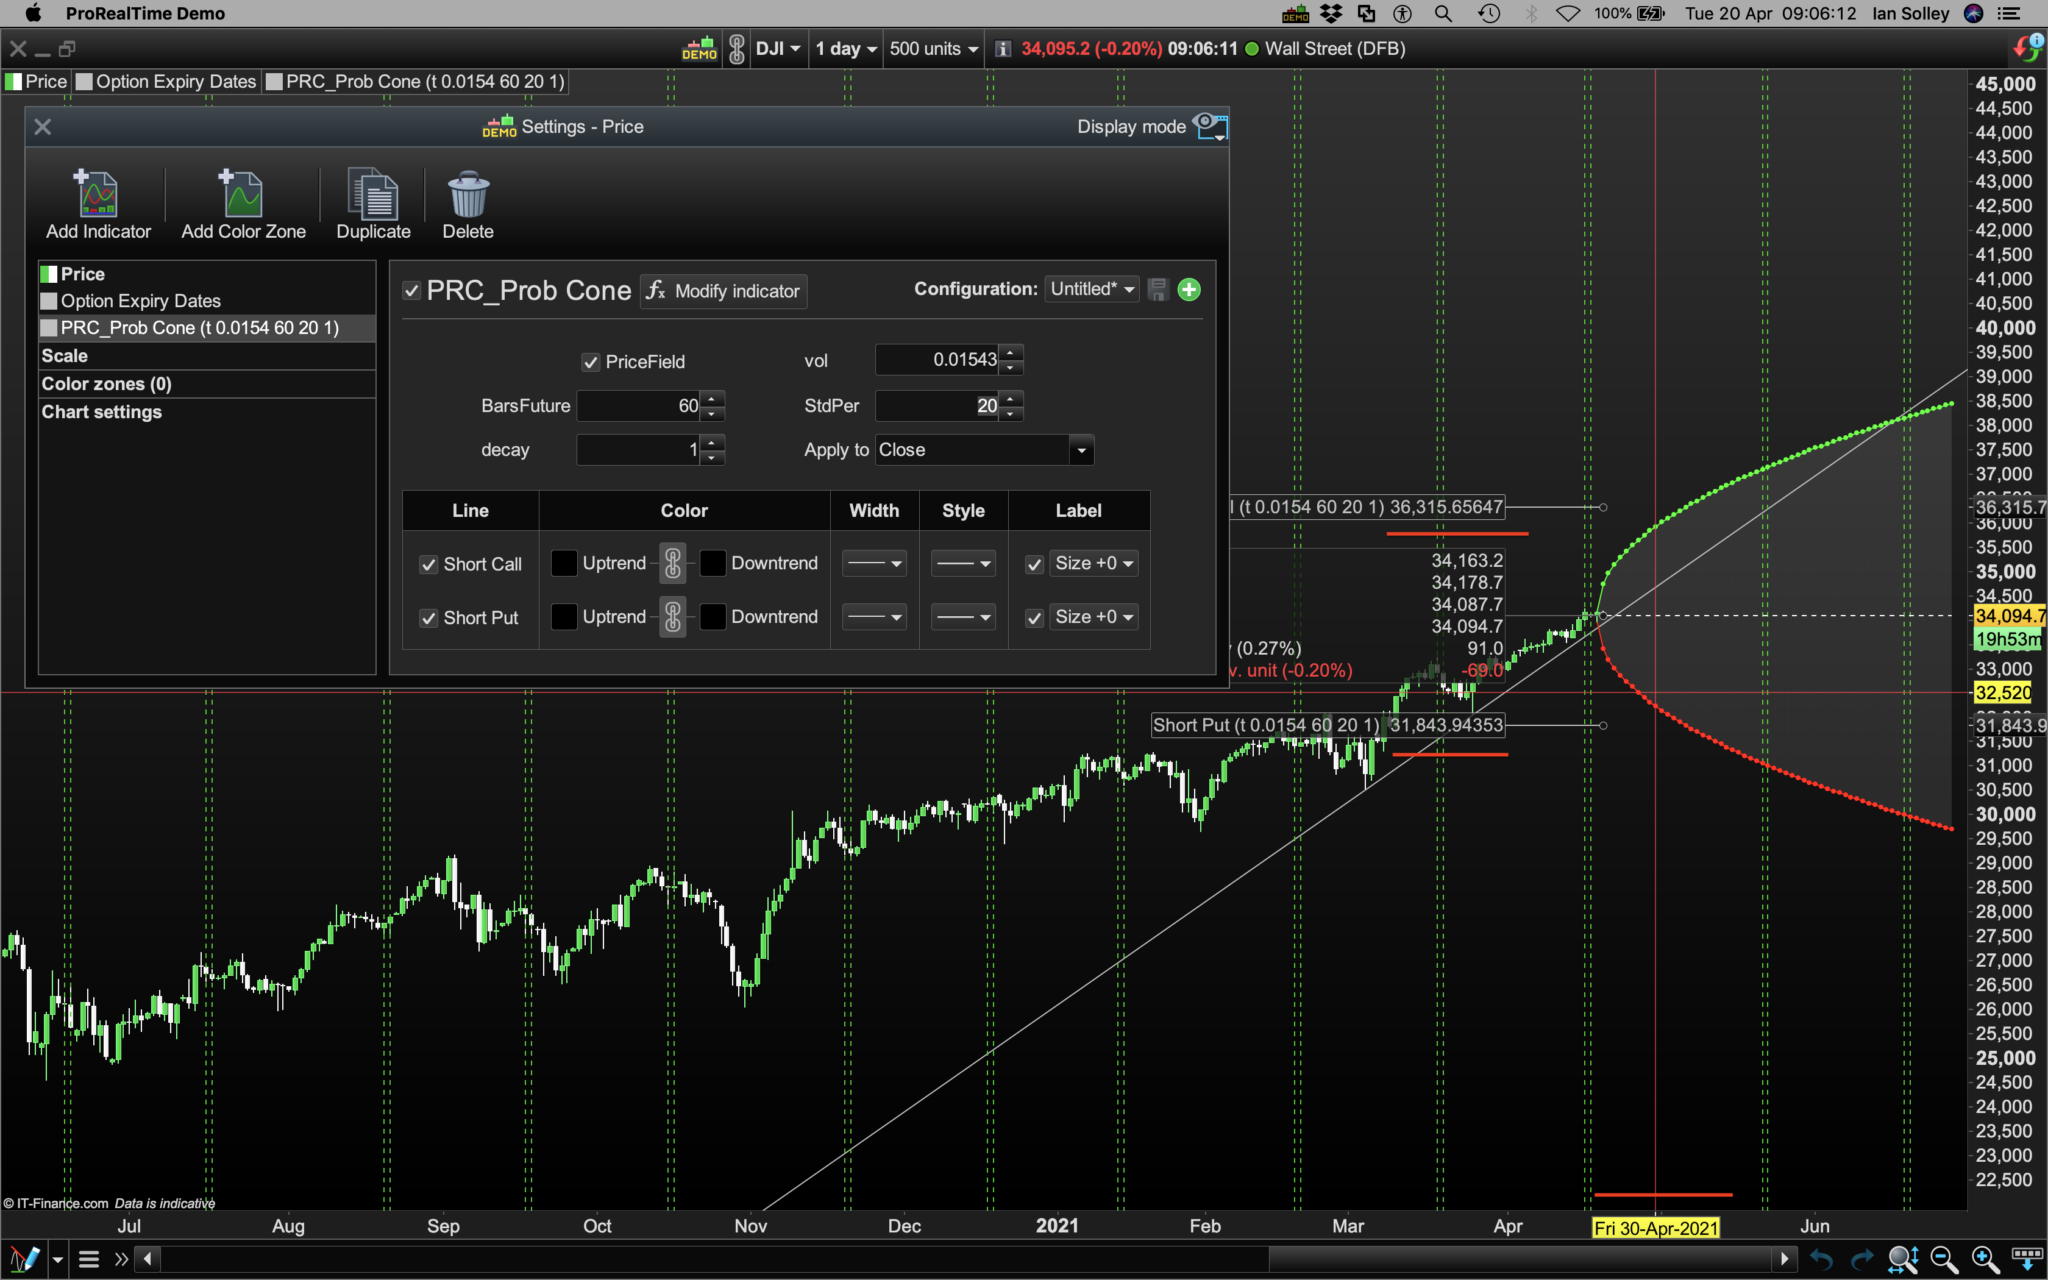
This is the completed Indicator and I’ve added the Probability Cone Indicator code too in the hope that perhaps we could add/code them together in one indicator and then add this to the library
@Robertogozzi,
@Nicolas?
//Option Stop Trading Dates and Expiry Dates 2020/2021
//https://www.marketwatch.com/optionscenter/calendar
//https://www.optionseducation.Org/referencelibrary/expiration-calendar

If Date = 20200117  Or Date = 20200221  Or Date = 20200320  Or Date = 20200417  Or Date = 20200515  Or Date = 20200619  Or Date = 20200717  Or Date = 20200821  Or Date = 20200918  Or Date = 20201016  Or Date = 20201120  Or Date = 20201218  Or Date = 20210115  Or Date = 20210219  Or Date = 20210319  Or Date = 20210416  Or Date = 20210521  Or Date = 20210618  Or Date = 20210716  Or Date = 20210820  Or Date = 20210917  Or Date = 20211015  Or Date = 20211119  Or Date = 20211217  Then
DrawvLine(BarIndex[+0])Coloured (0,200,0)style (DottedLine)
EndIf

// Plot up to a Date in the Future (1 Year)
DrawvLine(DateToBarIndex(20210416))Coloured (0,200,0)style (DottedLine)
DrawvLine(DateToBarIndex(20210417))Coloured (0,200,0)style (DottedLine)
DrawvLine(DateToBarIndex(20210521))Coloured (0,200,0)style (DottedLine)
DrawvLine(DateToBarIndex(20210522))Coloured (0,200,0)style (DottedLine)
DrawvLine(DateToBarIndex(20210618))Coloured (0,200,0)style (DottedLine)
DrawvLine(DateToBarIndex(20210619))Coloured (0,200,0)style (DottedLine)
DrawvLine(DateToBarIndex(20210716))Coloured (0,200,0)style (DottedLine)
DrawvLine(DateToBarIndex(20210717))Coloured (0,200,0)style (DottedLine)
DrawvLine(DateToBarIndex(20210820))Coloured (0,200,0)style (DottedLine)
DrawvLine(DateToBarIndex(20210821))Coloured (0,200,0)style (DottedLine)
DrawvLine(DateToBarIndex(20210917))Coloured (0,200,0)style (DottedLine)
DrawvLine(DateToBarIndex(20210918))Coloured (0,200,0)style (DottedLine)
DrawvLine(DateToBarIndex(20211015))Coloured (0,200,0)style (DottedLine)
DrawvLine(DateToBarIndex(20211016))Coloured (0,200,0)style (DottedLine)
DrawvLine(DateToBarIndex(20211119))Coloured (0,200,0)style (DottedLine)
DrawvLine(DateToBarIndex(20211120))Coloured (0,200,0)style (DottedLine)
DrawvLine(DateToBarIndex(20211217))Coloured (0,200,0)style (DottedLine)
DrawvLine(DateToBarIndex(20211218))Coloured (0,200,0)style (DottedLine)
DrawvLine(DateToBarIndex(20220121))Coloured (0,200,0)style (DottedLine)
DrawvLine(DateToBarIndex(20220122))Coloured (0,200,0)style (DottedLine)
DrawvLine(DateToBarIndex(20220218))Coloured (0,200,0)style (DottedLine)
DrawvLine(DateToBarIndex(20220219))Coloured (0,200,0)style (DottedLine)
DrawvLine(DateToBarIndex(20220318))Coloured (0,200,0)style (DottedLine)
DrawvLine(DateToBarIndex(20220319))Coloured (0,200,0)style (DottedLine)
//

Return
// https://www.prorealcode.com/topic/array-variables-availability-in-prorealtime/
// (please do not remove the link above for future reference)
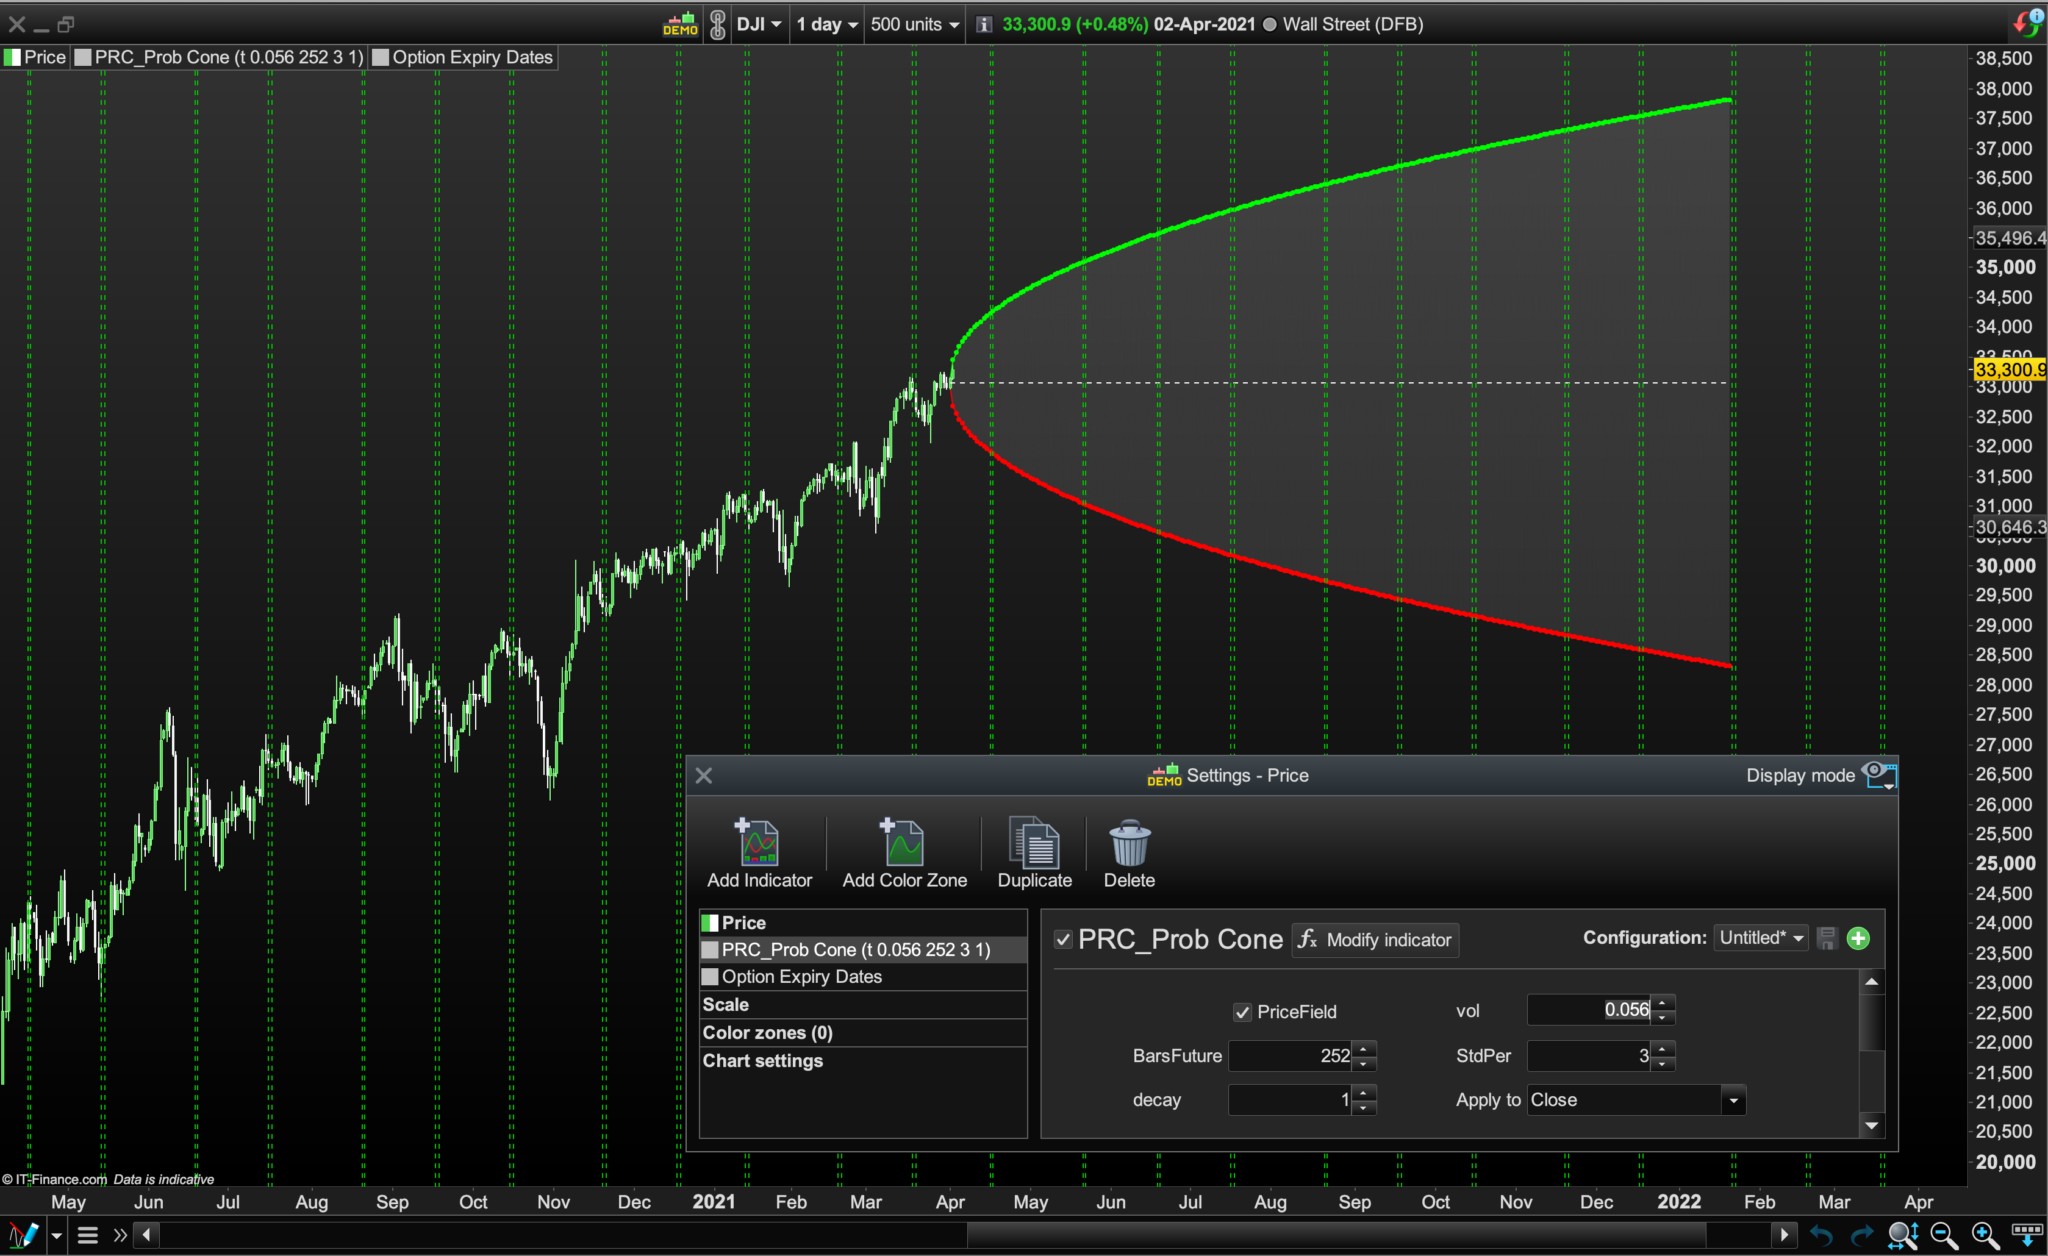
// Example #2: probability cone
defparam drawonlastbaronly=true
// --- settings
//PriceField = 1 //1=customclose ; 0=high/low
//vol = 0.025 //Assumed Volatility (ideally based on volTyp)
//BarsFuture = 20 //No. of days ahead
//stdPer = 2 //Std. Dev. quantity
//decay = 12 //decay the cone at the previous X bar
// --- end of settings
Price = customclose
hh=undefined
ll=undefined
if(islastbarupdate) then
for i = 0 to BarsFuture do
//cone calculation
StdDev = StdPer * Price * Vol * sqrt( i / 365 ) //3.6*
if( PriceField ) then
$u[i] = high[decay] + stdDev
$d[i] = low[decay] - stdDev
else
$u[i] = Price[decay] + stdDev
$d[i] = Price[decay] - stdDev
endif
if i>0 then
//upper cone
drawsegment(barindex[decay]+i,$u[i],barindex[decay]+i-1,$u[i-1]) coloured(0,255,0)
drawpoint(barindex[decay]+i,$u[i],1) coloured(0,255,0)
//lower cone
drawsegment(barindex[decay]+i,$d[i],barindex[decay]+i-1,$d[i-1]) coloured(255,0,0)
drawpoint(barindex[decay]+i,$d[i],1) coloured(255,0,0)
//filling the zone
drawtriangle(barindex[decay]+i,$u[i],barindex[decay]+i-1,$u[i-1],barindex[decay]+i,$d[i]) coloured(150,150,150,50) bordercolor(150,150,150,0)
drawtriangle(barindex[decay]+i-1,$d[i-1],barindex[decay]+i,$d[i],barindex[decay]+i-1,$u[i-1]) coloured(150,150,150,50) bordercolor(150,150,150,0)
endif
next
//plot the middle line
drawsegment(barindex[decay],($u[0]+$d[0])/2,barindex[decay]+BarsFuture,($u[0]+$d[0])/2) style(dottedline)
//plot the highest and lowest boundaries of the cone
hh=(arraymax($u)+arraymin($u))/2
ll=(arraymax($d)+arraymin($d))/2
endif
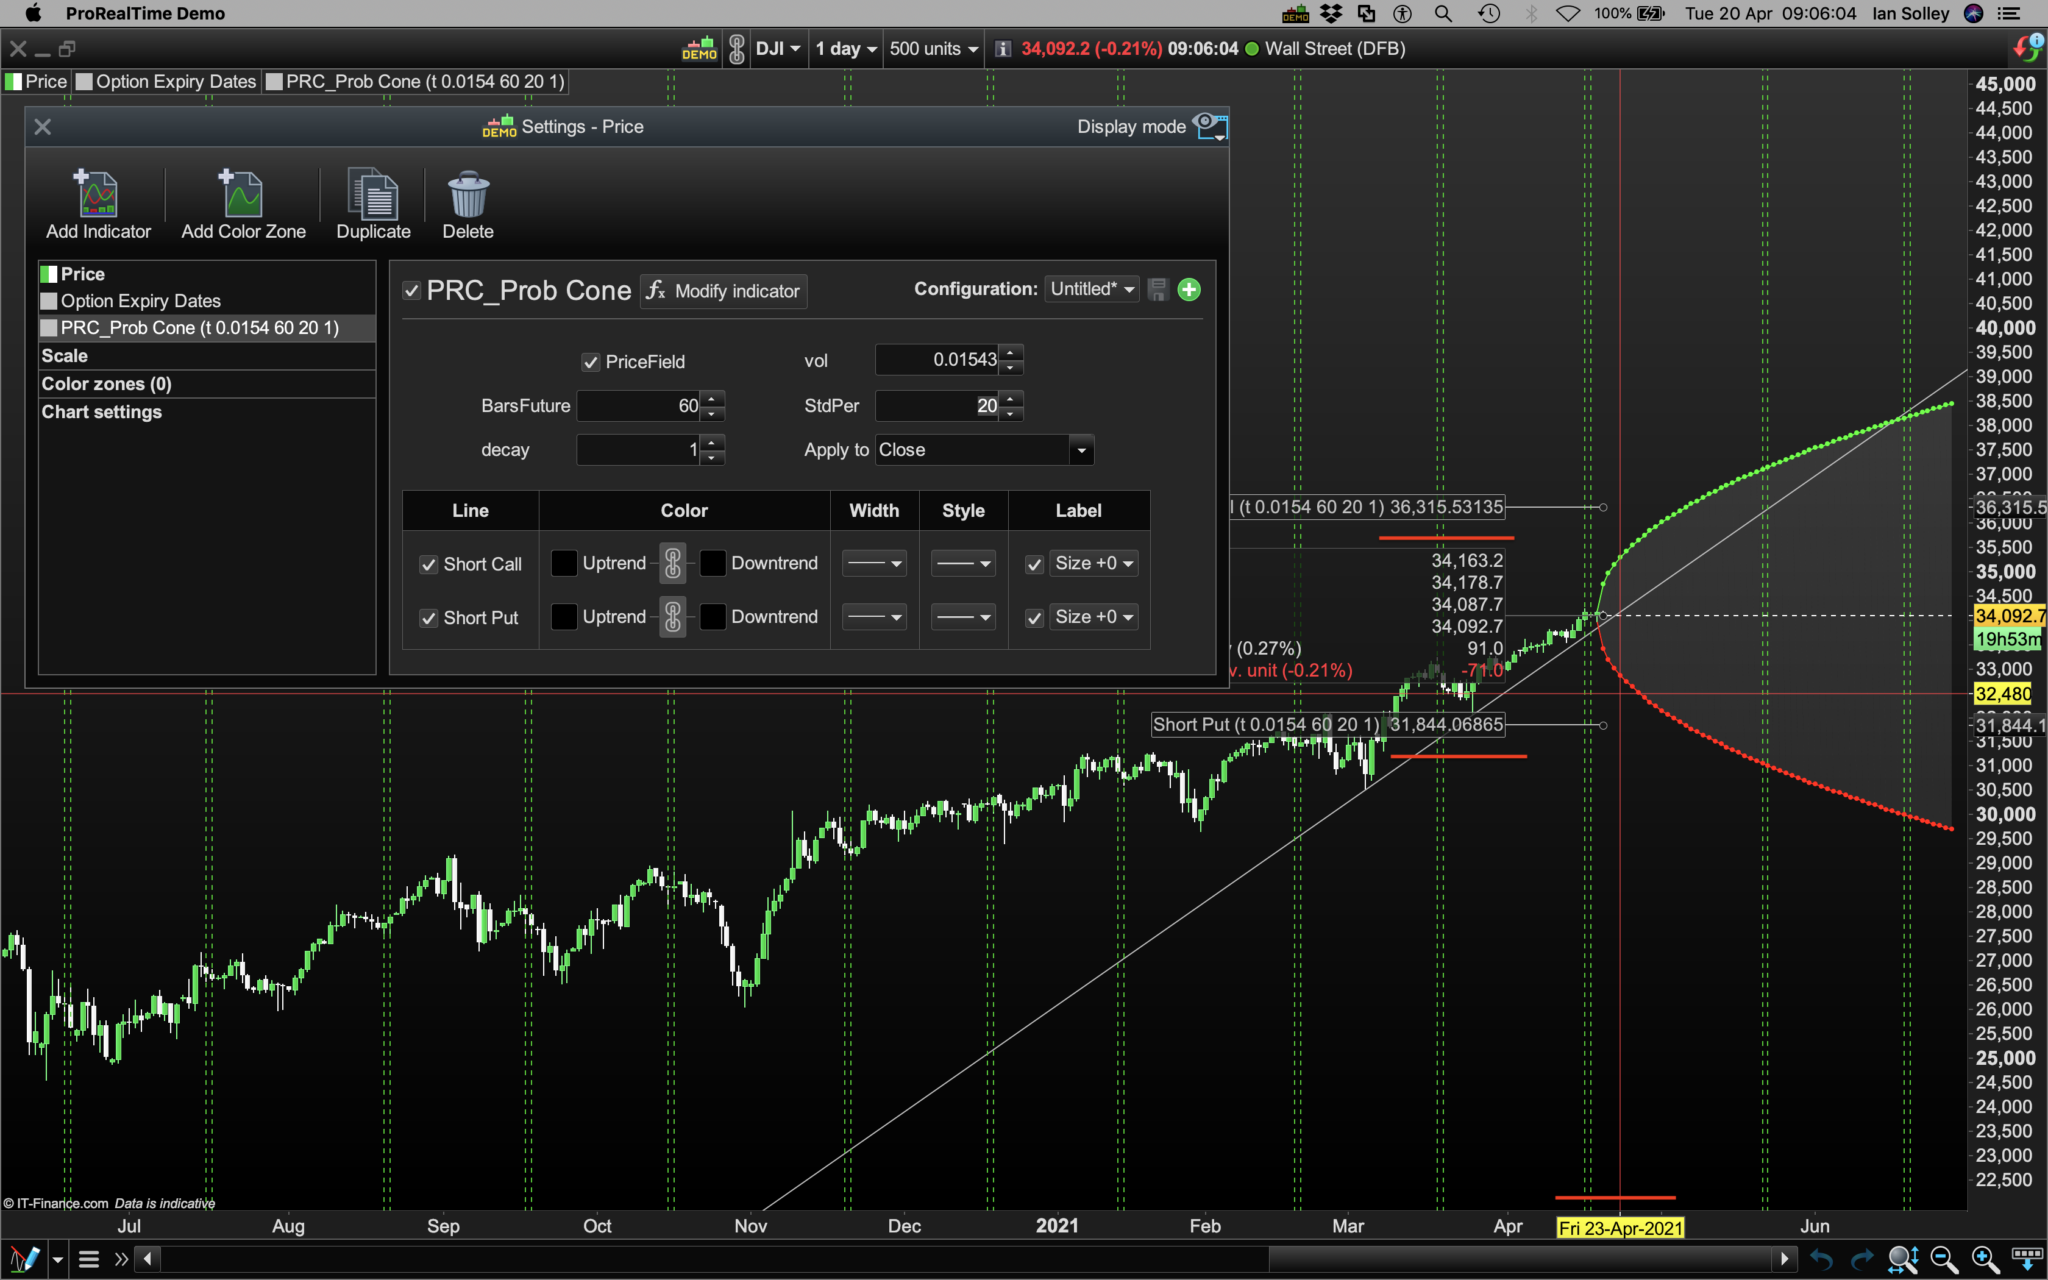
return hh as "Short Call", ll as "Short Put"
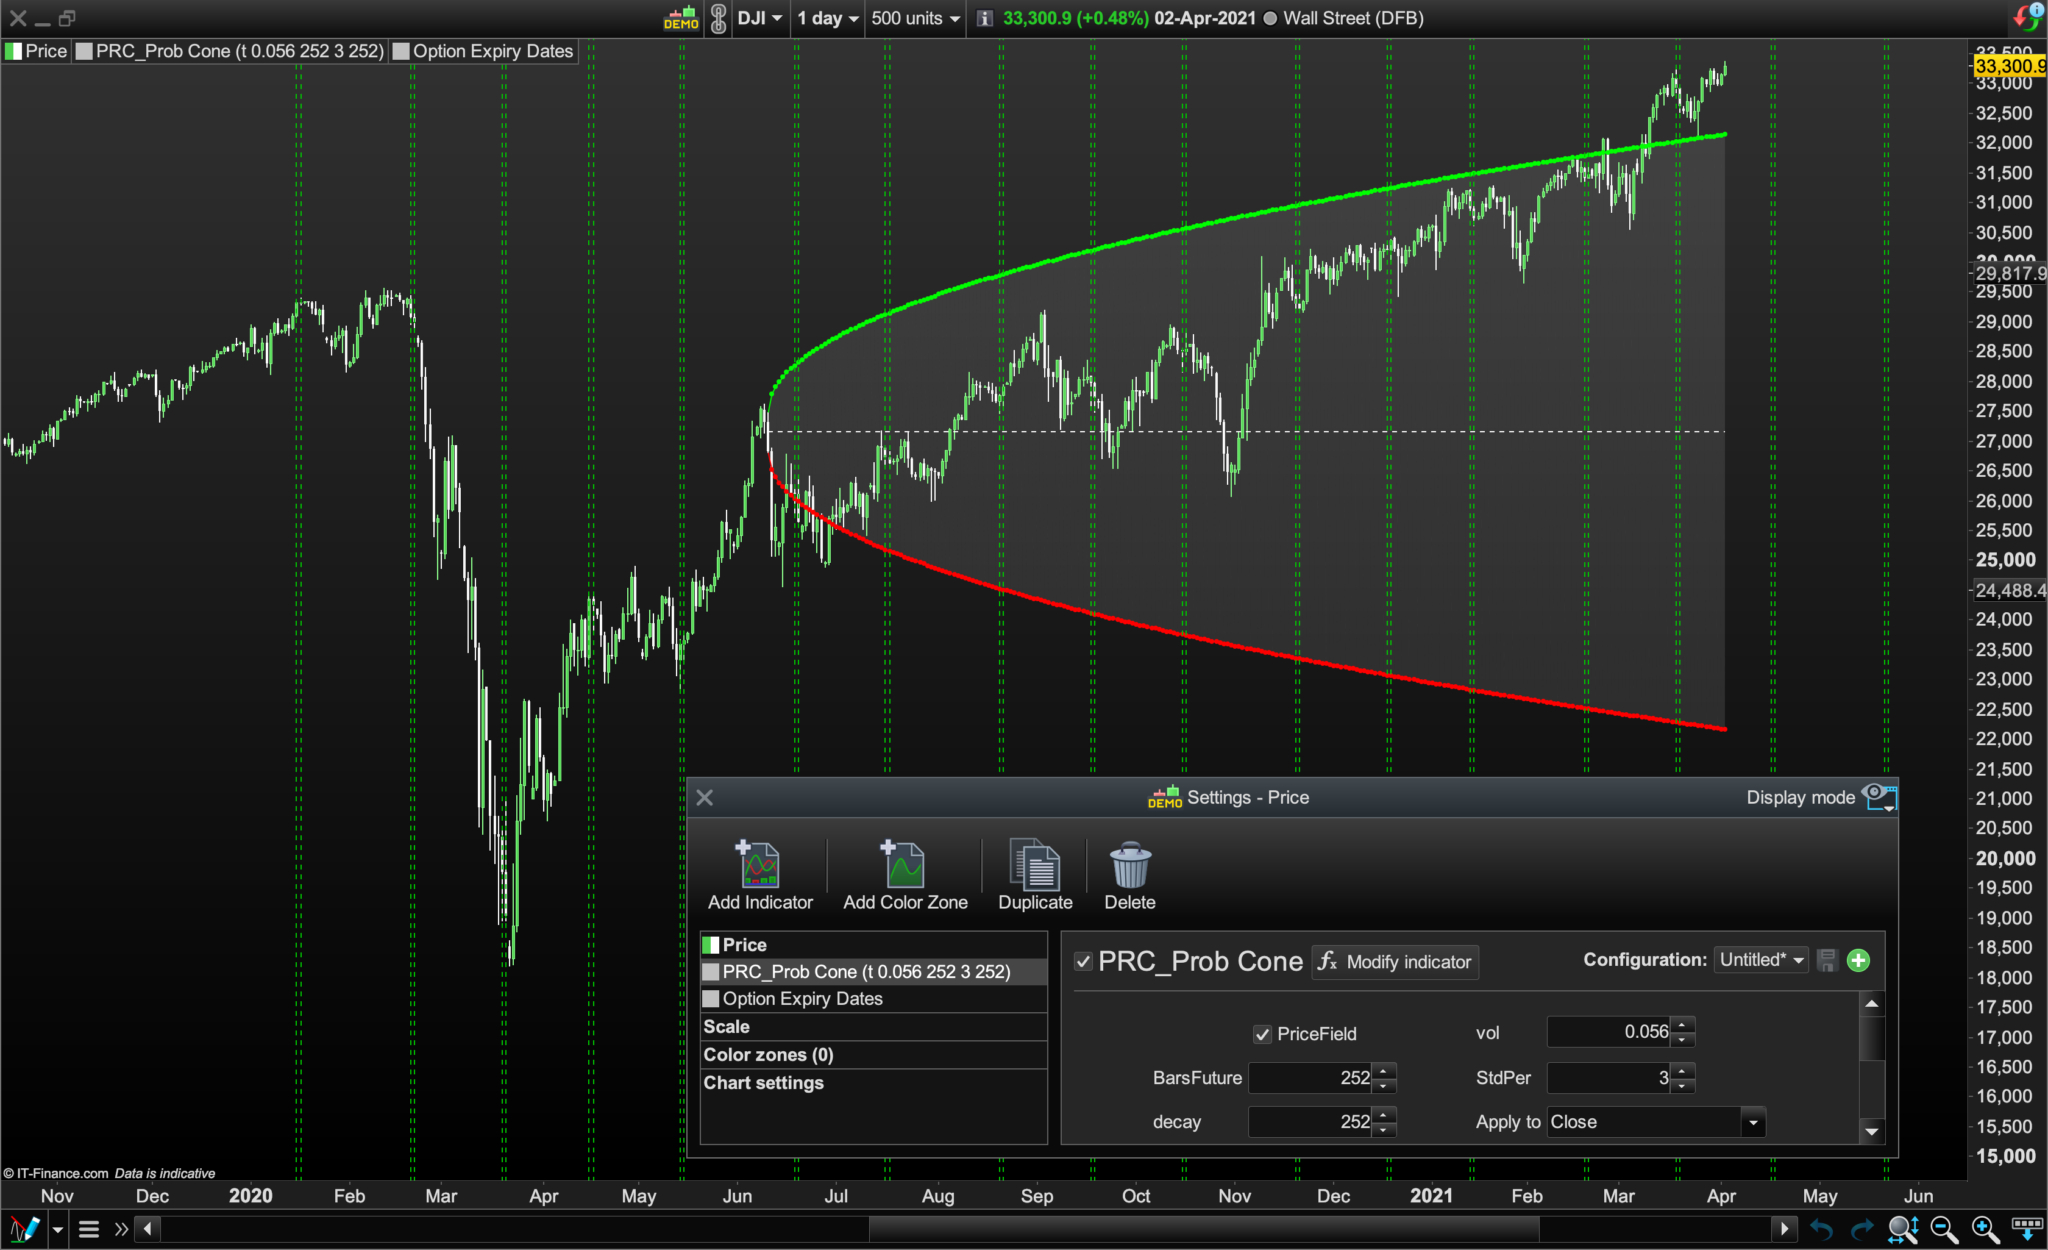
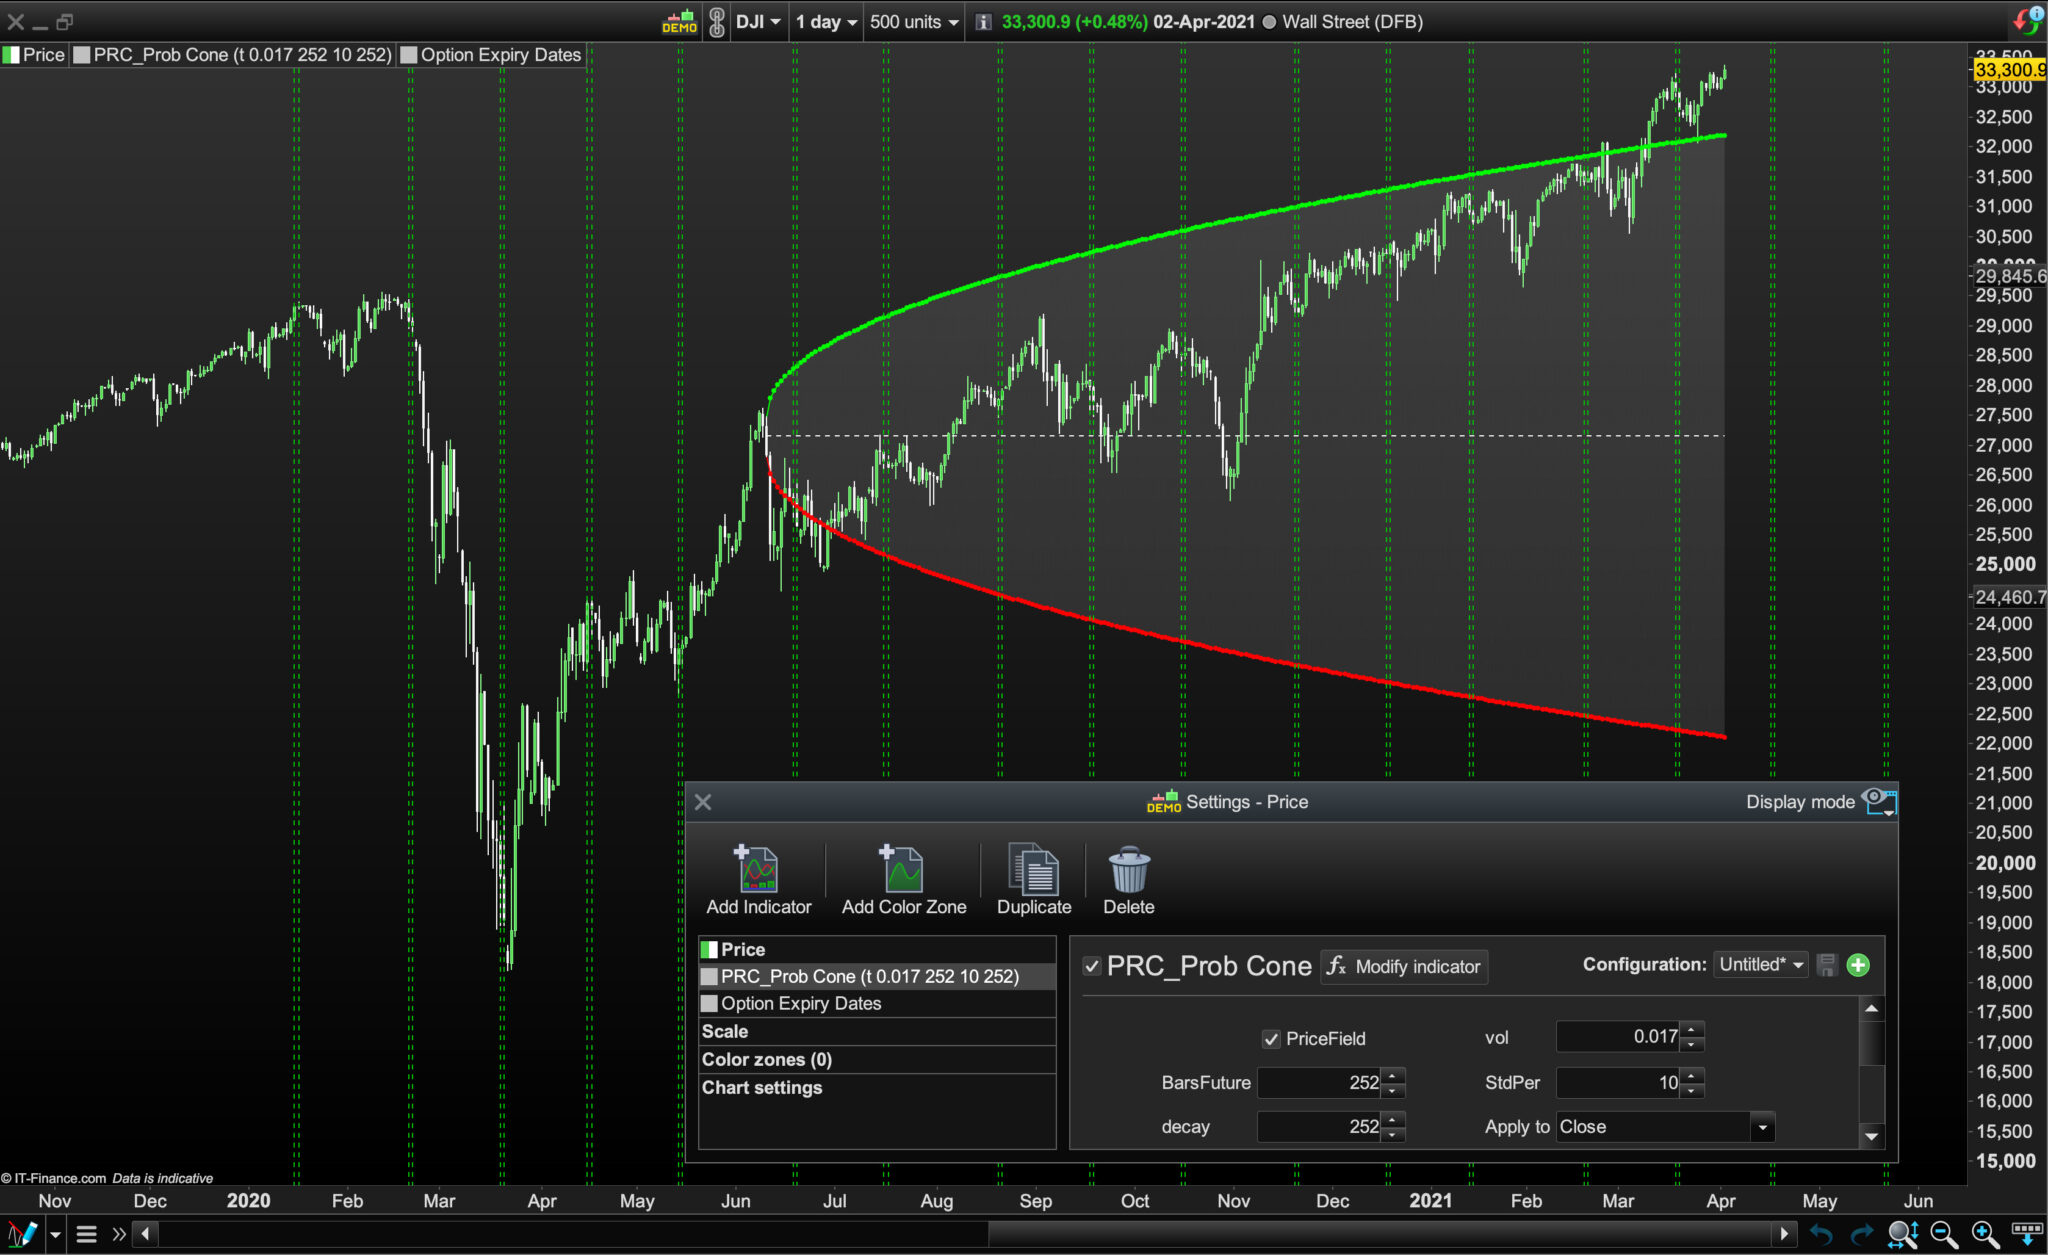
Volatility % Setting for the Probability Cone:
For the Probability Cone indicator’s standard deviation volatility setting bear in mind that although the 1985-2020 annualised standard deviation (SD) for the Dow Jones was 17.61%, the DIJA VIX high / low SD for the last 12 months ranged between approximately 17% and 56%:
https://fred.stlouisfed.org/series/VXDCLS
S&P VIX Explained:
https://www.spindices.com/vix-intro/
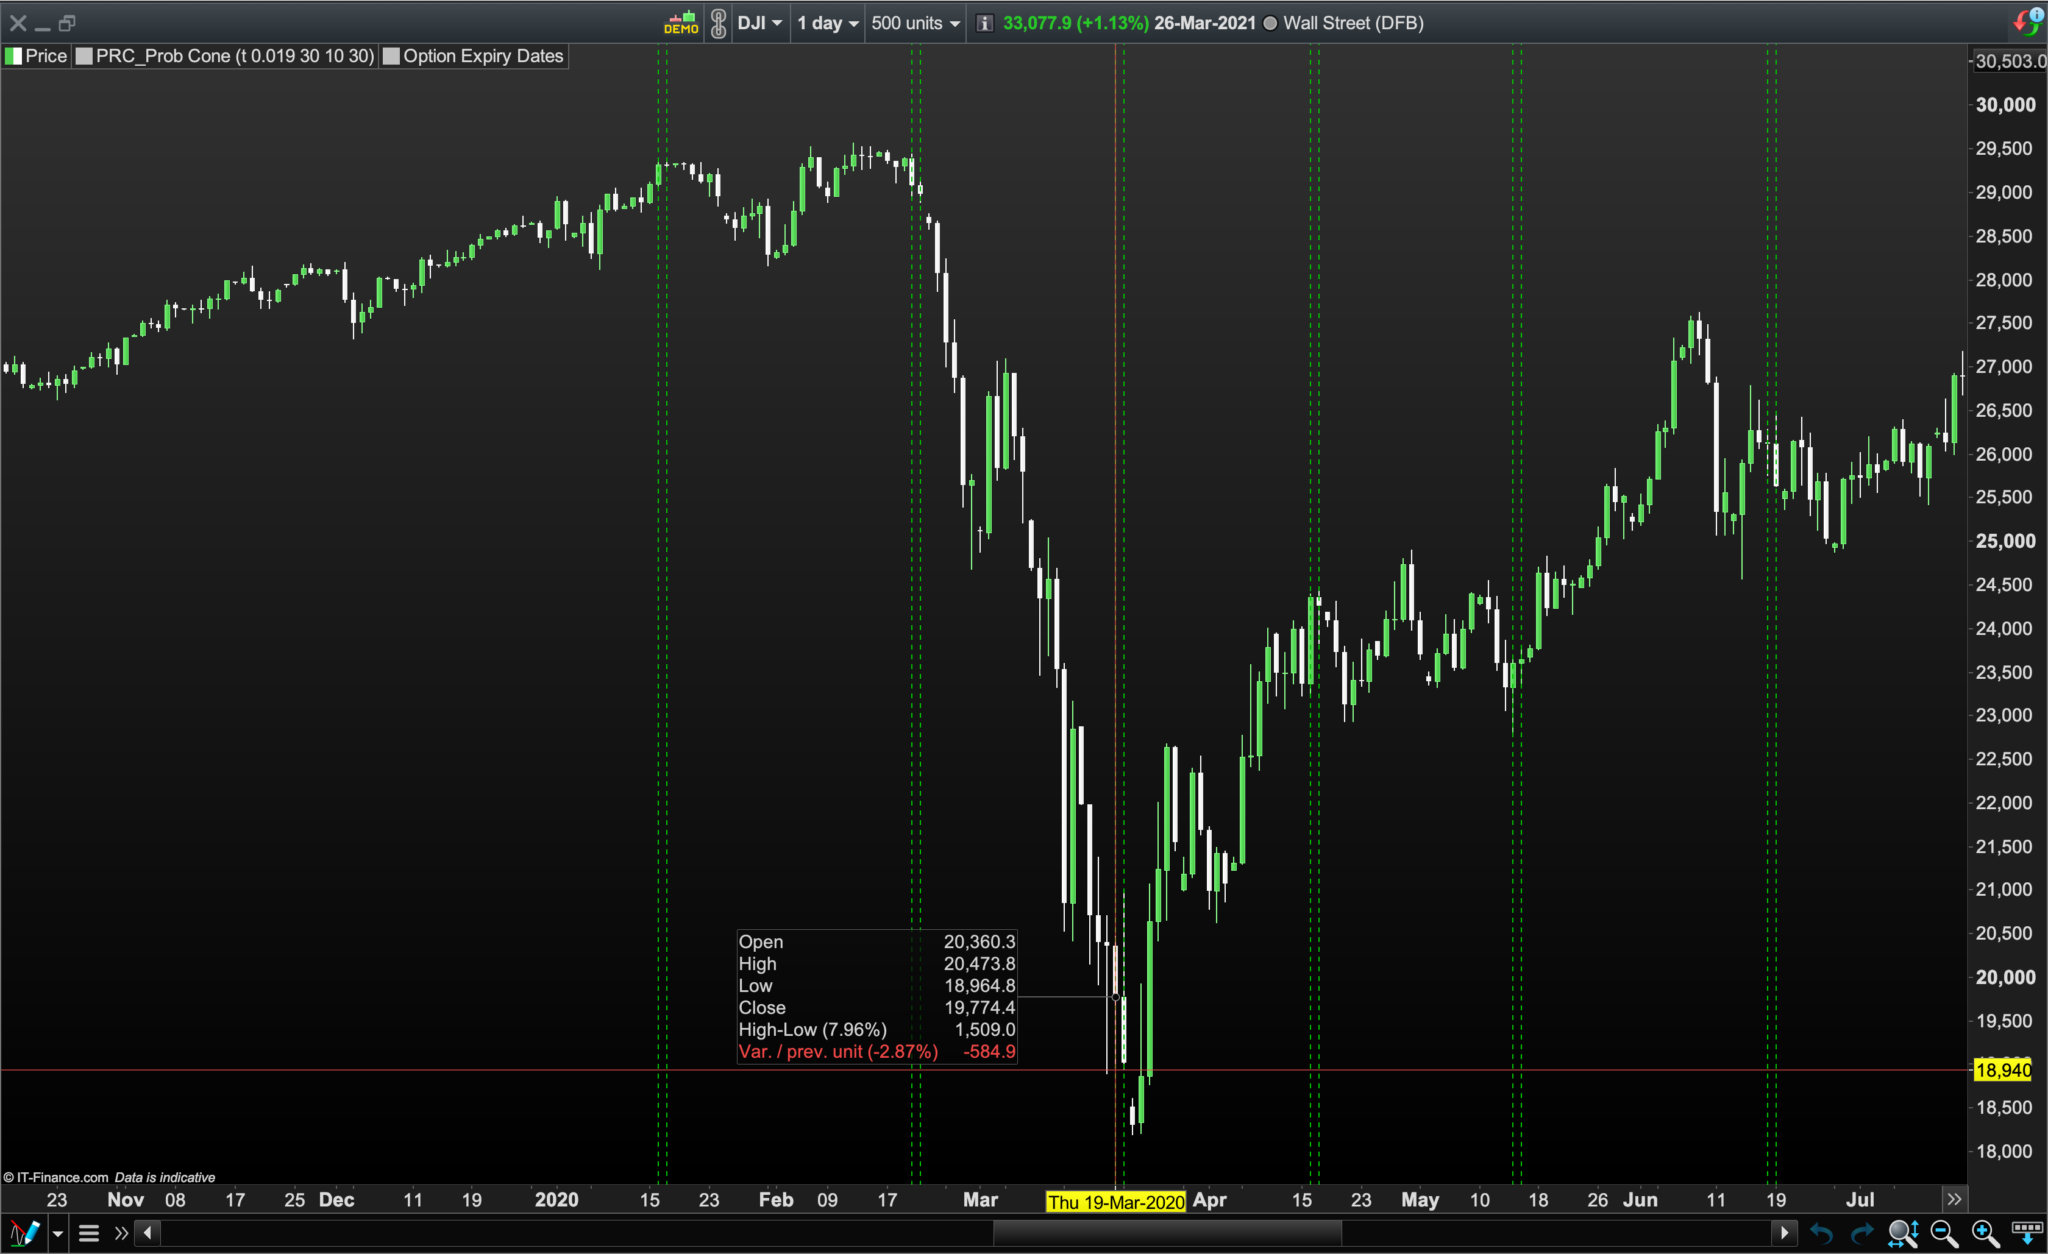
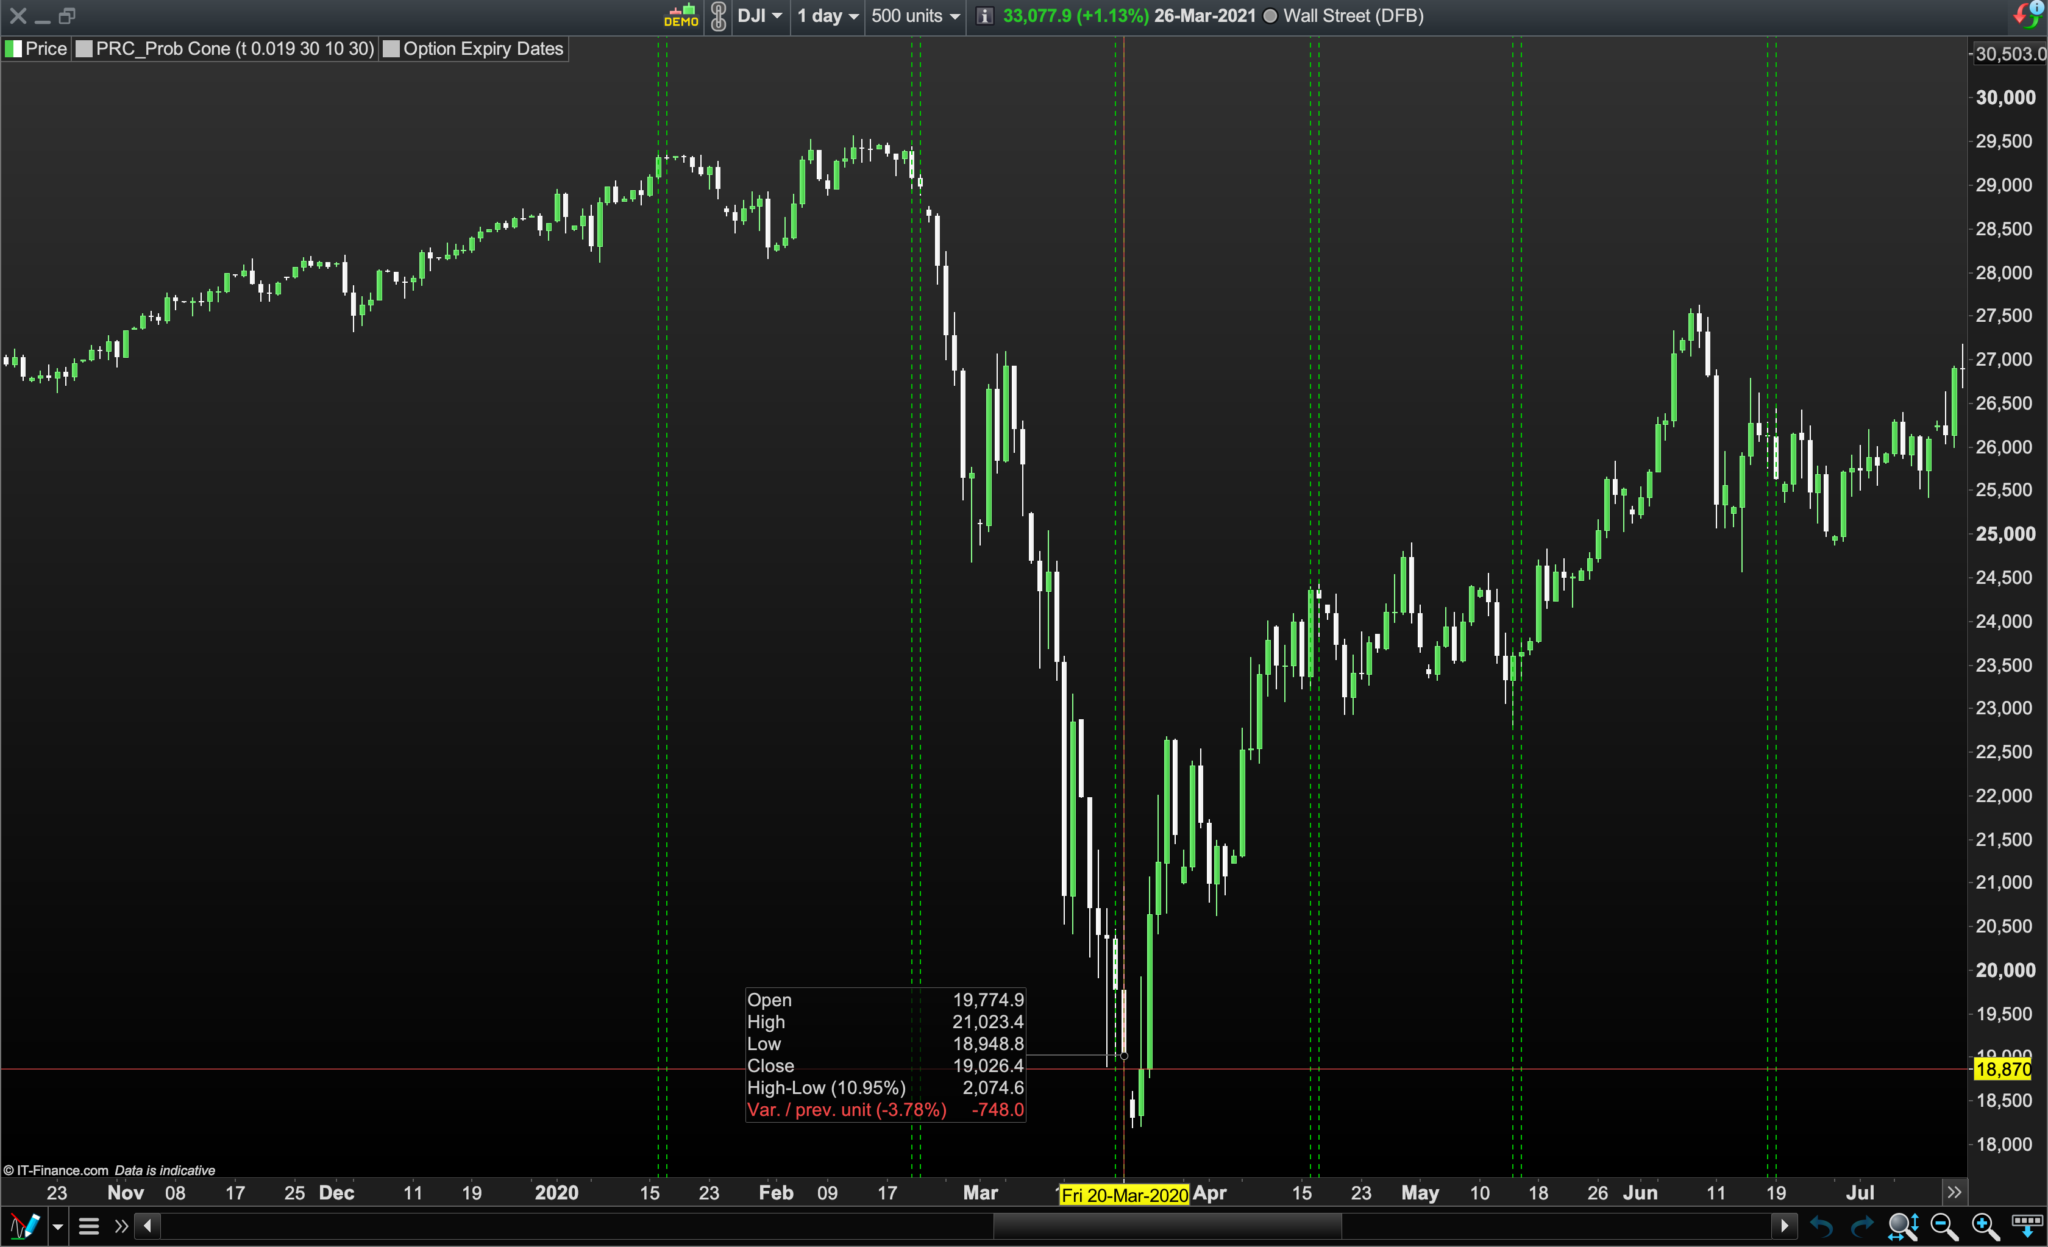
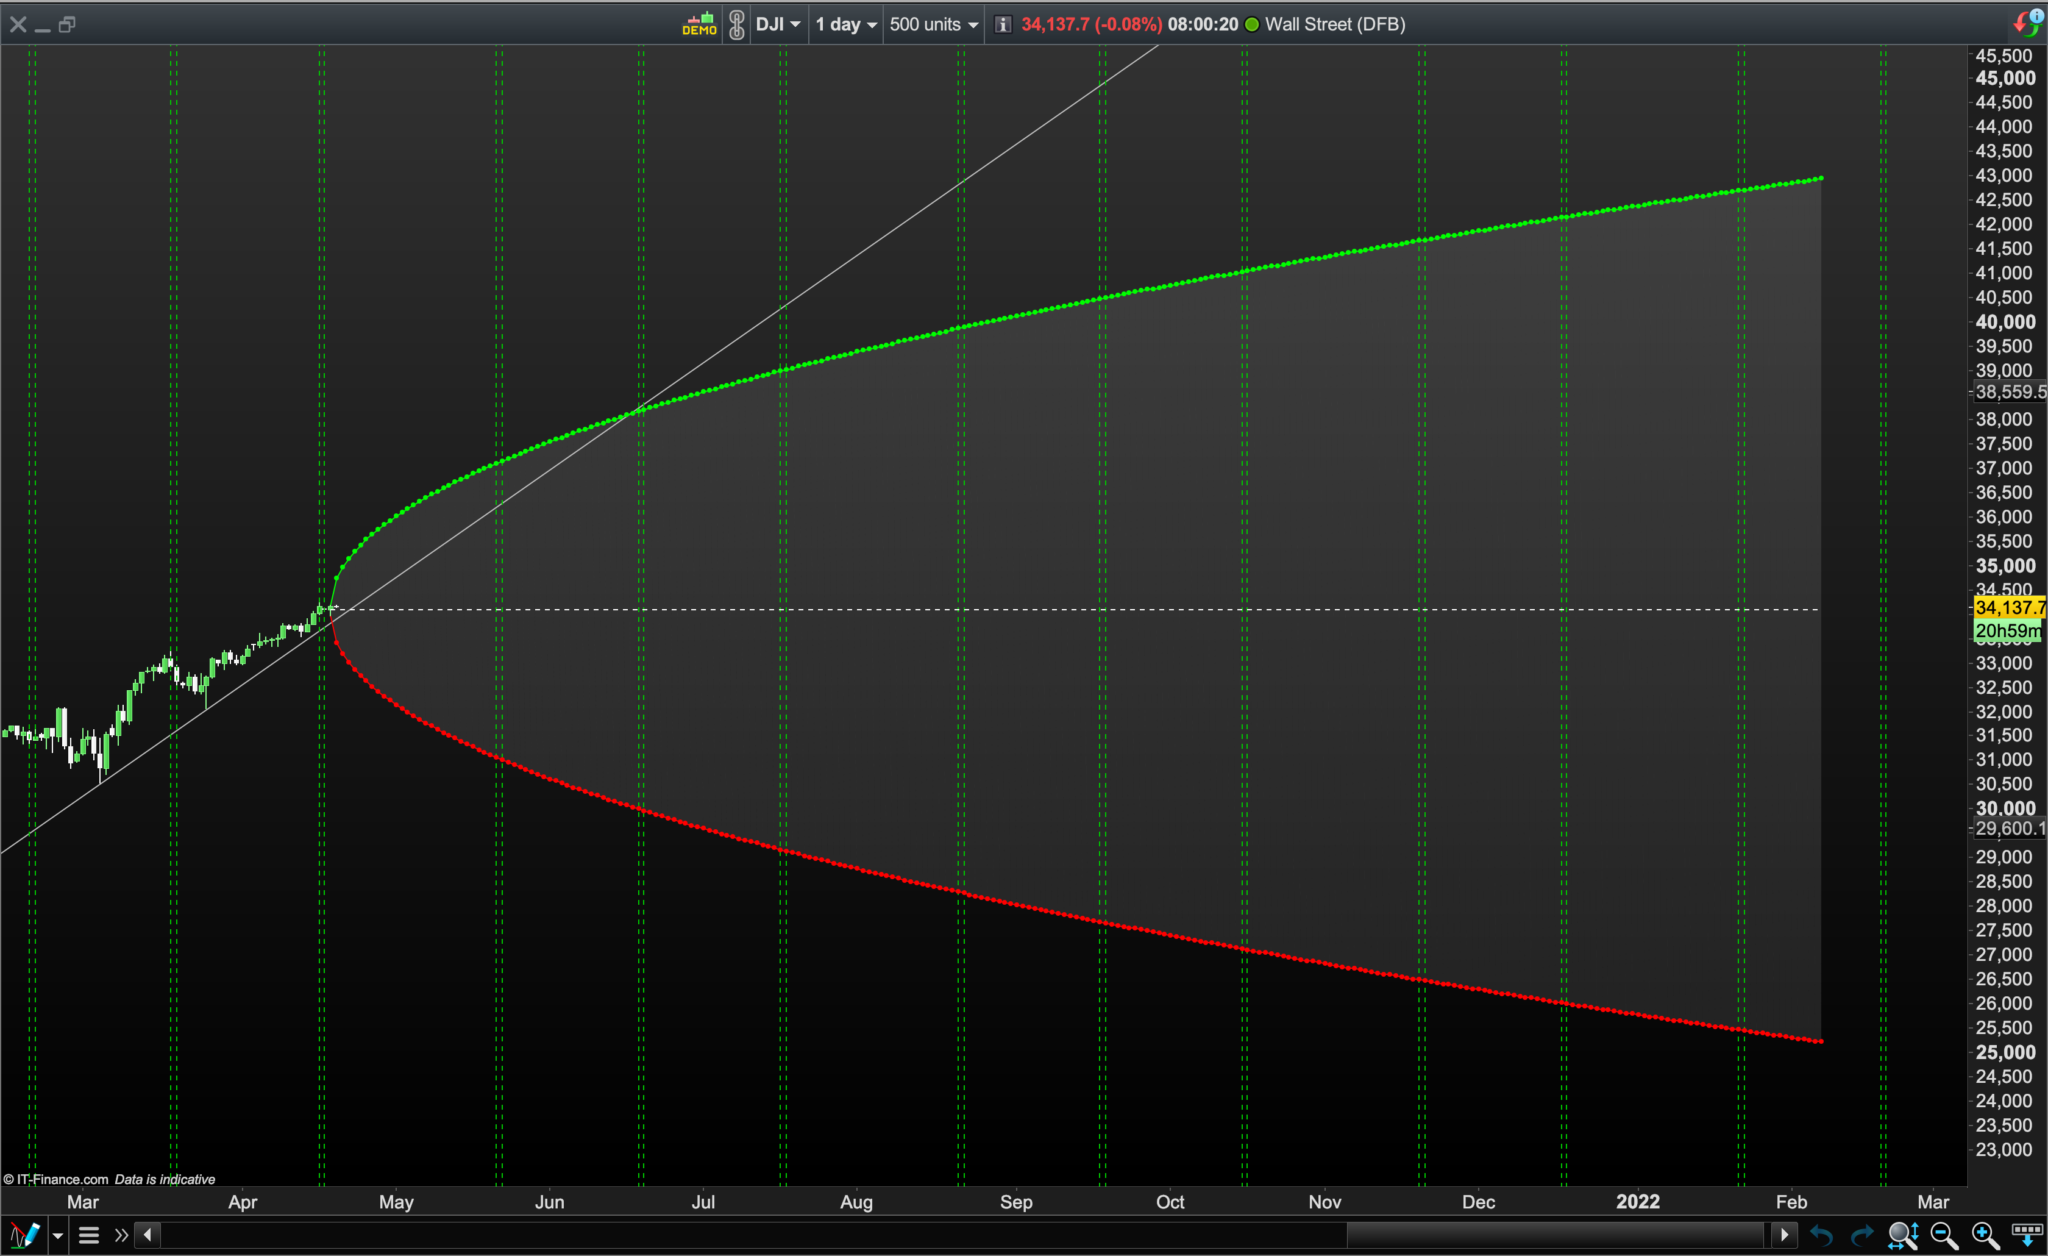
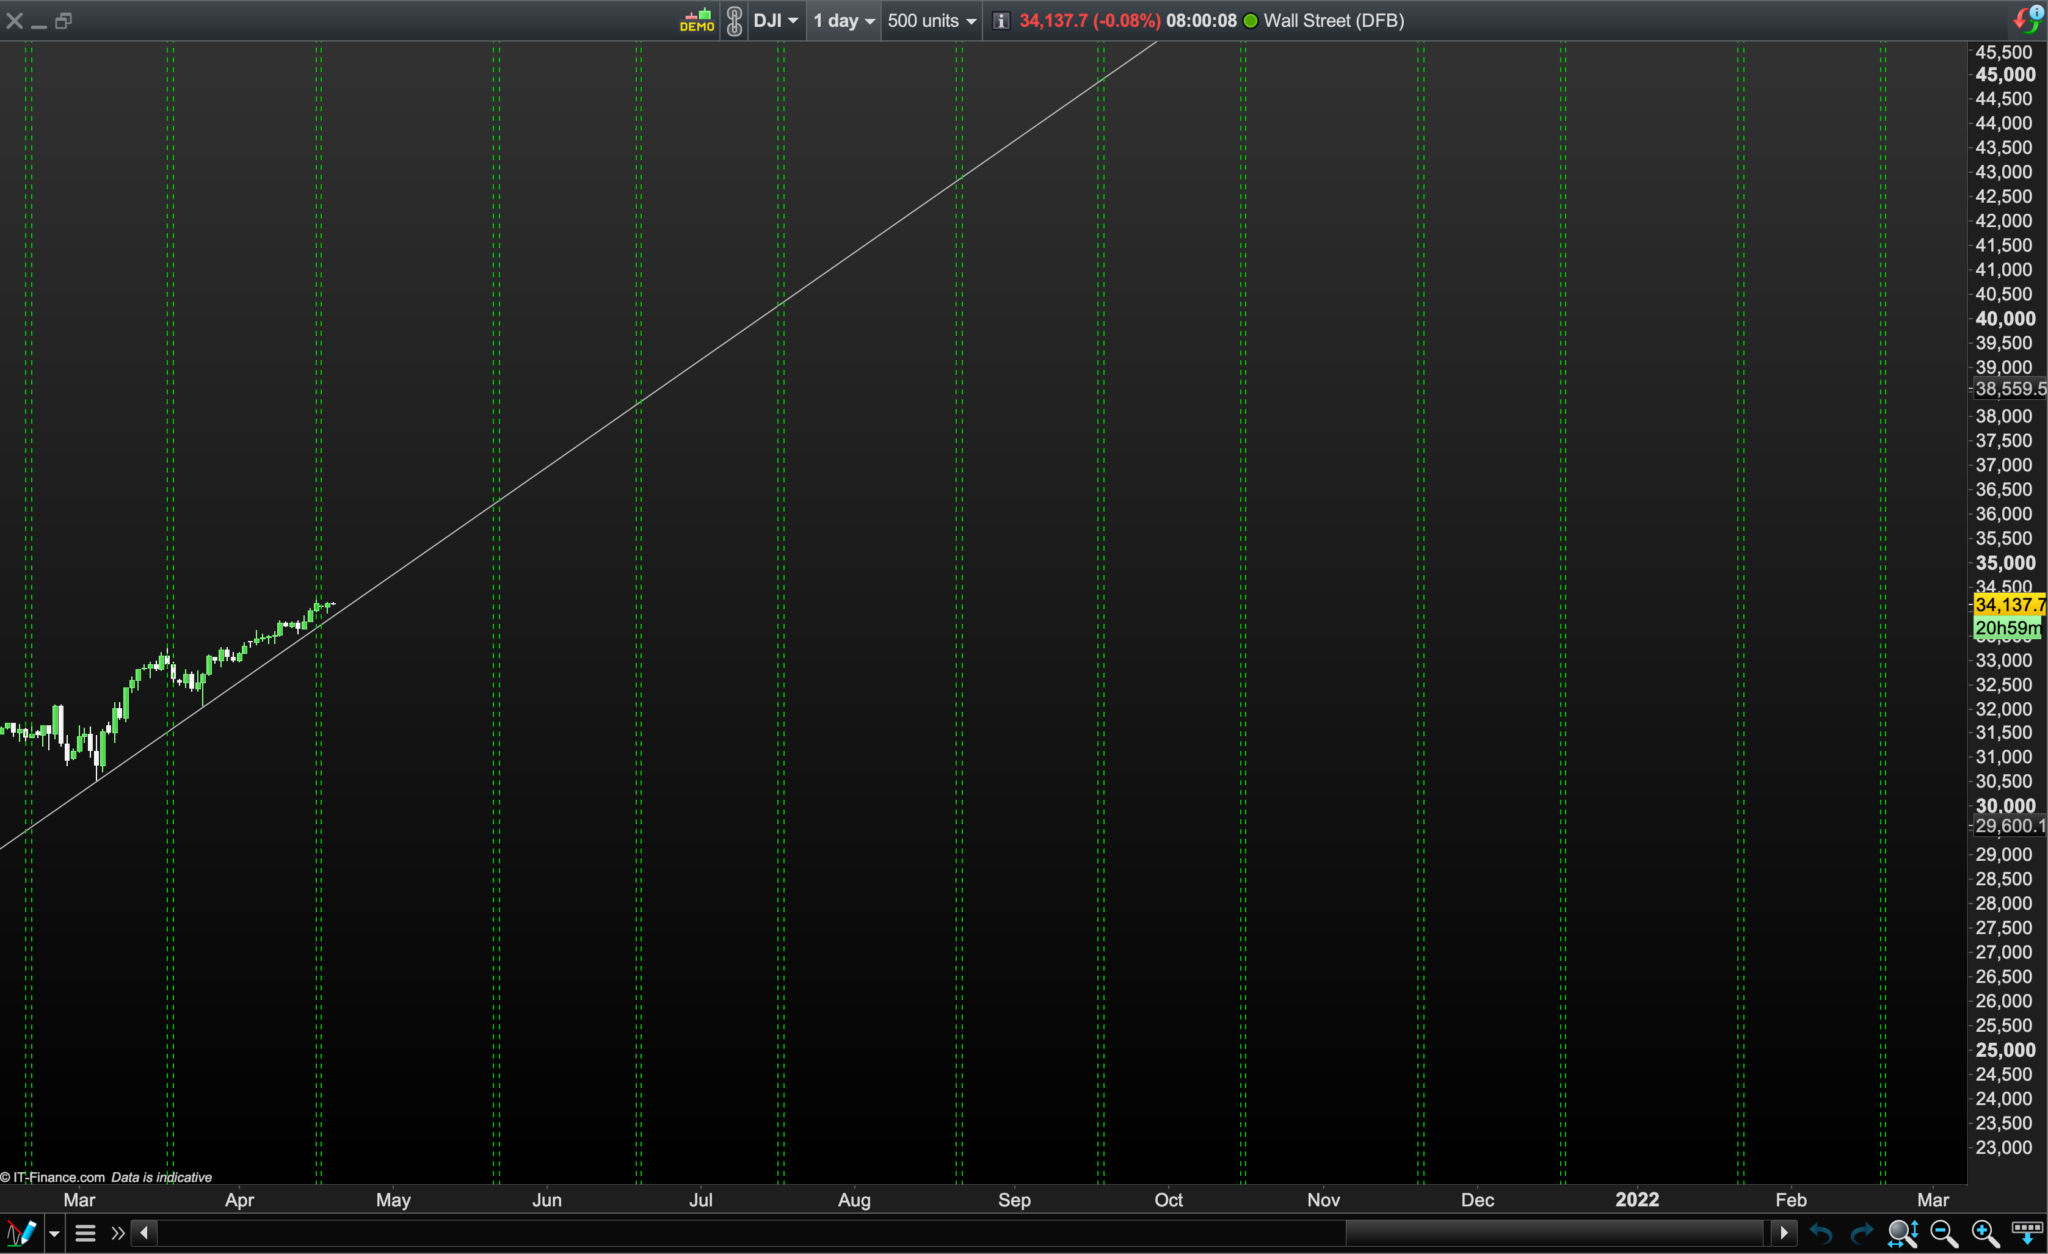
Note: Having a wide SD and low Volatility % setting (or visa versa), but choosing a decay date of a mini market fall out doesn’t mitigate you from forecasting Probability Cone errors! (Pls see images).
Cheers,
Bard