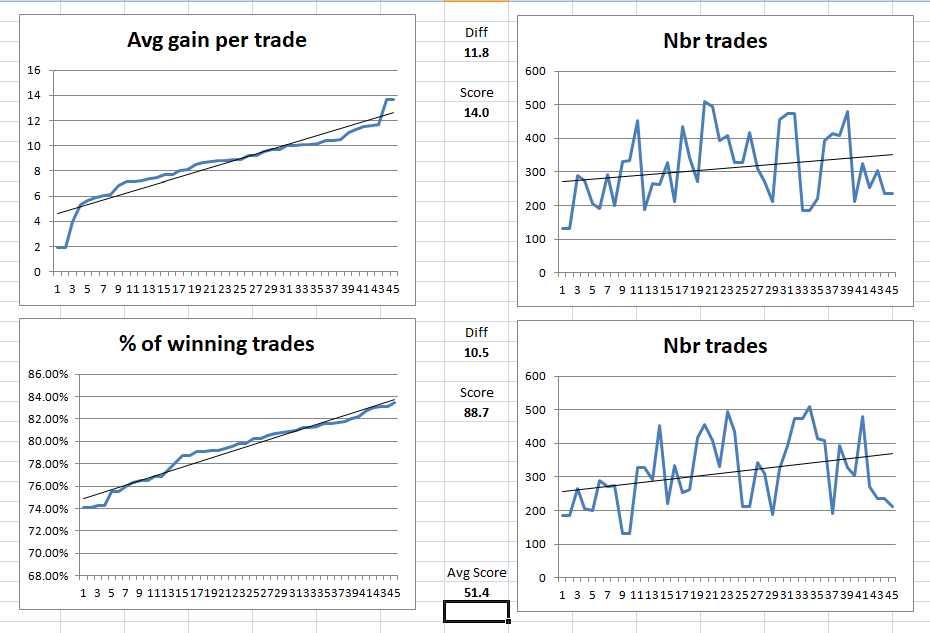
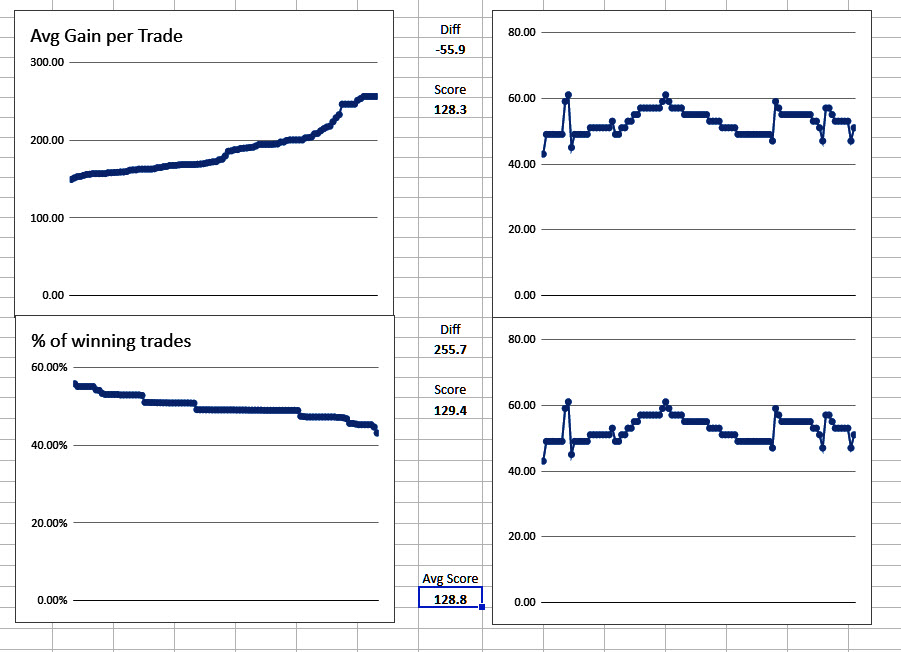
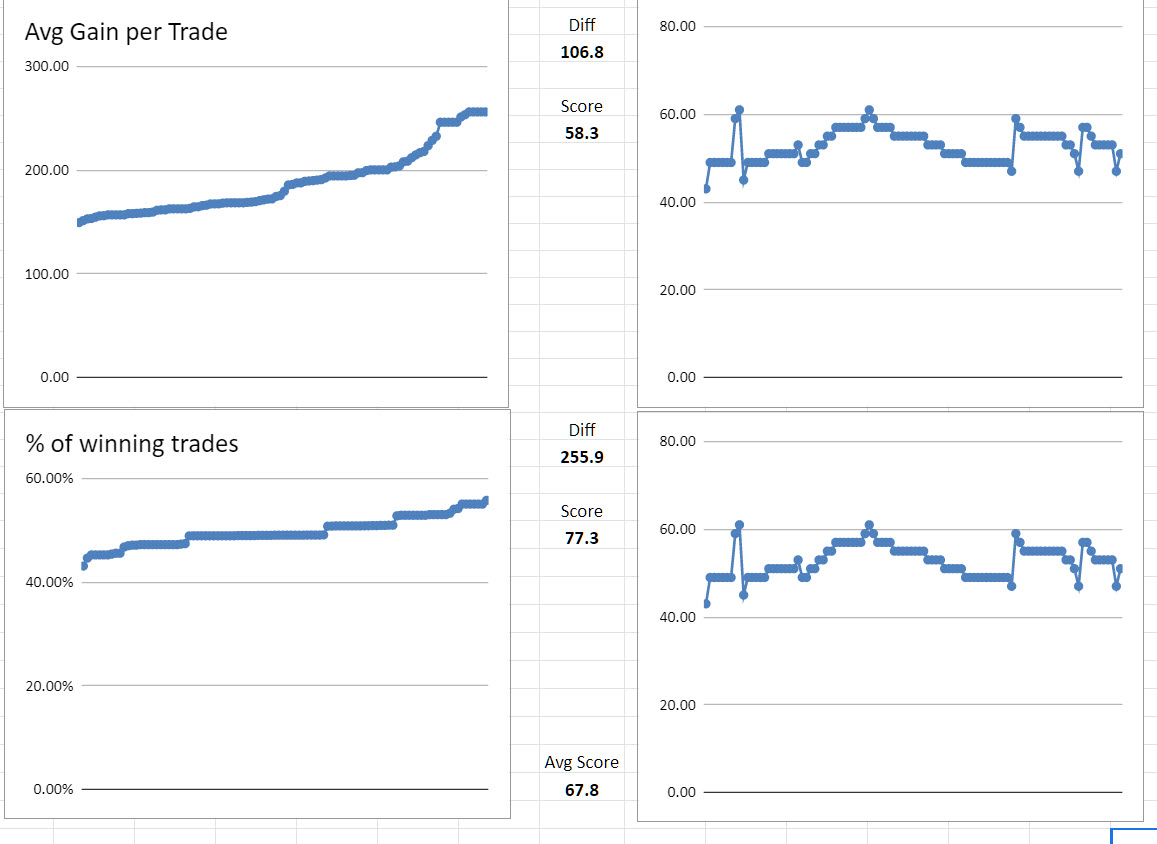
I’ve created a scoring system so as to easily rate each set of robustness test results.
The calculation is:
100-(((H-L)/H))*100)
Basically an inverted percentage of the difference as a percentage of the best result.
H = the best % of winners rate
L = the worst % of winners rate
Replace % of winners with average gain per trade if scoring that. A high score is a good score and a low score is a bad score.
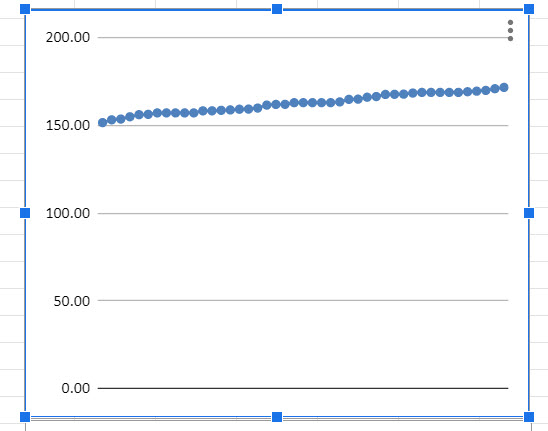
I have set up an Excel book so that I can just clear the contents and drag in my latest test results and the graphs just appear and the calculations for the score are presented. The attached image is for QTY and RANDOM settings of 10 and 5. If I want to test other settings then I will just copy the Excel sheet to another tab and alter the chart data selection and then have a sheet for those settings all ready to use in the future. I’ve included graphs of trade numbers so it is easy to see if there has been plenty of them across the test.
The Excel book is attached – just right click and clear the contents and then drag in your average gain per trade results to the top left box and then drag the % of winners directly under it leaving a one line gap.
Had a few issues as I’m using google sheets!
Also it’s been good (but not enjoyable) to refresh my spreadsheet skills! Use it or Lose it comes to mind! 🙂
Attached my results.
Weird … I couldn’t select my 2nd file as I got an error message saying I cant select the same file twice ,,, but it has a different filename as you can see
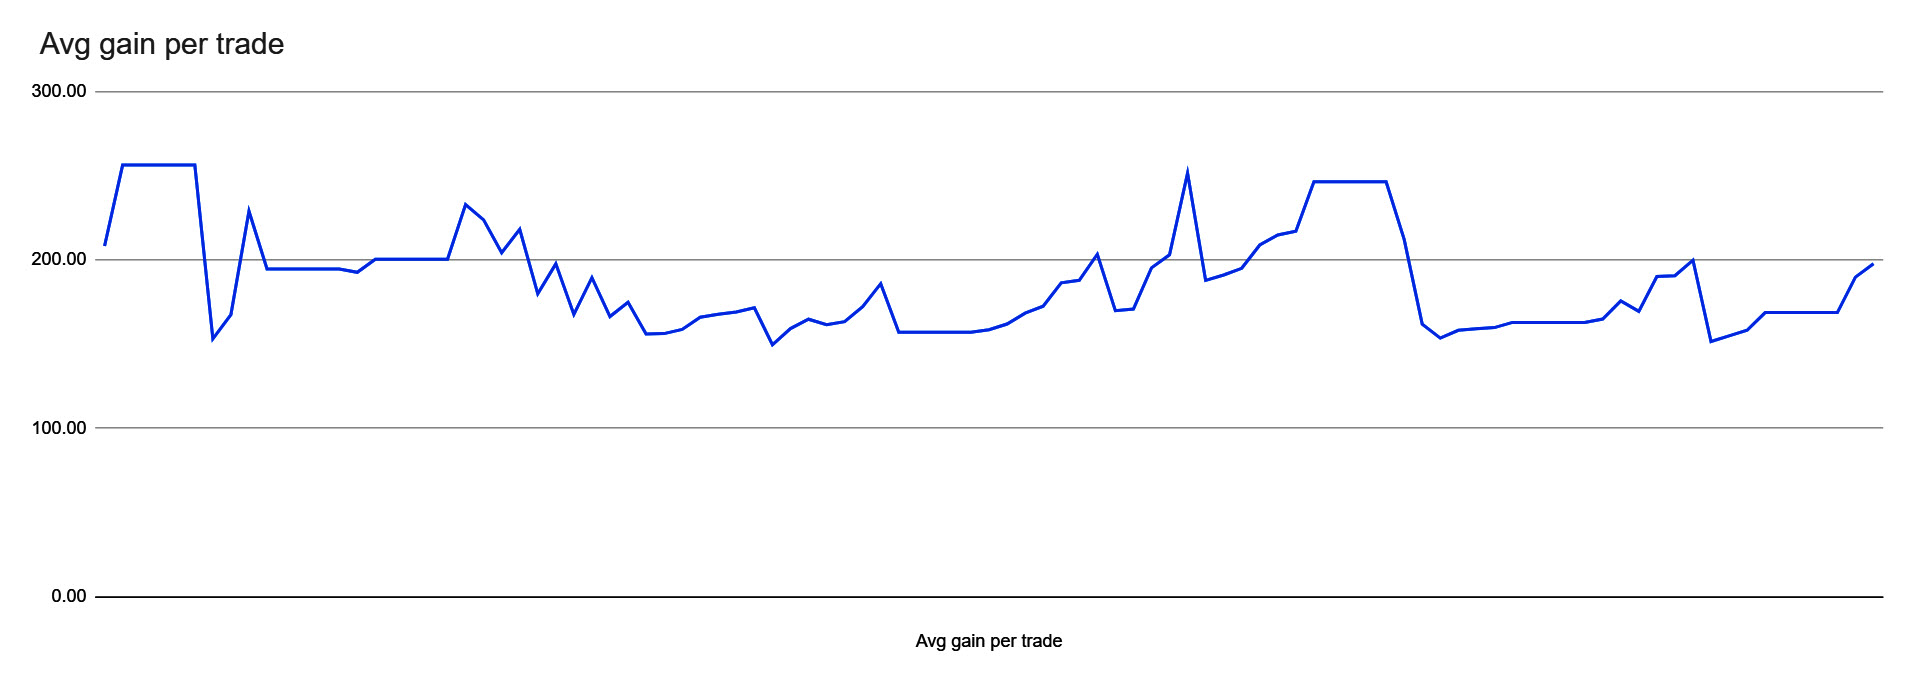
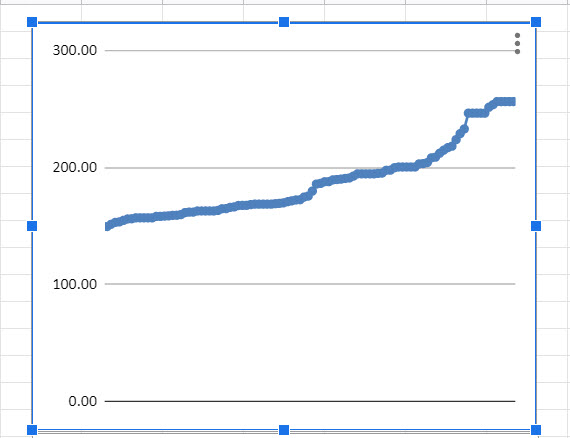
You haven’t organised the average gain per trade from low to high which makes it a little difficult to analyse.
And attached with your Template Vonasi.
I only imported the csv data (as I needed for google sheets) once only, but it produced both graphs anyway??
You haven’t organised the average gain per trade from low to high which makes it a little difficult to analyse.
Okay I’ll do same analysis later or tomorrow on another System!
Her indoors has been outdoors hoovering out my new used Mondeo and was moaning at me glued to the screen! 🙂
It’s clicked with me now why we need 2 lots of data! haha
We can use 1 lot of data but we would have to do a screen shot of the charts separately after sorting columns etc.
Looking good GraHal – now you just have to add the scoring calculation – but perhaps relieving the missus of hoovering the Mondeo duties should take priority!
Attached is the full data for Av Gain.
I’m doing it all a bit quick with one eye on the rerun of House and the data range was still set for your data e1:e47
If I want to test other settings then I will just copy the Excel sheet to another tab and alter the chart data selection and then have a sheet for those settings all ready to use in the future
As the Optimiser displays a max of 100 rows of data, would it not be better to have the VRT Template set from 1 to 101 and then 103 to 204??
There should then be no need to reset the Chart data range etc??
relieving the missus of hoovering the Mondeo duties should take priority!
I had to pull her off that job so she could get me a meal cooked! 🙂
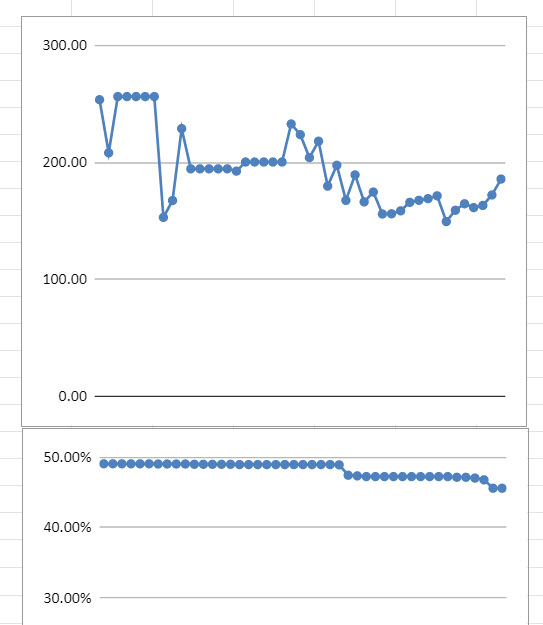
Attached from the VRT Template after changing data ranges and calcs etc.
I guess it will all gel into a routine the more I do it!?
As the Optimiser displays a max of 100 rows of data, would it not be better to have the VRT Template set from 1 to 101 and then 103 to 204?? There should then be no need to reset the Chart data range etc??
Very well spotted – but we would have to ensure that we dragged and dropped our data into exactly the right places which could lead to errors. I’m going to stick to separate sheets for each setting combination as I imagine that I will only use a handful of different settings.
I’m not sure that you got the score thing right as it is impossible to score over 100!
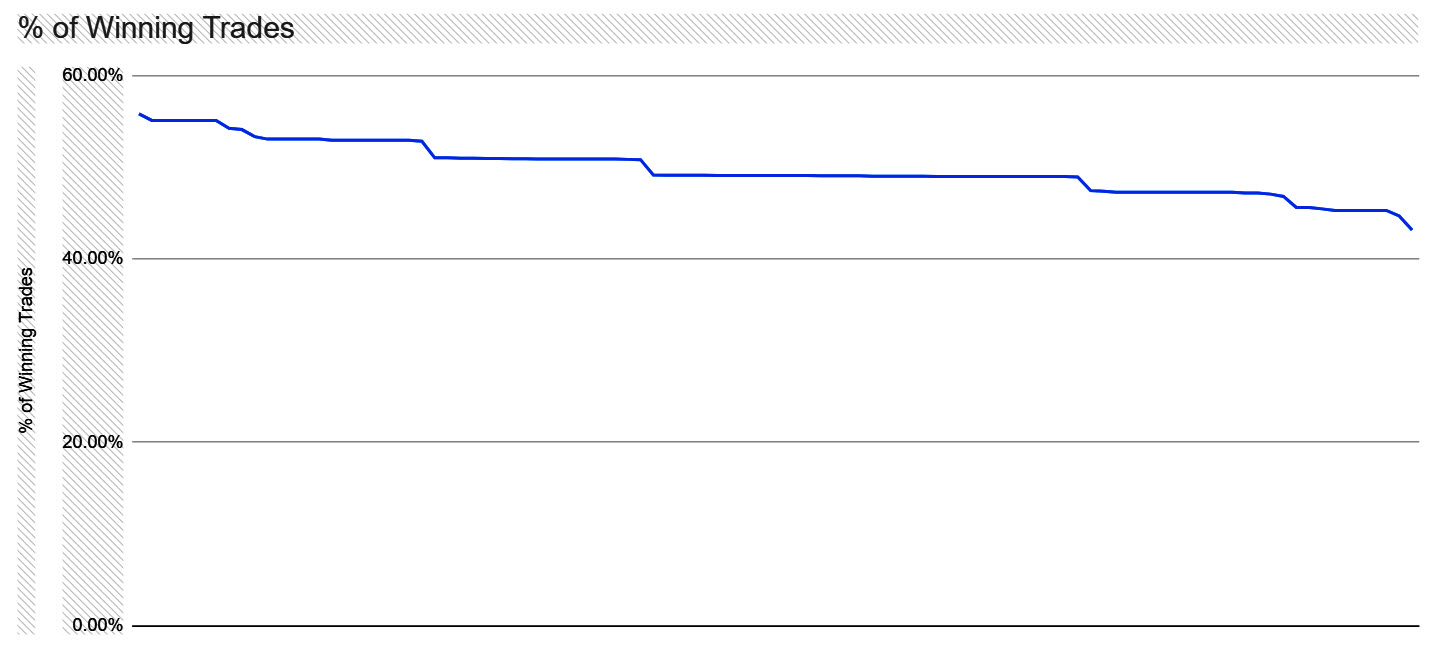
I see that your charts are opposite ways round! One is low to high and one is high to low which will mess the scores up. They must both be low to high.
The attached image is for QTY and RANDOM settings of 10 and 5
I take it you mean Qty 1 to 10 and RANDOM 1 to 5 … both in steps of 1?
They must both be low to high.
Right I’ll go sort it, thanks!
Phew … it’s like being back at work! 🙂