





Swing Fibonacci Spiral Cross Screener
Introduction
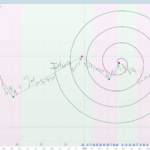
The Swing Fibonacci indicator by BigBeluga grows an Archimedean spiral from the last confirmed swing and then leaves it frozen on the chart until the structure flips again. On a single chart it is easy to read: you look at where price sits among the coils. Across a watchlist of two hundred stocks it is not, because the interesting moment is short. Price reaches one of the arms, trades through it, and a few bars later it is somewhere else.
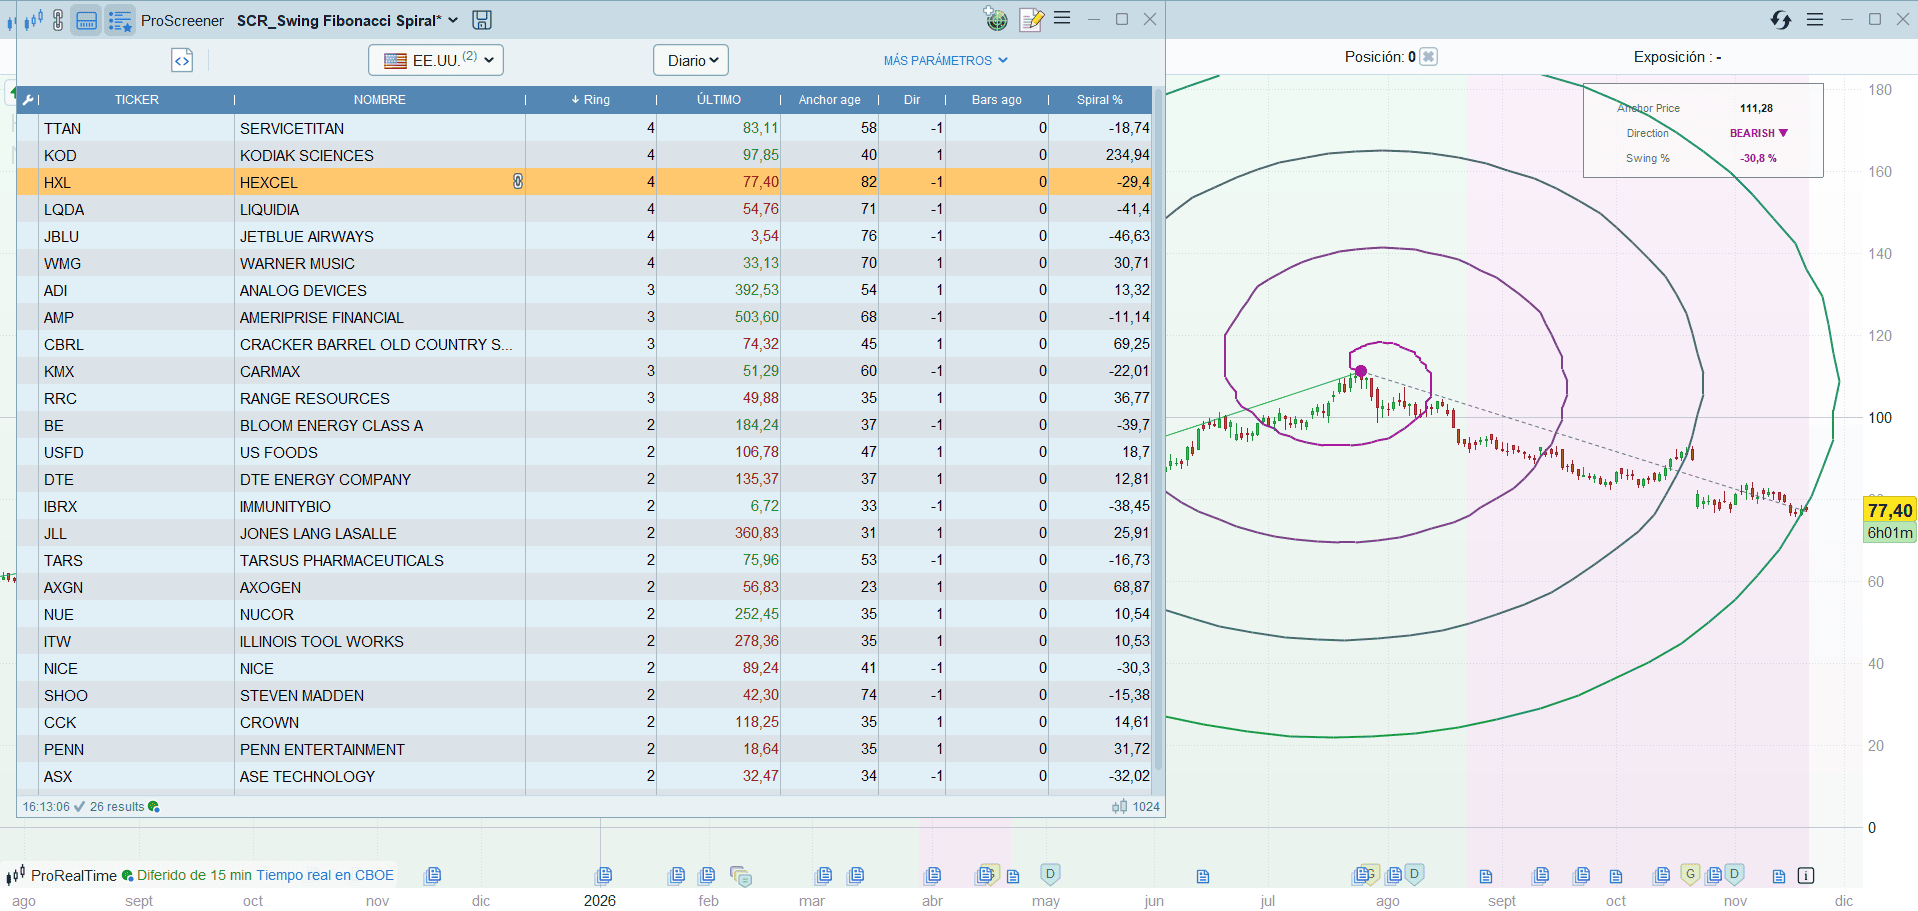
This screener catches that moment. It lists the instruments whose candle is touching the spiral right now: the high and the low of the bar enclose a point of the figure at the bar’s own position on the time axis. It also tells you which coil is being touched, how far that point is from the anchor, and how old the spiral is.
The indicator article explains how the spiral is built and how to read it: Swing Fibonacci: An Archimedean Spiral Anchored on the Last Confirmed Swing. This article only covers what the screener filters and how to use the list.
Why the Spiral and Not the Structure Flip
The obvious screener for this indicator would list the instruments where the structure has just flipped. It was built first, and it was discarded after comparing it against the charts. The flip is a 50-bar Donchian reversal: any zigzag prints it, and by the time it fires the move from the pivot to the new extreme has already happened. Nothing in that list belongs to this indicator.
The spiral does. What makes it worth filtering is that it freezes on the flip. Two numbers are locked at that moment, the range of the last 500 bars and the length of the leg just completed, and from then on the spiral is a fixed figure. Price reaching one of its arms is an event: the figure did not move to meet price, price travelled to the figure.
What the Screener Is Actually Testing
On every bar the screener rebuilds the frozen spiral of the current anchor and asks one question: does this candle contain the spiral at its own abscissa? For a given bar the spiral can cross the same vertical line several times, once per arm, so every crossing is checked and the first one inside the candle is taken.
The swing engine is the indicator’s own, unabridged, so the anchor, the frozen range and the leg length are exactly the ones the chart shows. Nothing was simplified to make the scan cheaper. The test is done segment by segment along the spiral, with a quick bounding-box check in front of it: most bars are nowhere near the figure, and those skip the walk entirely.
How often does it fire? On 150 S&P 500 stocks on daily bars since 2019, with the default settings, a candle touches the spiral on about 4.4 % of the bars. That is a median of six instruments a day out of 150, so the list stays short without any extra filter.
Reading the Columns
- Ring: the coil the candle is crossing. 1 is the innermost one, around the anchor. With the default of 8 spirals there are 4 rings, because two arms make one full turn.
- Dir: 1 if the structure was bullish when the spiral was frozen, -1 if it was bearish. It tells you which side the spiral opens towards.
- Bars ago: bars since the crossing. 0 means the last bar evaluated.
- Spiral %: the signed distance, in percent, from the crossed point to the anchor price. It says where on the figure price is, not only which ring.
- Anchor age: bars since the pivot the spiral hangs on. A large number is not a fault: it means a long leg with no new flip.
The rings are not touched evenly. In the same sample, ring 2 took 42 % of the crossings, ring 3 34 % and ring 4 21 %, while the innermost ring took less than 3 %. By the time a spiral exists, price has already moved away from the anchor. That is why ringMin and ringMax really filter: asking only for ring 4 keeps the markets that have stretched to the outer edge of their recent range.
The One Thing to Know About Timing
The chart only shows the spiral of the current anchor. When the structure flips, the old figure is replaced, and a crossing that happened on it is no longer anywhere on the screen.
maxAge is the capture window: 0 lists only the candles touching the spiral on the last bar, and N lists any touch within the last N bars, always reporting the most recent one. Widening it does not make the signal better, it only keeps the same event visible for longer. Keep it well below the usual distance between flips (a median of about 56 bars on daily stocks), or some rows will point to a figure the chart has already redrawn.
The Code
//---------------------------------------------------------------
//PRC_Swing Fibonacci Spiral Cross Screener
//version = 0
//17.09.26
//Iván González @ www.prorealcode.com
//Sharing ProRealTime knowledge
//--------------------------------------------------------------------//
// Lists the instruments whose CANDLE IS TOUCHING THE SPIRAL: the bar's range
// contains the spiral at the bar's own abscissa. That is the event the chart
// shows, and it is the one thing this indicator has that no other zigzag has.

//=== INPUTS: swing engine and spiral (same defaults as the indicator) ===
swingLength = 50   // Swing Structure (50..100)
spiralArms = 8     // Spirals qty (1..10): rotations around the anchor
spiralRad = 2.5    // Radius (1..8): multiplies the 500-bar range AND the reach
spiralRes = 300    // segments of the spiral (original resolution: 300)

//=== INPUTS: screener ===
maxAge = 0         // 0 = touching on the last evaluated bar; N = within the
                   // last N bars. This is the CAPTURE window, not a quality
                   // filter: widening it only makes the same event visible for
                   // longer. Keep it well under 56, the median gap between
                   // flips, or the figure behind the row will be gone
ringMin = 0        // 0 = off. Lowest ring accepted (1 = innermost)
ringMax = 0        // 0 = off. Highest ring accepted

//=== PERSISTENT STATE (verbatim from the indicator) ===
ONCE hiIdx = 0
ONCE hiVal = high
ONCE loIdx = 0
ONCE loVal = low
ONCE hiSet = 0
ONCE loSet = 0
ONCE dirUp = 0
ONCE swIdx = 0
ONCE swPrice = 0
ONCE swReady = 0
ONCE lockRng = 0
ONCE lockLen = 0
ONCE lockDir = 0

// state as it stood at the close of the previous bar
prevDir = dirUp
pHiSet = hiSet
pLoSet = loSet

IF barindex >= swingLength - 1 THEN
   hiWin = highest[swingLength](high)
   loWin = lowest[swingLength](low)

   IF high = hiWin THEN
      hiIdx = barindex
      hiVal = high
      hiSet = 1
      dirUp = 1
   ENDIF
   // the low test runs AFTER the high test, as in the original
   IF low = loWin THEN
      loIdx = barindex
      loVal = low
      loSet = 1
      dirUp = 0
   ENDIF

   IF dirUp <> prevDir THEN
      // range and leg length are FROZEN here: from now on the spiral does not
      // move until the next flip, which is what makes it a figure and not a
      // trailing curve
      rngLen = min(500, barindex + 1)
      lockRng = highest[rngLen](high) - lowest[rngLen](low)

      IF dirUp = 1 THEN
         lockLen = barindex - loIdx + 20
         IF loSet = 1 THEN
            swIdx = loIdx
            swPrice = loVal
            swReady = 1
            lockDir = 1
         ENDIF
      ELSE
         lockLen = barindex - hiIdx + 20
         IF hiSet = 1 THEN
            swIdx = hiIdx
            swPrice = hiVal
            swReady = 1
            lockDir = 0
         ENDIF
      ENDIF
      // the guard the indicator also applies before drawing: without both
      // extremes really recorded the figure would hang on bar 0
      IF pHiSet = 0 OR pLoSet = 0 THEN
         swReady = 0
      ENDIF
   ENDIF
ENDIF

//=== SPIRAL GEOMETRY ===
// x(u) = anchorBar   -   u*cos(theta)*radius*lockLen
// y(u) = anchorPrice + s*u*sin(theta)*lockRange*radius / dY
// with u from 0 to 1 and theta from 0 to arms*180 degrees. dY is the
// peak-to-peak of u*sin(theta) and depends ONLY on arms and resolution, never
// on price, so it is computed once on the first bar and reused.
// The angle advances by rotation recurrence rather than evaluating sin/cos of
// an angle that reaches 1800 degrees with 10 arms.
resN = max(3, spiralRes)
dAng = spiralArms * 180 / (resN - 1)
cD = cos(dAng)
sD = sin(dAng)

ONCE dYdone = 0
ONCE dY = 0
IF dYdone = 0 THEN
   cA = 1
   sA = 0
   yLo = 0
   yHi = 0
   FOR i = 0 TO resN - 1 DO
      yv = i / (resN - 1) * sA
      IF yv < yLo THEN
         yLo = yv
      ENDIF
      IF yv > yHi THEN
         yHi = yv
      ENDIF
      cN = cA * cD - sA * sD
      sN = sA * cD + cA * sD
      cA = cN
      sA = sN
   NEXT
   dY = yHi - yLo
   dYdone = 1
ENDIF

//=== IS THE CANDLE TOUCHING THE SPIRAL? ===
hit = 0
hitRing = 0
hitY = 0

// Bounding box first: the spiral spans lockRange*radius vertically around the
// anchor and radius*lockLen to each side of it. Most bars fail this and never
// enter the loop, which is what keeps the cost down.
IF swReady = 1 AND dY > 0 AND lockRng > 0 AND lockLen > 0 THEN
   boxTop = swPrice + lockRng * spiralRad
   boxBot = swPrice - lockRng * spiralRad
   boxRch = spiralRad * lockLen
   IF high >= boxBot AND low <= boxTop AND abs(barindex - swIdx) <= boxRch THEN
      yScale = lockRng * spiralRad / dY
      IF lockDir = 1 THEN
         dirSign = 0 - 1
      ELSE
         dirSign = 1
      ENDIF

      cA = 1
      sA = 0
      xPrev = 0
      yPrev = 0
      FOR i = 0 TO resN - 1 DO
         u = i / (resN - 1)
         xCur = round(swIdx - u * cA * spiralRad * lockLen)
         yCur = swPrice + dirSign * u * sA * yScale

         IF i > 0 AND hit = 0 THEN
            // does this segment cross the abscissa of the live bar?
            IF (xPrev - barindex) * (xCur - barindex) <= 0 THEN
               IF xCur <> xPrev THEN
                  f = (barindex - xPrev) / (xCur - xPrev)
                  yAt = yPrev + f * (yCur - yPrev)
               ELSE
                  yAt = yCur
               ENDIF
               IF yAt >= low AND yAt <= high THEN
                  hit = 1
                  hitY = yAt
                  // which turn of the spiral this point belongs to. Two arms
                  // make one full turn, and round(x - 0.5) stands in for a
                  // floor that is not available here
                  hitRing = round(u * spiralArms / 2 - 0.5) + 1
                  IF hitRing < 1 THEN
                     hitRing = 1
                  ENDIF
               ENDIF
            ENDIF
         ENDIF

         xPrev = xCur
         yPrev = yCur
         cN = cA * cD - sA * sD
         sN = sA * cD + cA * sD
         cA = cN
         sA = sN
      NEXT
   ENDIF
ENDIF

//=== MOST RECENT TOUCH INSIDE THE WINDOW ===
// hit, hitRing and hitY are ordinary series, so they can be read back. The
// search stops at the first one found, which is the most recent: the row can
// never describe an older crossing than one that happened since.
found = 0
ageOut = 0
ringOut = 0
pctOut = 0
FOR k = 0 TO maxAge DO
   IF found = 0 AND hit[k] = 1 THEN
      found = 1
      ageOut = k
      ringOut = hitRing[k]
      // distance of the crossed point to the anchor. Guarded because it
      // divides by a state variable and every column is evaluated on EVERY
      // bar, warm-up included, whatever the SCREENER condition says
      IF swPrice > 0 THEN
         pctOut = round((hitY[k] - swPrice) / swPrice * 10000) / 100
      ENDIF
   ENDIF
NEXT

IF lockDir = 1 THEN
   dirOut = 1
ELSE
   dirOut = 0 - 1
ENDIF
ancAge = barindex - swIdx

//=== FILTERS ===
listed = 0
IF found = 1 AND swReady = 1 THEN
   listed = 1
ENDIF
IF listed = 1 AND ringMin > 0 AND ringOut < ringMin THEN
   listed = 0
ENDIF
IF listed = 1 AND ringMax > 0 AND ringOut > ringMax THEN
   listed = 0
ENDIF

SCREENER[listed = 1](ringOut AS "Ring", dirOut AS "Dir", ageOut AS "Bars ago", pctOut AS "Spiral %", ancAge AS "Anchor age")
Settings
- swingLength (default: 50): structure length of the swing engine, same as the indicator. Shorter values make the structure flip constantly, and every flip draws a new spiral.
- spiralArms (default: 8): number of arms. Two arms make one ring, so 8 arms give 4 rings.
- spiralRad (default: 2.5): radius multiplier, applied both to the 500-bar range and to the reach in bars.
- spiralRes (default: 300): number of segments used to walk the spiral. It drives the cost of the scan. 150 keeps the shape and only makes the line between points coarser.
- maxAge (default: 0): capture window in bars. 0 = touching on the last bar.
- ringMin (default: 0 = off): lowest ring accepted.
- ringMax (default: 0 = off): highest ring accepted.
Use the same swingLength, spiralArms and spiralRad as in the indicator on your chart, or the spiral the screener tests will not be the one you see.
Notes and Limitations
- Cost. This is heavier than a typical screener: on the bars that pass the bounding box, the spiral is walked segment by segment. With spiralRes = 300 it runs fine on a normal watchlist. If a large universe drags, lower it to 150.
- History window. ProScreener works on 255 bars with a Complete subscription and 1024 with Premium, while your chart may hold far more. The anchor and the frozen range are rebuilt inside that window, so on a very long leg the screener can see a different spiral from the one on a chart with full history.
- Trading hours. Set the selector to Regular when you compare the list with a chart. A chart that includes the pre-market and an end-of-day screener can be one bar apart.
- It is geometry, not a signal. The screener tells you where price is relative to the figure. Whether touching an outer ring anticipates a reversal or a continuation has not been tested here. Use the list to know which charts to open, not as an entry rule.