





Elliott Wave Pro Engine: Impulse and Zigzag Detection with Fibonacci Projections
Introduction
Counting Elliott waves by hand is slow and subjective: two analysts looking at the same chart rarely agree on where wave 3 ends. Elliott Wave Pro Engine by Jos-ProTrader takes a mechanical approach. It builds a clean list of swing highs and swing lows, looks at the most recent ones and checks whether they form one of two Elliott structures: an impulse that has completed its first four waves, or an A-B-C corrective zigzag. When a structure qualifies, it is drawn on the chart with its wave labels and a projection of the next move.
The indicator does not try to label the whole history. It always shows the latest structure only, and it re-evaluates the chart every time a new swing point is confirmed. That makes it a practical tool to answer one question: what is the market most likely doing right now?
How It Works
1. Swing points. A swing high is a bar whose high is above the highs of the 11 bars that follow it and not below the highs of the 11 bars before it; a swing low is the mirror image. The list always alternates highs and lows: when a new swing point has the same type as the previous one, it replaces it only if it is more extreme (a higher high or a lower low). A swing point is confirmed 11 bars after it forms.
2. Impulse in progress (waves 1 to 4). Every time the swing list changes, the last five swing points are checked. A bullish impulse starts at a swing low and alternates low, high, low, high, low. It qualifies when:
- wave 2 retraces between 23.6% and 99.9% of wave 1 and stays above the start of wave 1,
- wave 3 goes beyond the end of wave 1,
- wave 4 does not overlap wave 1 (it stays above the end of wave 1).
A bearish impulse is the mirror image. Wave 5 has not formed yet, so the indicator projects it: from the end of wave 4, a move equal to wave 1 multiplied by the Wave 5 Projection factor (1.0 by default).
3. Corrective zigzag (A-B-C). The last four swing points are checked for a zigzag: wave B must be shorter than wave A, and wave C must go beyond the end of wave A. A “Bullish corrective zigzag” is a downward A-B-C (high, low, high, low), the kind of correction found inside an uptrend; a “Bearish corrective zigzag” is an upward one. Wave C is projected from the end of wave B with the length of wave A multiplied by the Wave C Projection factor (1.0 by default).
4. One structure at a time. Each new swing point clears the chart and the latest swing points are analysed again. At most one impulse and one zigzag are drawn, and both can appear at the same time (for example, an impulse whose last legs also form a zigzag).
Key Features at a Glance
- Automatic swing detection with alternating highs and lows.
- Detection of bullish and bearish impulses (waves 1 to 4) with the classic rules for waves 2, 3 and 4.
- Detection of bullish and bearish A-B-C corrective zigzags.
- Wave labels (1) to (4) and (a), (b), (c) on each swing point.
- Dashed projection of wave 5 and wave C, with the target level.
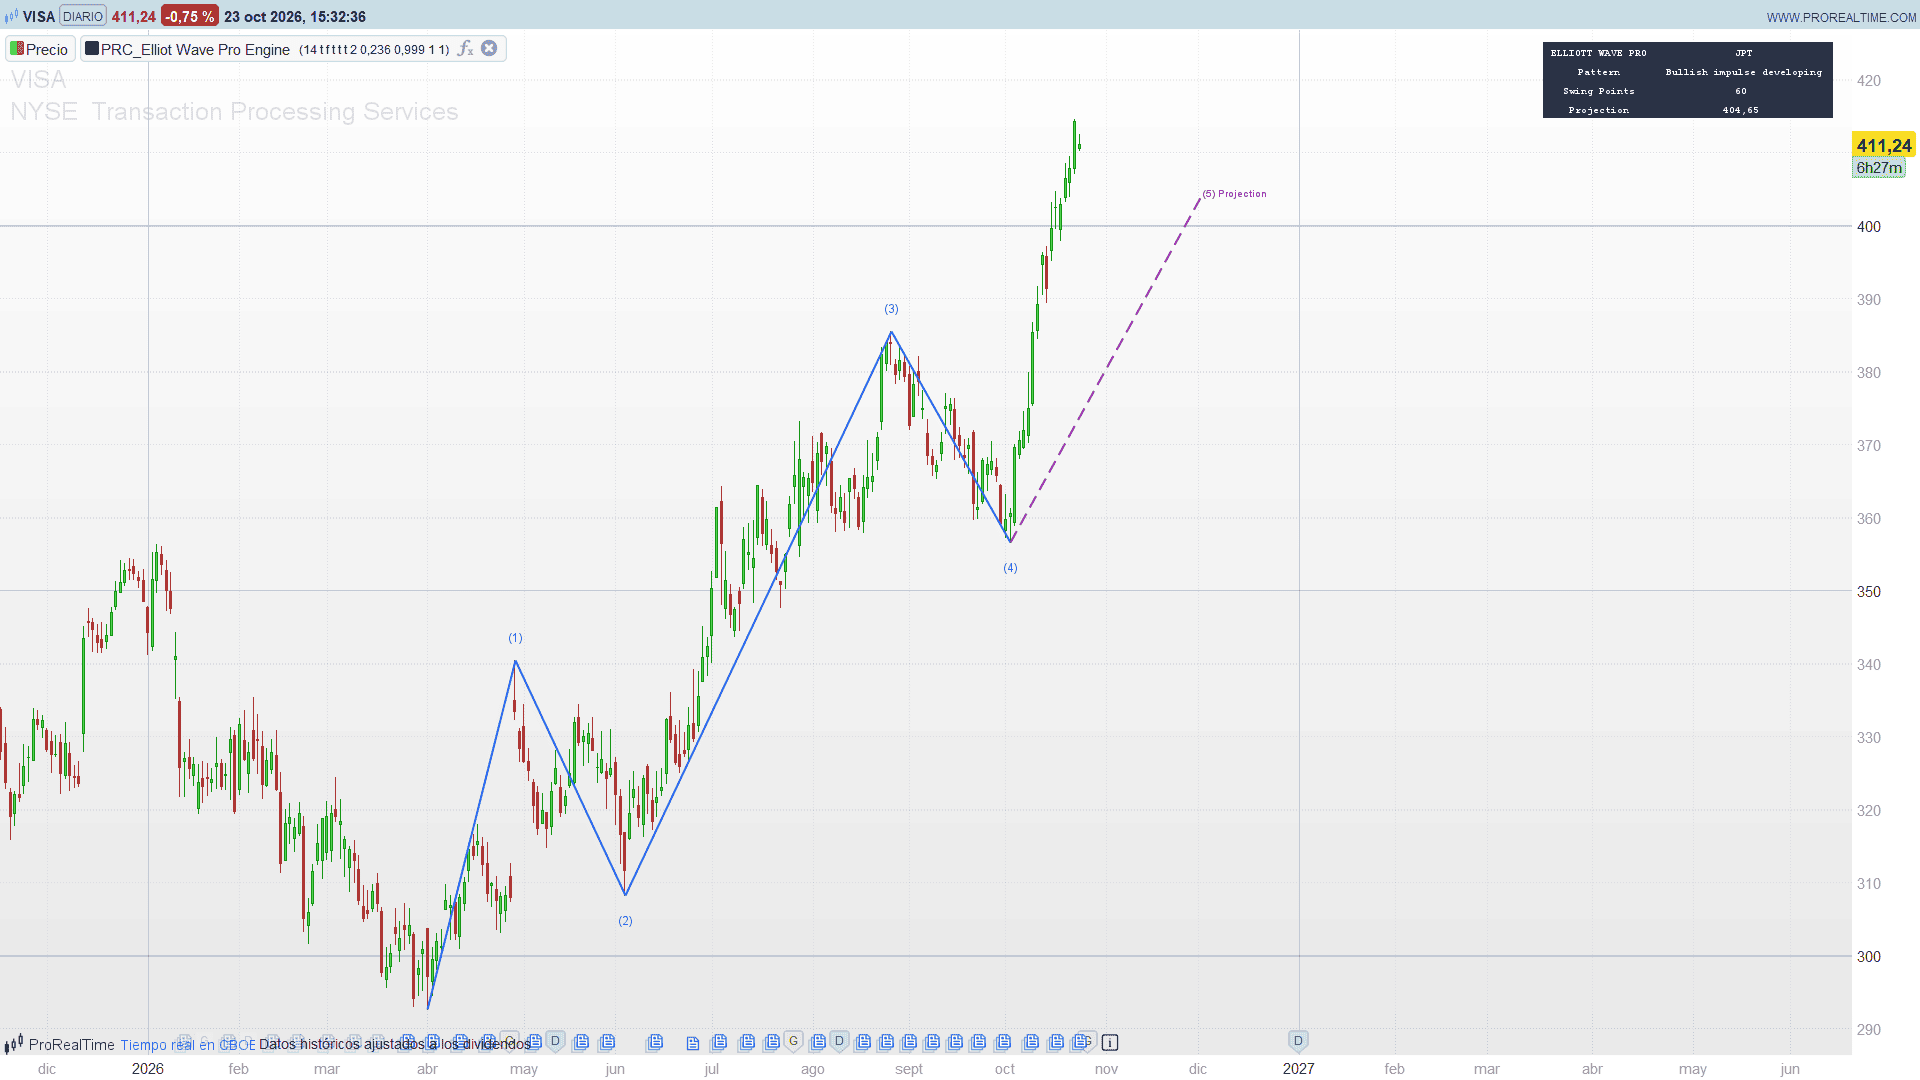
- Status panel with the last pattern found, the number of swing points and the last projected price.
How to Read the Indicator
- Blue lines with (1) to (4): a bullish impulse in progress. The purple dashed line shows where wave 5 would end if it is as long as wave 1.
- Red lines with (1) to (4): a bearish impulse in progress, with its wave 5 projected downwards.
- Orange lines with (a), (b), (c): a downward corrective zigzag, the pullback that usually interrupts an uptrend. The projection shows where wave C would end if it is as long as wave A.
- Red lines with (a), (b), (c): an upward corrective zigzag, the bounce inside a downtrend.
- The panel keeps the last pattern found and its projection until a new one appears, even when the drawing has been cleared by a newer swing point that does not form a pattern.
- The structures only change when a bar closes: nothing is redrawn inside the bar in progress.
Practical Applications
- Wave 5 targets: when a bullish impulse is in progress, wave 4 has just finished and the projection gives a first target for wave 5. A move below the end of wave 1 would break the impulse.
- Buying the end of a correction: an orange zigzag in an uptrend marks a pullback in three waves. The end of wave C, near its projection, is the area where the correction is expected to finish.
- Context for other tools: use the structure as a filter, taking long setups when a bullish impulse is in progress or when a downward zigzag reaches its projection, and short setups in the opposite cases.
- Different degrees: a shorter Pivot Length (5 or 3) shows the small waves; a longer one (15 to 30) only the large swings.
Indicator Configuration
Wave detection:
- pivotLen (default 11, from 2 to 30): bars on each side needed to confirm a swing point.
- inProgress (default 1): 1 = draw the projection of the next wave.
- lengthType (default 0): 0 = wave lengths in price, 1 = in percent of the starting point. In percent mode the ratios between waves change slightly, but the projections are not meaningful (they add a percentage to a price): keep 0 if you use the projections.
Pattern display:
- showImpulse (default 1): detect and draw impulses.
- showZigzag (default 1): detect and draw corrective zigzags.
- showProjections (default 1): draw the wave 5 and wave C projections.
- lineWidth (default 2, from 1 to 4): width of the wave lines.
Fibonacci projections:
- retrace2Min (default 0.236) and retrace2Max (default 0.999): allowed retracement of wave 2 relative to wave 1.
- wave5Extension (default 1.0): wave 5 projection as a multiple of wave 1.
- waveCExtension (default 1.0): wave C projection as a multiple of wave A.
Colours:
- impR, impG, impB / corR, corG, corB / proR, proG, proB / bearR, bearG, bearB: colours of the bullish impulse, the bullish zigzag, the projections and the bearish structures.
Add the indicator on the price chart. The labels are placed half an ATR above the swing highs and below the swing lows, and the projection labels a few bars to the right of the projection, so they keep their position relative to the price when you change the zoom.
The Code
//---------------------------------------------------------------
//PRC_Elliott Wave Pro Engine [JPT]
//version = 0
//22.10.2026
//Iván González @ www.prorealcode.com
//Author: Jos-ProTrader
//Sharing ProRealTime knowledge
//--------------------------------------------------------------------//
DEFPARAM DRAWONLASTBARONLY = true

// ===================== INPUTS =====================
// Wave detection
pivotLen = 11          // Pivot Length (2 to 30): bars on each side of a swing point
inProgress = 1         // In Progress: 1 = project the next wave of the pattern in progress
lengthType = 0         // Length Type: 0 = Absolute (price), 1 = Percent

// Pattern display
showImpulse = 1        // Show Impulse Waves
showZigzag = 1         // Show Corrective Waves
showProjections = 1    // Show Fibonacci Projections
lineWidth = 2          // Line Width (1 to 4)

// Fibonacci projections
retrace2Min = 0.236    // Wave 2 Minimum Retracement (of wave 1)
retrace2Max = 0.999    // Wave 2 Maximum Retracement (of wave 1)
wave5Extension = 1.0   // Wave 5 Projection (x wave 1, from the end of wave 4)
waveCExtension = 1.0   // Wave C Projection (x wave A, from the end of wave B)

// Colours: impulse, correction, projection and bearish
impR = 41
impG = 98
impB = 255
corR = 239
corG = 108
corB = 0
proR = 156
proG = 39
proB = 176
bearR = 242
bearG = 54
bearB = 69

// ===================== SWING POINTS =====================
pL = max(2, min(30, round(pivotLen)))
lwV = max(1, min(4, round(lineWidth)))
projGap = max(5, pL * 3)

// Highest high / lowest low of the last pL bars (offsets 0 to pL-1)
hhR = highest[pL](high)
llR = lowest[pL](low)

// Persistent state, all in arrays (they keep their value between ticks)
IF barindex = 0 THEN
   $gs[0] = 0 - 1      // last bar processed by the engine
   $gs[1] = 0          // number of swing points
   $gs[2] = 0          // last pattern found (0 = waiting for pivots)
   $gs[3] = 0          // 1 = there is a projected price
   $gs[4] = 0          // projected price
   $gs[5] = 0          // 1 = an impulse is drawn
   $gs[6] = 0          // 1 = bullish impulse, 0 = bearish
   $gs[7] = 0          // 1 = wave 5 projection drawn
   $gs[8] = 0          // wave 5 projected price
   $gs[9] = 0          // 1 = a zigzag is drawn
   $gs[10] = 0         // 1 = bullish zigzag, 0 = bearish
   $gs[11] = 0         // 1 = wave C projection drawn
   $gs[12] = 0         // wave C projected price
ENDIF

// The engine runs once per CLOSED bar, so the waves never change inside a bar:
// a historical bar is processed on itself; the live bar is processed when it
// closes, on the first tick of the next one
FOR pss = 1 DOWNTO 0 DO
   ofs = pss
   doIt = 0
   IF ofs = 1 AND barindex >= 1 AND $gs[0] < barindex - 1 THEN
      doIt = 1
   ENDIF
   IF ofs = 0 AND NOT islastbarupdate AND $gs[0] < barindex THEN
      doIt = 1
   ENDIF
   IF doIt = 1 THEN
      bi = barindex - ofs
      $gs[0] = bi
      pivUpd = 0
      // Swing high first, then swing low, both pL bars back.
      // High: above the pL later bars and not below the pL earlier ones
      FOR cand = 0 TO 1 DO
         hasP = 0
         IF bi >= 2 * pL THEN
            IF cand = 0 THEN
               pPrice = high[ofs + pL]
               IF pPrice > hhR[ofs] AND pPrice >= hhR[ofs + pL + 1] THEN
                  hasP = 1
                  pTyp = 1
               ENDIF
            ELSE
               pPrice = low[ofs + pL]
               IF pPrice < llR[ofs] AND pPrice <= llR[ofs + pL + 1] THEN
                  hasP = 1
                  pTyp = -1
               ENDIF
            ENDIF
         ENDIF
         IF hasP = 1 THEN
            nS = $gs[1]
            IF nS = 0 THEN
               $swP[0] = pPrice
               $swB[0] = bi - pL
               $swT[0] = pTyp
               $gs[1] = 1
               pivUpd = 1
            ELSIF pTyp = $swT[nS - 1] THEN
               // Same type as the last swing: it replaces it only if it is more extreme
               moreX = 0
               IF pTyp = 1 AND pPrice > $swP[nS - 1] THEN
                  moreX = 1
               ENDIF
               IF pTyp = -1 AND pPrice < $swP[nS - 1] THEN
                  moreX = 1
               ENDIF
               IF moreX = 1 THEN
                  $swP[nS - 1] = pPrice
                  $swB[nS - 1] = bi - pL
                  pivUpd = 1
               ENDIF
            ELSE
               $swP[nS] = pPrice
               $swB[nS] = bi - pL
               $swT[nS] = pTyp
               $gs[1] = nS + 1
               pivUpd = 1
            ENDIF
         ENDIF
      NEXT

      // ===================== PATTERN RECOGNITION =====================
      // Only when the swing list changed: everything drawn before is cleared
      // and the latest swing points are analysed again
      IF pivUpd = 1 AND $gs[1] >= 5 THEN
         $gs[5] = 0
         $gs[7] = 0
         $gs[9] = 0
         $gs[11] = 0
         s0 = $gs[1] - 5
         p0 = $swP[s0]
         p1 = $swP[s0 + 1]
         p2 = $swP[s0 + 2]
         p3 = $swP[s0 + 3]
         p4 = $swP[s0 + 4]
         t0 = $swT[s0]
         t1 = $swT[s0 + 1]
         t2 = $swT[s0 + 2]
         t3 = $swT[s0 + 3]
         t4 = $swT[s0 + 4]
         // Wave lengths, in price or in percent of the starting point
         IF lengthType = 1 THEN
            w1 = abs(p1 - p0) / max(abs(p0), ticksize) * 100
            w2 = abs(p2 - p1) / max(abs(p1), ticksize) * 100
            w3 = abs(p3 - p2) / max(abs(p2), ticksize) * 100
         ELSE
            w1 = abs(p1 - p0)
            w2 = abs(p2 - p1)
            w3 = abs(p3 - p2)
         ENDIF

         // Impulse in progress: waves 1 to 4 on the last five swing points.
         // Wave 2 retraces wave 1 within the limits and stays above (below) its
         // start, wave 3 goes beyond wave 1 and wave 4 does not overlap wave 1
         validBull = 0
         validBear = 0
         IF t0 = -1 AND t1 = 1 AND t2 = -1 AND t3 = 1 AND t4 = -1 THEN
            IF p2 > p0 AND w2 < w1 * retrace2Max AND w2 >= w1 * retrace2Min AND p3 > p1 AND p4 > p1 THEN
               validBull = 1
            ENDIF
         ENDIF
         IF t0 = 1 AND t1 = -1 AND t2 = 1 AND t3 = -1 AND t4 = 1 THEN
            IF p2 < p0 AND w2 < w1 * retrace2Max AND w2 >= w1 * retrace2Min AND p3 < p1 AND p4 < p1 THEN
               validBear = 1
            ENDIF
         ENDIF
         IF showImpulse = 1 AND (validBull = 1 OR validBear = 1) THEN
            $gs[5] = 1
            $gs[6] = validBull
            FOR k = 0 TO 4 DO
               $impP[k] = $swP[s0 + k]
               $impB[k] = $swB[s0 + k]
            NEXT
            IF showProjections = 1 AND inProgress = 1 THEN
               IF validBull = 1 THEN
                  proj5 = p4 + w1 * wave5Extension
               ELSE
                  proj5 = p4 - w1 * wave5Extension
               ENDIF
               $gs[7] = 1
               $gs[8] = proj5
               $gs[3] = 1
               $gs[4] = proj5
            ENDIF
            IF validBull = 1 THEN
               $gs[2] = 1
            ELSE
               $gs[2] = 2
            ENDIF
         ENDIF

         // Corrective A-B-C zigzag on the last four swing points: wave B is
         // shorter than wave A and wave C goes beyond the end of wave A
         IF showZigzag = 1 THEN
            bullZ = 0
            bearZ = 0
            IF t1 = 1 AND t2 = -1 AND t3 = 1 AND t4 = -1 AND w3 < w2 AND p4 < p2 THEN
               bullZ = 1
            ENDIF
            IF t1 = -1 AND t2 = 1 AND t3 = -1 AND t4 = 1 AND w3 < w2 AND p4 > p2 THEN
               bearZ = 1
            ENDIF
            IF bullZ = 1 OR bearZ = 1 THEN
               $gs[9] = 1
               $gs[10] = bullZ
               FOR k = 0 TO 3 DO
                  $zzP[k] = $swP[s0 + 1 + k]
                  $zzB[k] = $swB[s0 + 1 + k]
               NEXT
               IF showProjections = 1 AND inProgress = 1 THEN
                  IF bullZ = 1 THEN
                     projC = p3 - w2 * waveCExtension
                  ELSE
                     projC = p3 + w2 * waveCExtension
                  ENDIF
                  $gs[11] = 1
                  $gs[12] = projC
                  $gs[3] = 1
                  $gs[4] = projC
               ENDIF
               IF bullZ = 1 THEN
                  $gs[2] = 3
               ELSE
                  $gs[2] = 4
               ENDIF
            ENDIF
         ENDIF
      ENDIF
   ENDIF
NEXT

// ===================== DRAWING =====================
// DRAWTEXT centres the text on its point: the wave labels go half an ATR above
// a swing high or below a swing low, and the projection labels a few bars to
// the right of the end of the projection
lblOff = averagetruerange[14](close) * 0.5
IF islastbarupdate THEN
   // Impulse: waves (1) to (4) and the projection of wave 5
   IF $gs[5] = 1 THEN
      IF $gs[6] = 1 THEN
         cR = impR
         cG = impG
         cB = impB
      ELSE
         cR = bearR
         cG = bearG
         cB = bearB
      ENDIF
      FOR k = 1 TO 4 DO
         xA = $impB[k - 1]
         yA = $impP[k - 1]
         xB = $impB[k]
         yB = $impP[k]
         IF lwV = 1 THEN
            DRAWSEGMENT(xA, yA, xB, yB) COLOURED(cR, cG, cB) STYLE(line, 1)
         ELSIF lwV = 2 THEN
            DRAWSEGMENT(xA, yA, xB, yB) COLOURED(cR, cG, cB) STYLE(line, 2)
         ELSIF lwV = 3 THEN
            DRAWSEGMENT(xA, yA, xB, yB) COLOURED(cR, cG, cB) STYLE(line, 3)
         ELSE
            DRAWSEGMENT(xA, yA, xB, yB) COLOURED(cR, cG, cB) STYLE(line, 4)
         ENDIF
         // Label above a swing high, below a swing low
         isHigh = 0
         IF ($gs[6] = 1 AND (k = 1 OR k = 3)) OR ($gs[6] = 0 AND (k = 2 OR k = 4)) THEN
            isHigh = 1
         ENDIF
         IF isHigh = 1 THEN
            IF k = 1 THEN
               DRAWTEXT("(1)", xB, yB + lblOff, sansserif, standard, 12) COLOURED(cR, cG, cB)
            ELSIF k = 2 THEN
               DRAWTEXT("(2)", xB, yB + lblOff, sansserif, standard, 12) COLOURED(cR, cG, cB)
            ELSIF k = 3 THEN
               DRAWTEXT("(3)", xB, yB + lblOff, sansserif, standard, 12) COLOURED(cR, cG, cB)
            ELSE
               DRAWTEXT("(4)", xB, yB + lblOff, sansserif, standard, 12) COLOURED(cR, cG, cB)
            ENDIF
         ELSE
            IF k = 1 THEN
               DRAWTEXT("(1)", xB, yB - lblOff, sansserif, standard, 12) COLOURED(cR, cG, cB)
            ELSIF k = 2 THEN
               DRAWTEXT("(2)", xB, yB - lblOff, sansserif, standard, 12) COLOURED(cR, cG, cB)
            ELSIF k = 3 THEN
               DRAWTEXT("(3)", xB, yB - lblOff, sansserif, standard, 12) COLOURED(cR, cG, cB)
            ELSE
               DRAWTEXT("(4)", xB, yB - lblOff, sansserif, standard, 12) COLOURED(cR, cG, cB)
            ENDIF
         ENDIF
      NEXT
      IF $gs[7] = 1 THEN
         xA = $impB[4]
         yA = $impP[4]
         xB = xA + projGap
         yB = $gs[8]
         DRAWSEGMENT(xA, yA, xB, yB) COLOURED(proR, proG, proB) STYLE(dottedline2, 2)
         DRAWTEXT("(5) Projection", xB + 7, yB, sansserif, standard, 10) COLOURED(proR, proG, proB)
      ENDIF
   ENDIF

   // Corrective zigzag: waves (a), (b), (c) and the projection of wave C
   IF $gs[9] = 1 THEN
      IF $gs[10] = 1 THEN
         cR = corR
         cG = corG
         cB = corB
      ELSE
         cR = bearR
         cG = bearG
         cB = bearB
      ENDIF
      FOR k = 1 TO 3 DO
         xA = $zzB[k - 1]
         yA = $zzP[k - 1]
         xB = $zzB[k]
         yB = $zzP[k]
         IF lwV = 1 THEN
            DRAWSEGMENT(xA, yA, xB, yB) COLOURED(cR, cG, cB) STYLE(line, 1)
         ELSIF lwV = 2 THEN
            DRAWSEGMENT(xA, yA, xB, yB) COLOURED(cR, cG, cB) STYLE(line, 2)
         ELSIF lwV = 3 THEN
            DRAWSEGMENT(xA, yA, xB, yB) COLOURED(cR, cG, cB) STYLE(line, 3)
         ELSE
            DRAWSEGMENT(xA, yA, xB, yB) COLOURED(cR, cG, cB) STYLE(line, 4)
         ENDIF
         isHigh = 0
         IF ($gs[10] = 1 AND k = 2) OR ($gs[10] = 0 AND (k = 1 OR k = 3)) THEN
            isHigh = 1
         ENDIF
         IF isHigh = 1 THEN
            IF k = 1 THEN
               DRAWTEXT("(a)", xB, yB + lblOff, sansserif, standard, 12) COLOURED(cR, cG, cB)
            ELSIF k = 2 THEN
               DRAWTEXT("(b)", xB, yB + lblOff, sansserif, standard, 12) COLOURED(cR, cG, cB)
            ELSE
               DRAWTEXT("(c)", xB, yB + lblOff, sansserif, standard, 12) COLOURED(cR, cG, cB)
            ENDIF
         ELSE
            IF k = 1 THEN
               DRAWTEXT("(a)", xB, yB - lblOff, sansserif, standard, 12) COLOURED(cR, cG, cB)
            ELSIF k = 2 THEN
               DRAWTEXT("(b)", xB, yB - lblOff, sansserif, standard, 12) COLOURED(cR, cG, cB)
            ELSE
               DRAWTEXT("(c)", xB, yB - lblOff, sansserif, standard, 12) COLOURED(cR, cG, cB)
            ENDIF
         ENDIF
      NEXT
      IF $gs[11] = 1 THEN
         xA = $zzB[3]
         yA = $zzP[3]
         xB = xA + projGap
         yB = $gs[12]
         DRAWSEGMENT(xA, yA, xB, yB) COLOURED(proR, proG, proB) STYLE(dottedline2, 2)
         DRAWTEXT("C Projection", xB + 6, yB, sansserif, standard, 10) COLOURED(proR, proG, proB)
      ENDIF
   ENDIF

   // ===================== STATUS PANEL =====================
   // Swing points on the last bar: the confirmed list plus the swing point
   // the bar in progress would add (at most 150)
   nSw = $gs[1]
   lastTy = 0
   IF nSw > 0 THEN
      lastTy = $swT[nSw - 1]
   ENDIF
   IF barindex >= 2 * pL THEN
      IF high[pL] > hhR AND high[pL] >= hhR[pL + 1] AND lastTy <> 1 THEN
         nSw = nSw + 1
         lastTy = 1
      ENDIF
      IF low[pL] < llR AND low[pL] <= llR[pL + 1] AND lastTy <> -1 THEN
         nSw = nSw + 1
      ENDIF
   ENDIF
   nSw = min(nSw, 150)

   patCode = $gs[2]
   IF patCode = 0 THEN
      patLen = 18
   ELSIF patCode = 1 OR patCode = 2 THEN
      patLen = 26
   ELSE
      patLen = 25
   ENDIF
   projOk = $gs[3]
   projV = round($gs[4] / ticksize) * ticksize

   // Geometry in pixels from the top right corner of the chart
   chW = 6.2
   rowH = 18
   col0W = 16 * chW + 14
   col1W = max(patLen, 12) * chW + 14
   pRight = -85
   pTop = -12
   x1R = pRight
   x1L = pRight - col1W
   x0R = x1L - 1
   x0L = x0R - col0W
   cx0 = (x0L + x0R) / 2
   cx1 = (x1L + x1R) / 2
   FOR rw = 0 TO 3 DO
      yT = pTop - rw * (rowH + 1)
      yD = yT - rowH
      IF rw = 0 THEN
         DRAWRECTANGLE(x0L, yT, x0R, yD) ANCHOR(topright, xshift, yshift) COLOURED(25, 45, 85, 255) FILLCOLOR(25, 45, 85, 255)
         DRAWRECTANGLE(x1L, yT, x1R, yD) ANCHOR(topright, xshift, yshift) COLOURED(25, 45, 85, 255) FILLCOLOR(25, 45, 85, 255)
      ELSE
         DRAWRECTANGLE(x0L, yT, x0R, yD) ANCHOR(topright, xshift, yshift) COLOURED(49, 53, 64, 255) FILLCOLOR(49, 53, 64, 255)
         DRAWRECTANGLE(x1L, yT, x1R, yD) ANCHOR(topright, xshift, yshift) COLOURED(49, 53, 64, 255) FILLCOLOR(49, 53, 64, 255)
      ENDIF
   NEXT
   yM = pTop - rowH / 2
   DRAWTEXT("ELLIOTT WAVE PRO", cx0, yM, monospaced, bold, 10) ANCHOR(topright, xshift, yshift) COLOURED(255, 255, 255)
   DRAWTEXT("JPT", cx1, yM, monospaced, bold, 10) ANCHOR(topright, xshift, yshift) COLOURED(255, 255, 255)
   yM = yM - rowH - 1
   DRAWTEXT("Pattern", cx0, yM, monospaced, bold, 10) ANCHOR(topright, xshift, yshift) COLOURED(255, 255, 255)
   IF patCode = 1 THEN
      DRAWTEXT("Bullish impulse developing", cx1, yM, monospaced, bold, 10) ANCHOR(topright, xshift, yshift) COLOURED(255, 255, 255)
   ELSIF patCode = 2 THEN
      DRAWTEXT("Bearish impulse developing", cx1, yM, monospaced, bold, 10) ANCHOR(topright, xshift, yshift) COLOURED(255, 255, 255)
   ELSIF patCode = 3 THEN
      DRAWTEXT("Bullish corrective zigzag", cx1, yM, monospaced, bold, 10) ANCHOR(topright, xshift, yshift) COLOURED(255, 255, 255)
   ELSIF patCode = 4 THEN
      DRAWTEXT("Bearish corrective zigzag", cx1, yM, monospaced, bold, 10) ANCHOR(topright, xshift, yshift) COLOURED(255, 255, 255)
   ELSE
      DRAWTEXT("Waiting for pivots", cx1, yM, monospaced, bold, 10) ANCHOR(topright, xshift, yshift) COLOURED(255, 255, 255)
   ENDIF
   yM = yM - rowH - 1
   DRAWTEXT("Swing Points", cx0, yM, monospaced, bold, 10) ANCHOR(topright, xshift, yshift) COLOURED(255, 255, 255)
   DRAWTEXT("#nSw#", cx1, yM, monospaced, bold, 10) ANCHOR(topright, xshift, yshift) COLOURED(255, 255, 255)
   yM = yM - rowH - 1
   DRAWTEXT("Projection", cx0, yM, monospaced, bold, 10) ANCHOR(topright, xshift, yshift) COLOURED(255, 255, 255)
   IF projOk = 1 THEN
      DRAWTEXT("#projV#", cx1, yM, monospaced, bold, 10) ANCHOR(topright, xshift, yshift) COLOURED(255, 255, 255)
   ELSE
      DRAWTEXT("N/A", cx1, yM, monospaced, bold, 10) ANCHOR(topright, xshift, yshift) COLOURED(255, 255, 255)
   ENDIF
ENDIF

RETURN