Fibonacci Gravity Clusters
Introduction
Draw a Fibonacci retracement on a chart and you get five or six horizontal lines. Draw a second one on a different swing and you get five or six more. Do it on every swing you can see and the chart turns into a grid where every price is a Fibonacci level of something. At that point the tool has stopped telling you anything: if everything is a level, nothing is.
The interesting question was never “is this price a 0.618 of some swing”. It is “how many retracements, from swings of how many different sizes, land within a few ticks of each other”. A price where a 3-bar pullback, a 55-bar correction and a 377-bar leg all project a retracement is a different animal from a price that happens to be the 0.5 of one random swing.
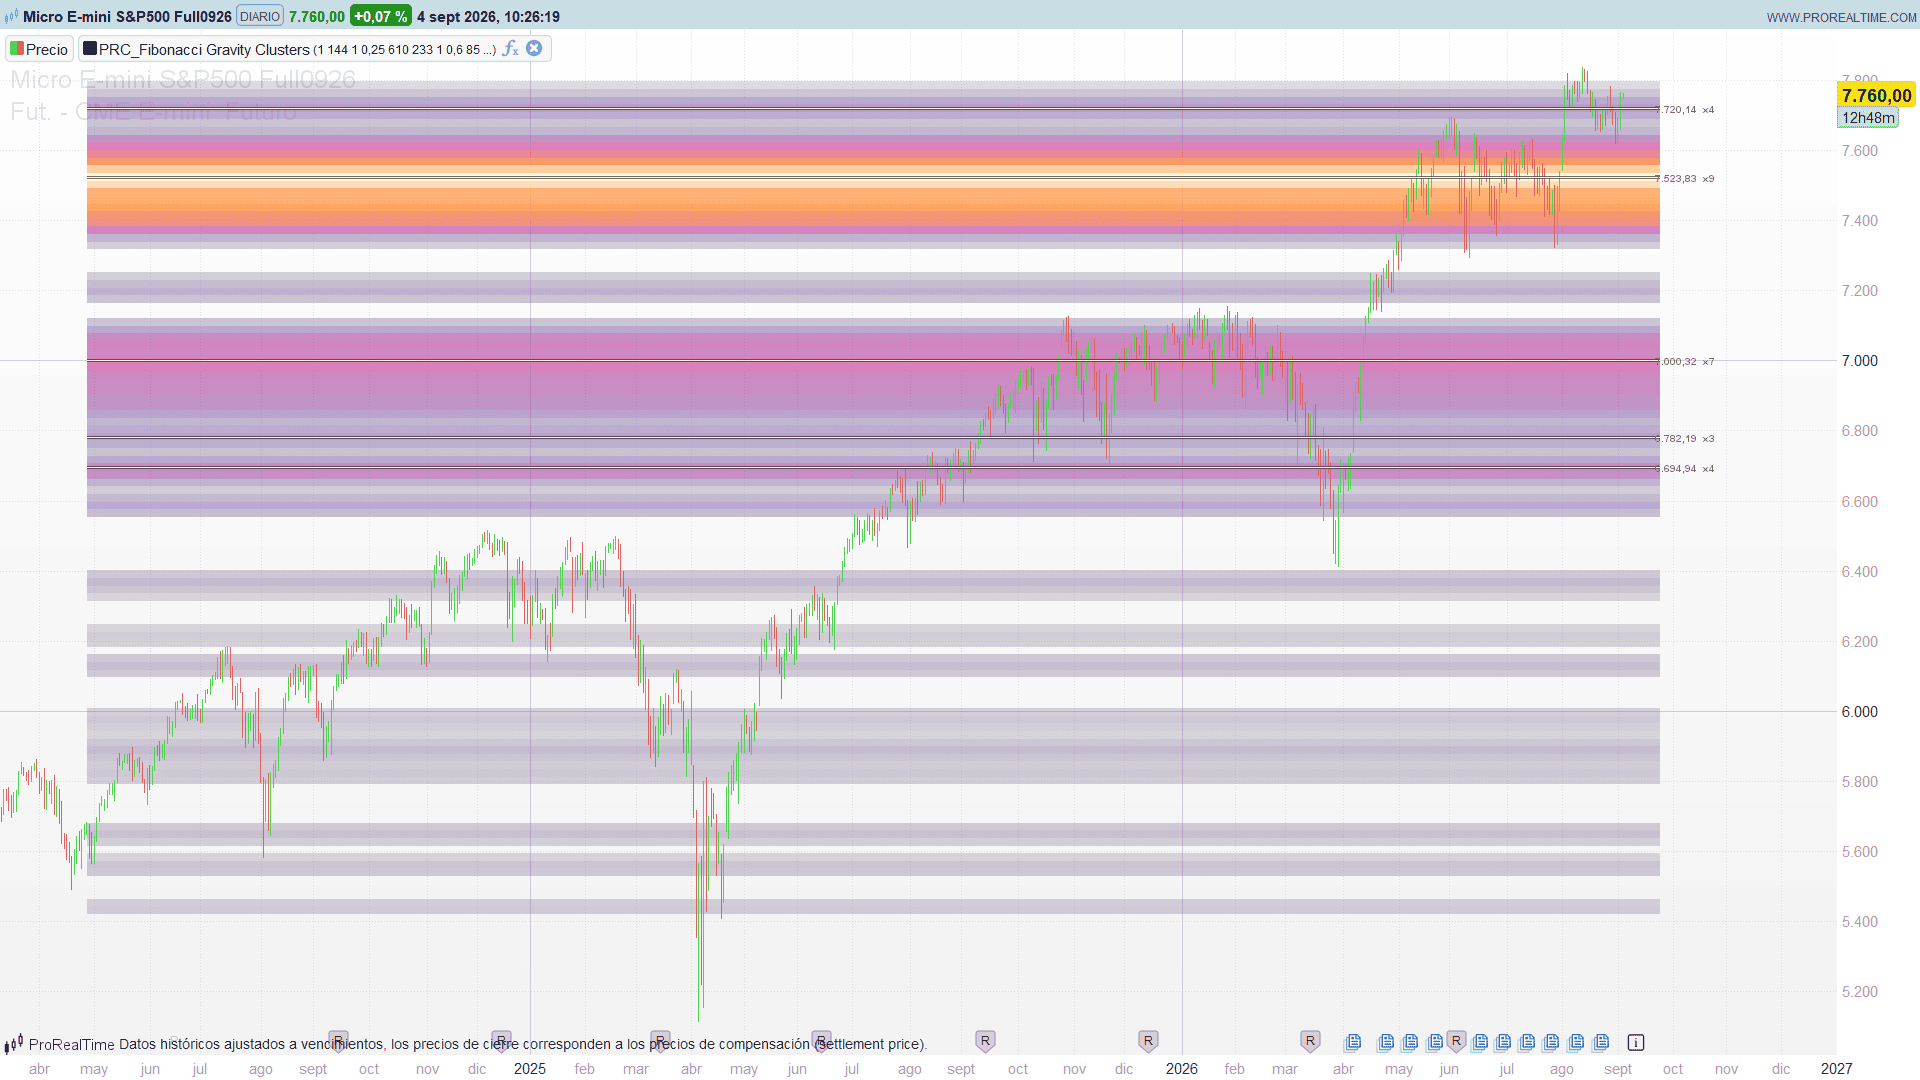
Fibonacci Gravity Clusters answers that question and refuses to draw the lines. It runs six independent ZigZags at pivot lengths 3, 8, 21, 55, 144 and 377, projects the retracement ratios of every confirmed leg onto one shared price grid, and paints the result as a heat field. Bands glow where many projections stack up. Where a single retracement sits alone, you get nothing.
The output is a map, not a signal.
Six Swings, Not One
Each of the six degrees keeps its own ZigZag state and its own rolling buffer of the last 13 confirmed legs. A leg is a pair of alternating pivots: a confirmed high followed by a confirmed low, or the other way round.
The ZigZag rule matters more than it looks. When two pivots of the same kind arrive in a row – two highs, no low in between – the engine does not create a second leg. It keeps the more extreme of the two and rewrites the leg that ends there, moving its B point. If stretching the leg makes it fail the minimum size filter, the leg is removed from the buffer entirely. That is what stops a choppy market from filling the buffer with a dozen near-identical micro-legs of the same move.
A pivot is confirmed the classic way: it has to be the strict extreme of its own window, length bars either side. Nothing is drawn or counted until that window has closed, so a level appears once and never moves again.
Each leg also stores its own size, measured in ATR. That number becomes its weight.
The Field
This is the part that makes the indicator worth having.
The visible price range is divided into bins whose height is a fraction of ATR – a quarter by default. Then, for every leg of every degree, for every enabled ratio, the retracement level is computed and dropped into its bin with a weight:
- size, the leg’s span in ATR, capped at 8 and raised to an exponent. A 4-ATR swing carries four times the weight of a 1-ATR swing at the default exponent of 1.
- age, a half-life decay on the bar where the leg ended. With a half-life of 144 bars, a leg whose extreme is 144 bars old contributes half of what a fresh one would.
- golden pocket, an optional multiplier of 1.618 on 0.618 and 0.65.
The weight is not dumped into a single bin. It is spread with a gaussian kernel across the neighbouring bins, three either side at the default width. Two levels that land one bin apart therefore reinforce each other instead of drawing two separate lines, which is exactly the behaviour you want: “almost the same price” should count as agreement, not as two facts.
Once every leg has been deposited, the field is normalised by its own maximum and painted. Opacity follows heat raised to a gamma below 1, which lifts the mid-range so the structure of the field is visible rather than one blinding band on a black background.
The Core Lines
A heat field is nice to look at and hard to trade off. So the top of the field is extracted explicitly: the K strongest strict local maxima – bins higher than both of their neighbours – subject to a minimum separation so the five lines do not all land on the same peak.
Each one gets a horizontal line and a label with its price and a count: how many raw retracement levels fell in that exact bin. That count is worth reading with care. It is not what decides the colour, because the colour comes from the smoothed field, and a bin can glow on the strength of its neighbours. When the count is high and the band is bright, the two agree and the level is real. When a core line is labelled with a 1, the peak is being carried by the kernel and not by an actual pile-up.
Contact
The band the current close is sitting in is checked on every bar. If its heat is above the flash threshold, that band is repainted at full opacity and a marker is dropped on the close. It is a deliberately small piece of the indicator – it does not predict anything, it tells you that price is currently inside a zone the field considers dense, which is the moment where the map becomes actionable.
The ZigZag Overlay and the Live Leg
Two optional layers, both off by default.
The ZigZag overlay draws the actual legs each degree is feeding into the field, one colour per degree. It is the debugging view: if the field looks wrong, this shows you which swings produced it. Turn it on once to understand what the six degrees are doing on your instrument, then turn it off.
The live leg projects the ratios of the swing that has not finished yet – the extreme reached since the last confirmed pivot. It repaints by definition, because the swing is still moving, and it is drawn dashed with a “forming” label to make that obvious. It is not part of the field and never contributes weight to it.
What You See on the Chart
- A vertical stack of coloured bands covering the lookback window, dark where nothing lands and bright where retracements pile up.
- Up to five horizontal lines on the peaks of that field, each labelled with its price and its hit count.
- One highlighted band plus a dot on the close when price is inside a dense zone.
- Optionally, the ZigZag of each degree, and the dashed projection of the swing in progress.
Nothing appears on a bar it could not have appeared on. The engine reads only closed bars, so the field you see today over a given candle is the field that was there when that candle closed.
The Code
//----------------------------------------------
//PRC_Fibonacci Gravity Clusters
//version = 1
//03.09.2026
//Ivan Gonzalez @ www.prorealcode.com
//Concept and design: GBB
//Sharing ProRealTime knowledge
//----------------------------------------------
// Overlay indicator. Fibonacci retracement confluence rendered as a thermal
// heat field. Six independent ZigZag degrees (3 / 8 / 21 / 55 / 144 / 377)
// each keep a rolling buffer of confirmed legs; every leg projects its
// retracement ratios onto a common price grid, each level weighted by leg
// size in ATR and decayed by age. Overlapping levels add up, so the bands
// that glow are the ones where MANY swings of DIFFERENT degrees agree.
//
// Engine runs on CLOSED bars only: every input is read with an offset of at
// least one bar, so the state is identical on every tick of the forming
// candle and the indicator never repaints its levels.
//----------------------------------------------
defparam drawonlastbaronly = true
//----------------------------------------------
// === 1. SWING DEGREES ===
//----------------------------------------------
use1 = 1 // 1 = degree active
len1 = 3 // pivot length, degree 1
use2 = 1
len2 = 8
use3 = 1
len3 = 21
use4 = 1
len4 = 55
use5 = 1
len5 = 144
use6 = 1
len6 = 377
maxLegs = 13 // legs kept per degree
minSizeAtr = 0.5 // a leg smaller than this many ATR is discarded
//----------------------------------------------
// === 2. RATIOS ===
//----------------------------------------------
useR236 = 1
useR382 = 1
useR500 = 1
useR618 = 1
useR786 = 1
useR886 = 0
golden = 0 // 1 = adds 0.65 and weights 0.618 / 0.65 by 1.618
//----------------------------------------------
// === 3. HEAT MODEL ===
//----------------------------------------------
alphaExp = 1.0 // size exponent: how much a big leg outweighs a small one
halfLife = 144 // bars for a leg to lose half of its weight
sigmaBins = 1.0 // gaussian kernel width, in bins
binFactor = 0.25 // bin height as a multiple of ATR
lookbackN = 610 // price window the field covers
binCap = 233 // hard ceiling on bins (lower it if drawing feels heavy)
//----------------------------------------------
// === 4. RENDERING ===
//----------------------------------------------
paletteId = 3 // 1 Thermal 2 Ember 3 Ice 4 Mono
gammaExp = 0.6 // opacity curve: below 1 lifts the cold half of the field
maxOpac = 85 // opacity of the hottest band, in %
minHeat = 0.05 // bins below this are not drawn
topK = 5 // core lines on the K hottest peaks
minSep = 3 // minimum bin distance between two core lines
extRight = 15 // bars the field is projected to the right
priceDec = 2 // decimals shown on the core line labels
zzShow = 0 // 1 = draw the ZigZag of every degree
flashOn = 1 // 1 = highlight the band the price is sitting in
flashThr = 0.5 // heat needed for that highlight
//----------------------------------------------
// === 5. LIVE LEG (provisional, repaints by design) ===
//----------------------------------------------
liveShow = 0 // 1 = project the ratios of the leg still forming
//----------------------------------------------
// === 6. STYLE ===
//----------------------------------------------
coreR = 255 // core line, bright core
coreG = 244
coreB = 214
haloR = 40 // dark outline drawn UNDER the core line and the contact dot.
haloG = 40 // A pale line is invisible on a light chart background; the
haloB = 40 // outline makes it read on both. haloA = 0 disables it and
haloA = 170 // leaves the single pale line of a dark-background chart.
textR = 120 // core line and live leg labels
textG = 120
textB = 120
liveR = 0 // live leg
liveG = 229
liveB = 255
atrLen = 144 // ATR used for leg size and bin height
//----------------------------------------------
// === DERIVED CONSTANTS ===
//----------------------------------------------
// Ring capacity mirrors the original: the buffer holds maxLegs + 1 entries and
// consumers skip the oldest one when it is full, so a tail pop after a same
// kind pivot leaves exactly the same window as a fresh batch would.
capN = maxLegs + 1
// One spare slot on top of that: the ring is written on the live bar, and a
// slot that is never inside the reading window cannot be read as valid data.
ringN = maxLegs + 2
//----------------------------------------------
// === NATIVE SERIES (assigned on EVERY bar so they keep their history) ===
//----------------------------------------------
atrS = averagetruerange[atrLen](close)
wLoS = lowest[lookbackN](low)
wHiS = highest[lookbackN](high)
// Rolling extremes feeding the pivot test of each degree.
hh1 = highest[len1](high)
ll1 = lowest[len1](low)
hh2 = highest[len2](high)
ll2 = lowest[len2](low)
hh3 = highest[len3](high)
ll3 = lowest[len3](low)
hh4 = highest[len4](high)
ll4 = lowest[len4](low)
hh5 = highest[len5](high)
ll5 = lowest[len5](low)
hh6 = highest[len6](high)
ll6 = lowest[len6](low)
$useD[0] = use1
$useD[1] = use2
$useD[2] = use3
$useD[3] = use4
$useD[4] = use5
$useD[5] = use6
//----------------------------------------------
// === RESEED ON THE FIRST BAR ===
// Arrays are global state and survive a reload; without this the one-pass
// guard would block the whole recalculation and the indicator would come out
// blank.
//----------------------------------------------
if barindex = 0 then
$gBar[0] = 0 - 1
for degI = 0 to 5 do
$sKind[degI] = 0
$sHasA[degI] = 0
$sInBuf[degI] = 0
$sHead[degI] = 0
$sCnt[degI] = 0
next
endif
//----------------------------------------------
// === SWING ENGINE - ONE PASS PER BAR ===
// Everything below reads bars with offset >= 1, so each tick of the forming
// candle would compute exactly the same thing. The guard makes that explicit
// and saves the work.
//----------------------------------------------
if barindex > $gBar[0] then
$gBar[0] = barindex
//-------------------------------------------
// Pivot detection, one block per degree.
// The pivot sits at barindex - len - 1. hhN[1] covers the len bars AFTER
// it (all closed) and hhN[len+2] the len bars BEFORE it, so the test is
// "strict extreme of its 2*len+1 window" without a single live reading.
//-------------------------------------------
$pvOn[0] = 0
if use1 = 1 and barindex >= 2 * len1 + 2 then
$pvOn[0] = 1
$pvBar[0] = barindex - len1 - 1
$pvAok[0] = 0
$pvAtr[0] = 0
if barindex >= atrLen + len1 + 1 then
$pvAok[0] = 1
$pvAtr[0] = atrS[len1 + 1]
endif
$pvHok[0] = 0
phv = high[len1 + 1]
if phv > hh1[1] and phv > hh1[len1 + 2] then
$pvHok[0] = 1
$pvH[0] = phv
endif
$pvLok[0] = 0
plv = low[len1 + 1]
if plv < ll1[1] and plv < ll1[len1 + 2] then
$pvLok[0] = 1
$pvL[0] = plv
endif
endif
$pvOn[1] = 0
if use2 = 1 and barindex >= 2 * len2 + 2 then
$pvOn[1] = 1
$pvBar[1] = barindex - len2 - 1
$pvAok[1] = 0
$pvAtr[1] = 0
if barindex >= atrLen + len2 + 1 then
$pvAok[1] = 1
$pvAtr[1] = atrS[len2 + 1]
endif
$pvHok[1] = 0
phv = high[len2 + 1]
if phv > hh2[1] and phv > hh2[len2 + 2] then
$pvHok[1] = 1
$pvH[1] = phv
endif
$pvLok[1] = 0
plv = low[len2 + 1]
if plv < ll2[1] and plv < ll2[len2 + 2] then
$pvLok[1] = 1
$pvL[1] = plv
endif
endif
$pvOn[2] = 0
if use3 = 1 and barindex >= 2 * len3 + 2 then
$pvOn[2] = 1
$pvBar[2] = barindex - len3 - 1
$pvAok[2] = 0
$pvAtr[2] = 0
if barindex >= atrLen + len3 + 1 then
$pvAok[2] = 1
$pvAtr[2] = atrS[len3 + 1]
endif
$pvHok[2] = 0
phv = high[len3 + 1]
if phv > hh3[1] and phv > hh3[len3 + 2] then
$pvHok[2] = 1
$pvH[2] = phv
endif
$pvLok[2] = 0
plv = low[len3 + 1]
if plv < ll3[1] and plv < ll3[len3 + 2] then
$pvLok[2] = 1
$pvL[2] = plv
endif
endif
$pvOn[3] = 0
if use4 = 1 and barindex >= 2 * len4 + 2 then
$pvOn[3] = 1
$pvBar[3] = barindex - len4 - 1
$pvAok[3] = 0
$pvAtr[3] = 0
if barindex >= atrLen + len4 + 1 then
$pvAok[3] = 1
$pvAtr[3] = atrS[len4 + 1]
endif
$pvHok[3] = 0
phv = high[len4 + 1]
if phv > hh4[1] and phv > hh4[len4 + 2] then
$pvHok[3] = 1
$pvH[3] = phv
endif
$pvLok[3] = 0
plv = low[len4 + 1]
if plv < ll4[1] and plv < ll4[len4 + 2] then
$pvLok[3] = 1
$pvL[3] = plv
endif
endif
$pvOn[4] = 0
if use5 = 1 and barindex >= 2 * len5 + 2 then
$pvOn[4] = 1
$pvBar[4] = barindex - len5 - 1
$pvAok[4] = 0
$pvAtr[4] = 0
if barindex >= atrLen + len5 + 1 then
$pvAok[4] = 1
$pvAtr[4] = atrS[len5 + 1]
endif
$pvHok[4] = 0
phv = high[len5 + 1]
if phv > hh5[1] and phv > hh5[len5 + 2] then
$pvHok[4] = 1
$pvH[4] = phv
endif
$pvLok[4] = 0
plv = low[len5 + 1]
if plv < ll5[1] and plv < ll5[len5 + 2] then
$pvLok[4] = 1
$pvL[4] = plv
endif
endif
$pvOn[5] = 0
if use6 = 1 and barindex >= 2 * len6 + 2 then
$pvOn[5] = 1
$pvBar[5] = barindex - len6 - 1
$pvAok[5] = 0
$pvAtr[5] = 0
if barindex >= atrLen + len6 + 1 then
$pvAok[5] = 1
$pvAtr[5] = atrS[len6 + 1]
endif
$pvHok[5] = 0
phv = high[len6 + 1]
if phv > hh6[1] and phv > hh6[len6 + 2] then
$pvHok[5] = 1
$pvH[5] = phv
endif
$pvLok[5] = 0
plv = low[len6 + 1]
if plv < ll6[1] and plv < ll6[len6 + 2] then
$pvLok[5] = 1
$pvL[5] = plv
endif
endif
//-------------------------------------------
// ZigZag state machine, shared by the six degrees.
//-------------------------------------------
for degI = 0 to 5 do
if $pvOn[degI] = 1 then
// A single bar can be the strict high AND the strict low of its own
// window (outside bar). When that happens the kind that alternates
// with the previous pivot is fed first, exactly as in the original.
nEv = 0
if $pvHok[degI] = 1 and $pvLok[degI] = 1 then
nEv = 2
if $sKind[degI] = 1 then
$evK[1] = 0 - 1
$evP[1] = $pvL[degI]
$evK[2] = 1
$evP[2] = $pvH[degI]
else
$evK[1] = 1
$evP[1] = $pvH[degI]
$evK[2] = 0 - 1
$evP[2] = $pvL[degI]
endif
elsif $pvHok[degI] = 1 then
nEv = 1
$evK[1] = 1
$evP[1] = $pvH[degI]
elsif $pvLok[degI] = 1 then
nEv = 1
$evK[1] = 0 - 1
$evP[1] = $pvL[degI]
endif
if nEv > 0 then
baseI = degI * ringN
evBar = $pvBar[degI]
evAtr = $pvAtr[degI]
evAok = $pvAok[degI]
for evI = 1 to nEv do
evKind = $evK[evI]
evPx = $evP[evI]
if $sKind[degI] = 0 then
// First pivot of the degree: nothing to pair it with yet.
$sKind[degI] = evKind
$sPx[degI] = evPx
$sBar[degI] = evBar
$sHasA[degI] = 0
elsif $sKind[degI] = evKind then
// Same kind in a row: the ZigZag keeps the more extreme one
// and the leg that ends on it has to be recomputed in place.
isBetter = 0
if evKind = 1 then
if evPx > $sPx[degI] then
isBetter = 1
endif
else
if evPx < $sPx[degI] then
isBetter = 1
endif
endif
if isBetter = 1 then
$sPx[degI] = evPx
$sBar[degI] = evBar
if $sHasA[degI] = 1 then
szOk = 0
szV = 0
if evAok = 1 and evAtr > 0 then
szV = abs($sPx[degI] - $sAx[degI]) / evAtr
if szV >= minSizeAtr then
szOk = 1
endif
endif
if $sInBuf[degI] = 1 then
if szOk = 1 then
// rewrite the tail leg
wSlot = baseI + (($sHead[degI] + $sCnt[degI] - 1) mod ringN)
$lgA[wSlot] = $sAx[degI]
$lgB[wSlot] = $sPx[degI]
$lgBar[wSlot] = $sBar[degI]
$lgABar[wSlot] = $sABar[degI]
$lgSz[wSlot] = szV
else
// the stretched leg no longer passes the size
// filter: drop it
$sCnt[degI] = $sCnt[degI] - 1
$sInBuf[degI] = 0
endif
elsif szOk = 1 then
// it did not pass before but it does now
wSlot = baseI + (($sHead[degI] + $sCnt[degI]) mod ringN)
$lgA[wSlot] = $sAx[degI]
$lgB[wSlot] = $sPx[degI]
$lgBar[wSlot] = $sBar[degI]
$lgABar[wSlot] = $sABar[degI]
$lgSz[wSlot] = szV
$sCnt[degI] = $sCnt[degI] + 1
if $sCnt[degI] > capN then
$sHead[degI] = ($sHead[degI] + 1) mod ringN
$sCnt[degI] = capN
endif
$sInBuf[degI] = 1
endif
endif
endif
else
// Opposite kind: the previous pivot becomes A and a new leg
// A -> B is born.
$sAx[degI] = $sPx[degI]
$sABar[degI] = $sBar[degI]
$sHasA[degI] = 1
$sKind[degI] = evKind
$sPx[degI] = evPx
$sBar[degI] = evBar
szOk = 0
szV = 0
if evAok = 1 and evAtr > 0 then
szV = abs(evPx - $sAx[degI]) / evAtr
if szV >= minSizeAtr then
szOk = 1
endif
endif
if szOk = 1 then
wSlot = baseI + (($sHead[degI] + $sCnt[degI]) mod ringN)
$lgA[wSlot] = $sAx[degI]
$lgB[wSlot] = evPx
$lgBar[wSlot] = evBar
$lgABar[wSlot] = $sABar[degI]
$lgSz[wSlot] = szV
$sCnt[degI] = $sCnt[degI] + 1
if $sCnt[degI] > capN then
$sHead[degI] = ($sHead[degI] + 1) mod ringN
$sCnt[degI] = capN
endif
$sInBuf[degI] = 1
else
$sInBuf[degI] = 0
endif
endif
next
endif
endif
next
endif
//----------------------------------------------
// === FIELD AND RENDERING - LAST BAR ONLY ===
//----------------------------------------------
if islastbarupdate then
//-------------------------------------------
// Palette stops (five colours, linearly interpolated)
//-------------------------------------------
if paletteId = 2 then
// Ember
$palR[0] = 26
$palG[0] = 8
$palB[0] = 0
$palR[1] = 92
$palG[1] = 30
$palB[1] = 0
$palR[2] = 163
$palG[2] = 68
$palB[2] = 0
$palR[3] = 232
$palG[3] = 126
$palB[3] = 28
$palR[4] = 255
$palG[4] = 217
$palB[4] = 160
elsif paletteId = 3 then
// Ice
$palR[0] = 6
$palG[0] = 26
$palB[0] = 31
$palR[1] = 14
$palG[1] = 95
$palB[1] = 110
$palR[2] = 25
$palG[2] = 178
$palB[2] = 196
$palR[3] = 127
$palG[3] = 232
$palB[3] = 242
$palR[4] = 234
$palG[4] = 255
$palB[4] = 255
elsif paletteId = 4 then
// Mono
$palR[0] = 16
$palG[0] = 16
$palB[0] = 20
$palR[1] = 58
$palG[1] = 58
$palB[1] = 68
$palR[2] = 113
$palG[2] = 113
$palB[2] = 126
$palR[3] = 171
$palG[3] = 171
$palB[3] = 184
$palR[4] = 242
$palG[4] = 242
$palB[4] = 246
else
// Thermal
$palR[0] = 18
$palG[0] = 6
$palB[0] = 31
$palR[1] = 75
$palG[1] = 26
$palB[1] = 140
$palR[2] = 196
$palG[2] = 30
$palB[2] = 138
$palR[3] = 255
$palG[3] = 122
$palB[3] = 26
$palR[4] = 255
$palG[4] = 244
$palB[4] = 214
endif
//-------------------------------------------
// Ratio table. The golden pocket adds 0.65 and multiplies the weight of
// 0.618 and 0.65 by 1.618.
//-------------------------------------------
gMul = 1.0
if golden = 1 then
gMul = 1.618
endif
nRat = 0
if useR236 = 1 then
$rat[nRat] = 0.236
$ratM[nRat] = 1.0
nRat = nRat + 1
endif
if useR382 = 1 then
$rat[nRat] = 0.382
$ratM[nRat] = 1.0
nRat = nRat + 1
endif
if useR500 = 1 then
$rat[nRat] = 0.5
$ratM[nRat] = 1.0
nRat = nRat + 1
endif
if useR618 = 1 then
$rat[nRat] = 0.618
$ratM[nRat] = gMul
nRat = nRat + 1
endif
if useR786 = 1 then
$rat[nRat] = 0.786
$ratM[nRat] = 1.0
nRat = nRat + 1
endif
if useR886 = 1 then
$rat[nRat] = 0.886
$ratM[nRat] = 1.0
nRat = nRat + 1
endif
if golden = 1 then
$rat[nRat] = 0.65
$ratM[nRat] = 1.618
nRat = nRat + 1
endif
//-------------------------------------------
// Price grid. Padding is added with the PRE-cap bin height and only then
// is the bin count capped, so the covered range never depends on the cap.
//-------------------------------------------
fieldOk = 0
binH = 0
fLo = 0
nBin = 0
if barindex >= atrLen and nRat > 0 then
atrLast = atrS
if atrLast > 0 then
binH = atrLast * binFactor
fLo = wLoS - 2 * binH
fHi = wHiS + 2 * binH
nBin = ceil((fHi - fLo) / binH)
if nBin > binCap then
binH = (fHi - fLo) / binCap
nBin = binCap
endif
if nBin >= 1 then
fieldOk = 1
endif
endif
endif
hasHeat = 0
nZone = 0
if fieldOk = 1 then
// The accumulators are rebuilt from zero on every pass, so a second
// tick on the live bar produces the same field instead of adding to it.
for bIdx = 0 to nBin - 1 do
$heat[bIdx] = 0
$hcnt[bIdx] = 0
next
reachN = floor(3 * sigmaBins + 0.000000001)
twoSig = 2 * sigmaBins * sigmaBins
for degI = 0 to 5 do
cntD = $sCnt[degI]
if cntD > 0 then
// when the buffer is full the oldest entry is the spare one
jStart = 0
if cntD > maxLegs then
jStart = 1
endif
baseI = degI * ringN
for jLeg = jStart to cntD - 1 do
rSlot = baseI + (($sHead[degI] + jLeg) mod ringN)
pxA = $lgA[rSlot]
pxB = $lgB[rSlot]
szL = min(max($lgSz[rSlot], 0), 8)
baseW = pow(szL, alphaExp) * pow(0.5, (barindex - $lgBar[rSlot]) / halfLife)
for kR = 0 to nRat - 1 do
lvlP = pxB - $rat[kR] * (pxB - pxA)
cBin = floor((lvlP - fLo) / binH)
if cBin >= 0 - reachN and cBin <= nBin - 1 + reachN then
wLev = baseW * $ratM[kR]
if cBin >= 0 and cBin < nBin then
$hcnt[cBin] = $hcnt[cBin] + 1
endif
bFrom = max(0, cBin - reachN)
bTo = min(nBin - 1, cBin + reachN)
for bIdx = bFrom to bTo do
dBin = bIdx - cBin
$heat[bIdx] = $heat[bIdx] + wLev * exp(0 - (dBin * dBin) / twoSig)
next
endif
next
next
endif
next
// Normalise over the live bin count only. ArrayMax would also see slots
// left over from a wider field on a previous tick.
hMax = 0
for bIdx = 0 to nBin - 1 do
hMax = max(hMax, $heat[bIdx])
next
if hMax > 0 then
hasHeat = 1
for bIdx = 0 to nBin - 1 do
$heat[bIdx] = $heat[bIdx] / hMax
next
endif
//----------------------------------------
// Top-K strict local maxima, honouring a minimum separation.
//----------------------------------------
if hasHeat = 1 and topK > 0 and nBin >= 3 then
doneK = 0
for kz = 1 to topK do
if doneK = 0 then
bestBin = 0 - 1
bestH = 0 - 1
for bIdx = 1 to nBin - 2 do
hB = $heat[bIdx]
if hB > $heat[bIdx - 1] and hB > $heat[bIdx + 1] and hB > bestH then
okSep = 1
if nZone > 0 then
for qz = 0 to nZone - 1 do
if abs(bIdx - $zone[qz]) < minSep then
okSep = 0
endif
next
endif
if okSep = 1 then
bestBin = bIdx
bestH = hB
endif
endif
next
if bestBin = 0 - 1 then
doneK = 1
else
$zone[nZone] = bestBin
nZone = nZone + 1
endif
endif
next
// sort ascending so the labels read bottom-up
if nZone > 1 then
for qz = 0 to nZone - 2 do
for kz = 0 to nZone - 2 - qz do
if $zone[kz] > $zone[kz + 1] then
swapV = $zone[kz]
$zone[kz] = $zone[kz + 1]
$zone[kz + 1] = swapV
endif
next
next
endif
endif
endif
leftX = max(barindex - lookbackN, 0)
rightX = barindex + extRight
//-------------------------------------------
// The field itself: one band per bin, opacity driven by heat.
//-------------------------------------------
if hasHeat = 1 then
for bIdx = 0 to nBin - 1 do
tHeat = $heat[bIdx]
if tHeat >= minHeat then
posC = min(max(tHeat, 0), 1) * 4
iSt = min(floor(posC), 3)
fSt = posC - iSt
colR = round($palR[iSt] * (1 - fSt) + $palR[iSt + 1] * fSt)
colG = round($palG[iSt] * (1 - fSt) + $palG[iSt + 1] * fSt)
colB = round($palB[iSt] * (1 - fSt) + $palB[iSt + 1] * fSt)
aVal = min(255, max(0, round(255 * maxOpac * pow(tHeat, gammaExp) / 100)))
yTop = fLo + (bIdx + 1) * binH
yBot = fLo + bIdx * binH
drawrectangle(leftX, yTop, rightX, yBot) coloured(colR, colG, colB, 0) fillcolor(colR, colG, colB, aVal)
endif
next
endif
//-------------------------------------------
// Core lines: the hottest peaks, labelled with how many raw retracement
// levels fell inside that exact bin.
//-------------------------------------------
if nZone > 0 then
decMul = pow(10, priceDec)
for qz = 0 to nZone - 1 do
zBin = $zone[qz]
zPx = fLo + (zBin + 0.5) * binH
zShow = round(zPx * decMul) / decMul
zHits = $hcnt[zBin]
if haloA > 0 then
drawsegment(leftX, zPx, rightX, zPx) coloured(haloR, haloG, haloB, haloA) style(line, 3)
endif
drawsegment(leftX, zPx, rightX, zPx) coloured(coreR, coreG, coreB, 255) style(line, 1)
drawtext("#zShow# x#zHits#", rightX + 10, zPx, SansSerif, Bold, 10) coloured(textR, textG, textB, 255)
next
endif
//-------------------------------------------
// ZigZag overlay: the legs each degree is actually feeding to the field.
//-------------------------------------------
if zzShow = 1 then
$zzR[0] = 192
$zzG[0] = 192
$zzB[0] = 192
$zzR[1] = 255
$zzG[1] = 165
$zzB[1] = 0
$zzR[2] = 0
$zzG[2] = 255
$zzB[2] = 255
$zzR[3] = 255
$zzG[3] = 0
$zzB[3] = 255
$zzR[4] = 0
$zzG[4] = 255
$zzB[4] = 0
$zzR[5] = 255
$zzG[5] = 255
$zzB[5] = 0
for degI = 0 to 5 do
cntD = $sCnt[degI]
if cntD > 0 then
jStart = 0
if cntD > maxLegs then
jStart = 1
endif
baseI = degI * ringN
zcR = $zzR[degI]
zcG = $zzG[degI]
zcB = $zzB[degI]
fSlot = baseI + (($sHead[degI] + jStart) mod ringN)
prevX = $lgABar[fSlot]
prevY = $lgA[fSlot]
for jLeg = jStart to cntD - 1 do
rSlot = baseI + (($sHead[degI] + jLeg) mod ringN)
nextX = $lgBar[rSlot]
nextY = $lgB[rSlot]
drawsegment(prevX, prevY, nextX, nextY) coloured(zcR, zcG, zcB, 200)
prevX = nextX
prevY = nextY
next
endif
next
endif
//-------------------------------------------
// Live leg: the swing still forming on the lowest active degree. It moves
// with price by design and is drawn dashed to say so.
//-------------------------------------------
if liveShow = 1 then
liveD = 0 - 1
for degI = 0 to 5 do
if liveD = 0 - 1 and $useD[degI] = 1 then
liveD = degI
endif
next
if liveD >= 0 then
if $sKind[liveD] <> 0 then
pvtX = $sBar[liveD]
pvtY = $sPx[liveD]
backN = barindex - pvtX
hasExt = 0
extV = 0
if backN >= 1 and backN <= 4999 then
if $sKind[liveD] = 1 then
extV = low
for kBar = 0 to backN - 1 do
if low[kBar] < extV then
extV = low[kBar]
endif
next
else
extV = high
for kBar = 0 to backN - 1 do
if high[kBar] > extV then
extV = high[kBar]
endif
next
endif
hasExt = 1
endif
if hasExt = 1 and extV <> pvtY then
for kR = 0 to nRat - 1 do
lvlL = extV - $rat[kR] * (extV - pvtY)
drawsegment(pvtX, lvlL, rightX, lvlL) coloured(liveR, liveG, liveB, 179) style(dottedline, 1)
next
drawtext("forming", rightX + 10, extV, SansSerif, Bold, 10) coloured(textR, textG, textB, 255)
endif
endif
endif
endif
//-------------------------------------------
// Contact flash: the band the close is sitting in, when it is hot enough.
//-------------------------------------------
if flashOn = 1 and hasHeat = 1 then
cbFlash = floor((close - fLo) / binH)
if cbFlash >= 0 and cbFlash < nBin then
if $heat[cbFlash] >= flashThr then
tHeat = $heat[cbFlash]
posC = min(max(tHeat, 0), 1) * 4
iSt = min(floor(posC), 3)
fSt = posC - iSt
colR = round($palR[iSt] * (1 - fSt) + $palR[iSt + 1] * fSt)
colG = round($palG[iSt] * (1 - fSt) + $palG[iSt + 1] * fSt)
colB = round($palB[iSt] * (1 - fSt) + $palB[iSt + 1] * fSt)
aVal = min(255, max(0, round(255 * maxOpac / 100)))
yTop = fLo + (cbFlash + 1) * binH
yBot = fLo + cbFlash * binH
drawrectangle(leftX, yTop, rightX, yBot) coloured(colR, colG, colB, 0) fillcolor(colR, colG, colB, aVal)
if haloA > 0 then
drawpoint(barindex, close, 5) coloured(haloR, haloG, haloB, haloA)
endif
drawpoint(barindex, close, 3) coloured(coreR, coreG, coreB, 255)
endif
endif
endif
endif
// Drawing-only overlay: close with a bare return.
return
The structure is worth a word, because the engine and the rendering are deliberately separated.
The swing engine runs on every bar, inside a single-pass guard. Pivot detection for each degree uses two rolling extremes and no loop at all:
hh1 = highest[len1](high)
phv = high[len1 + 1]
if phv > hh1[1] and phv > hh1[len1 + 2] then
   // confirmed pivot high at barindex - len1 - 1
endif
hh1[1] covers the len1 bars after the pivot, hh1[len1 + 2] the len1 bars before it. Both windows are made of closed candles, which is what makes the whole engine stable on the live bar.
The six degrees share one state machine. Their states live in parallel arrays indexed by degree, and the leg buffers are flattened into the same arrays with base = degree * ringN, so pushLeg, refreshLeg and the pivot logic are written once and run six times inside a for degI = 0 to 5 loop.
The field and everything drawn live in one islastbarupdate block with drawonlastbaronly on. The heat accumulators are zeroed at the top of that block on every pass, so the field is rebuilt from scratch rather than added to.
Settings
- Swing degrees: six on/off switches with their pivot lengths (3, 8, 21, 55, 144, 377),
maxLegsfor how many legs each degree remembers, andminSizeAtrfor the minimum leg span in ATR. RaisingminSizeAtris the cleanest way to make the field stricter. - Ratios: 0.236, 0.382, 0.5, 0.618 and 0.786 on by default; 0.886 off;
goldenadds 0.65 and gives both 0.618 and 0.65 a 1.618 multiplier. - Heat model:
alphaExp(how much a large leg outweighs a small one),halfLife(bars for a leg to lose half its weight),sigmaBins(kernel width),binFactor(bin height as a multiple of ATR) andlookbackN(the price window the field covers). - Rendering:
paletteId(1 Thermal, 2 Ember, 3 Ice, 4 Mono),gammaExp,maxOpac,minHeat(bins below this are not drawn at all),topK,minSep,extRight,priceDec,zzShow,flashOnandflashThr. - binCap caps the number of bands. It is the performance dial: 233 gives the finest field, and lowering it to 120 halves the number of drawing objects with very little visual loss.
- Style:
coreR/G/Bis the bright core of the level lines,textR/G/Bthe colour of their labels, andhaloR/G/BplushaloAa dark outline drawn underneath both the lines and the contact dot. That outline is what keeps a pale line readable on a light chart background; sethaloA = 0if you run a dark chart and want the single bright line.
Insert it on the price chart, not in a separate panel.
Notes and Limitations
Two things are worth knowing before you lean on this.
The half-life quietly favours the short degrees. The decay is applied to the bar where a leg ended, and a long-degree pivot cannot be recent: a degree confirmed with 377 bars either side has its extreme at least 378 bars in the past. At a 144-bar half-life, the freshest possible 377-leg starts at about 16% of the weight of a fresh 3-leg of identical size, before any data is involved. Measured over synthetic series, the three short degrees end up carrying roughly 87% of the total field weight and the three long ones about 13%. If you want the long swings to actually matter, raise halfLife substantially, or disable the short degrees and look at the field they produce on their own. The default settings describe a short-horizon field with long-horizon decoration.
The degrees are nested, not independent. A strict extreme of a wide window is automatically a strict extreme of every narrower one, so every 377-pivot is also a 144-, 55-, 21-, 8- and 3-pivot. The legs differ – they pair different pivots and project different levels – but the underlying turning points are the same set counted at several scales. Read the confluence as “this price is a retracement of the same structure measured several ways”, which is still useful, rather than as six independent votes.
Also worth noting: the field is normalised by its own maximum, so there is always a band at full brightness. That makes fields comparable in shape but not in strength – a chart with 78 legs and a chart with 4 both peak at 1. The hit count on the core lines is the only absolute number on the screen.
One practical note on colour. The palettes run from a near-black low end to a pale high end, which is a dark-chart design: on a white background the cold half of the field reads as grey rather than as cold, and a pale level line would vanish entirely if it were not outlined. The level lines and the contact dot carry that outline by default, so they work either way, but if you switch on the live leg over a light background you will want to darken liveR/G/B too.
The single-degree lookback matters too. With lookbackN at 610 the field covers 610 bars; the legs feeding it can be much older than that, and their levels will simply fall outside the drawn range and disappear from the picture without any warning.
Conclusion
Fibonacci Gravity Clusters is not a retracement tool with extra colours. It is a density estimator over retracement levels, and the difference shows in what it refuses to draw: a lone 0.618 produces nothing visible, while five ratios from five different swing sizes landing within a quarter of an ATR produce a band you cannot miss.
Used as intended – as a map of where the chart’s own geometry is dense, checked against the hit count rather than the colour alone – it does something the classic tool cannot: it tells you which of your Fibonacci levels the rest of the chart agrees with.