






Central Pivot Range, Virgin CPR, Traditional, Camarilla and Fibonacci Pivots
Introduction
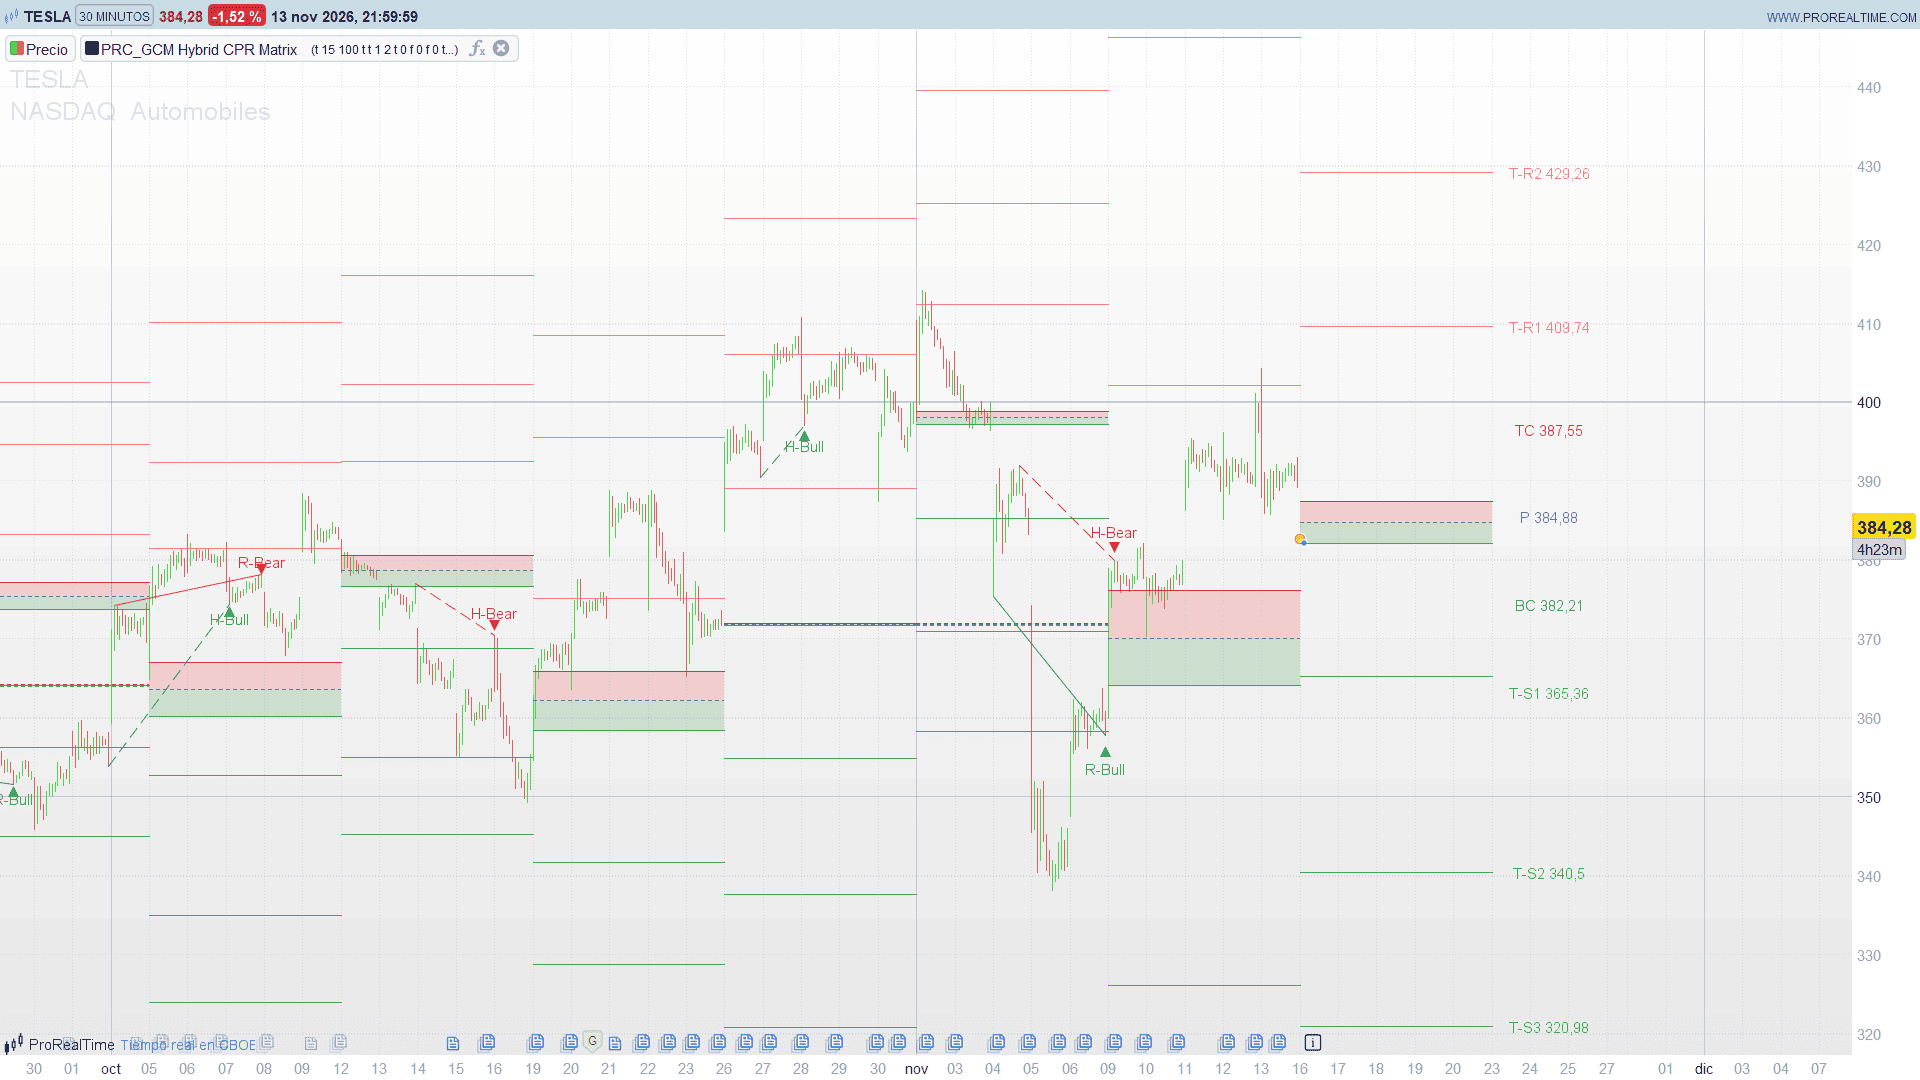
Pivot traders usually end up with several indicators stacked on the same chart: one for the Central Pivot Range, another for the classic floor pivots, a third for Camarilla or Fibonacci levels, and something else to flag divergences when price reaches them. The GCM Hybrid CPR Matrix, by uniGram, brings all of it into a single overlay built around the CPR.
For each daily, weekly or monthly session it draws the central pivot with its top and bottom central levels, extends the previous CPR when it was left untouched, adds up to three families of support and resistance levels, highlights the level that the current bar is touching, projects the levels of the next session once the current one is complete, and marks regular and hidden RSI divergences on price.
Theory Behind the Indicator
Central Pivot Range. From the high, low and close of the previous session: P = (H + L + C) / 3, BC = (H + L) / 2 and TC = 2P – BC. The higher of the last two is drawn as TC and the lower as BC. A narrow CPR points to a balanced previous session and often precedes a trending day; a wide CPR tends to contain price.
Virgin CPR. If the previous session traded entirely above or entirely below its own CPR, that range was never tested. The indicator extends it into the current session as dotted lines with a faint fill, because untested central ranges often act as magnets or as strong support and resistance.
Traditional pivots. R1 = 2P – L, S1 = 2P – H, R2 = P + (H – L), S2 = P – (H – L), R3 = H + 2(P – L), S3 = L – 2(H – P).
Camarilla pivots. Built from the previous close and range: R1 to R4 = C + range x 1.1 / 12, / 6, / 4 and / 2, with the supports mirrored below. The previous close itself is drawn as C-CP.
Fibonacci pivots. P plus and minus 0.382, 0.618 and 1.000 times the previous range.
Smart radar. On the session in progress, a level is “touched” when the range of the last bar comes within a small buffer of it (0.02 % of the level by default). The touched level gets a glow and a label with its name and price next to the last bar.
Forecast. Once the current session is complete, its own high, low and close define the levels of the next one, which are drawn to the right of the last bar.
RSI divergences. Pivots of the RSI (14) and of price, 5 bars on each side. A lower price low with a higher RSI low is a regular bullish divergence; a higher price low with a lower RSI low, a hidden bullish one. The bearish cases mirror them on the highs. The two pivots must be at most 60 bars apart.
Key Features at a Glance
- Daily, weekly or monthly pivots, with the last 15 sessions kept on the chart.
- CPR with TC, P and BC and two filled bands.
- Virgin CPR extended into the current session.
- Traditional (on by default), Camarilla and Fibonacci families, each with its own colours, width and line style, and a switch per level.
- Every level of the newest matrix labelled with its name and price, in one column clear of the candles; labels that would overlap are spread apart.
- Touch radar on the current session: glow plus name and price of the level being tested.
- Next-session levels projected when the session is complete.
- Regular and hidden RSI divergences marked on price, with optional connecting lines.
- Global opacity for lines and labels.
How to Read the Indicator
- Price above TC: bullish bias for the session; TC and P are the first supports. Below BC: bearish bias, with BC and P as resistance. Inside the CPR the session is undecided.
- CPR width: compare it with the previous sessions on the chart. A clearly narrower range than the last few favours a breakout day.
- Dotted VCPR lines: an untested range from the session before. Expect a reaction the first time price returns to it.
- The label column to the right of the newest matrix carries the level name and its price (T- for traditional, C- for Camarilla, F- for Fibonacci). The newest matrix is the forecast once it is drawn, otherwise the session in progress. When two levels are too close (TC, P and BC often are), their labels are spread apart around the levels while keeping their order, so a label can sit slightly above or below its line. Older sessions keep their lines and bands without text, so the candles stay readable.
- Glowing level with a label next to the last bar: price is inside the strike zone of that level right now.
- R-Bull / R-Bear: regular divergences, a warning that the move into the level is losing momentum. H-Bull / H-Bear: hidden divergences, in favour of the prevailing trend.
Practical Applications
- Level plus divergence: a regular divergence printed while the radar lights up a pivot is the classic reversal setup at a level.
- Trend days: a narrow CPR, an open outside it and no return to P during the first part of the session; traditional R1 / R2 or S1 / S2 become targets.
- Range days: a wide CPR with price rotating between TC and BC or between S1 and R1.
- Planning: with the session finished, the forecast shows tomorrow’s (or next week’s) matrix so the levels can be studied in advance.
- Swing trading: switch the anchor to weekly or monthly on intraday or daily charts.
Use the indicator on a daily chart or lower. Turn on only the families you actually trade: with the three of them and 15 sessions the chart gets crowded.
Indicator Configuration
- pivotAnchor (default 0): 0 = daily, 1 = weekly, 2 = monthly sessions.
- maxHistory (default 15): sessions kept on the chart.
- pivotOpacity (default 100): opacity of lines and labels, 0 to 100.
- showCPR (default 1): TC, BC and the filled bands. showVCPR (default 1): extend an untouched CPR.
- pColR / pColG / pColB, pWidth (default 1), pStyle (default 2): colour, width and style of the central pivot. Styles: 0 = solid, 1 = dashed, 2 = dotted.
- showTrad (default 1), tStyle, support and resistance colours and widths (tSup…, tRes…), and one switch per level (tOnR1 to tOnS3).
- showCam (default 0), cStyle, colours and widths (cSup…, cRes…), and switches cOnCP, cOnR1 to cOnS4.
- showFib (default 0), fStyle, colours and widths (fSup…, fRes…), and switches fOnR1 to fOnS3.
- showDivLines (default 0): line joining the two pivots of a divergence. showDivText (default 1): text next to the triangle.
- maxDivBars (default 60): maximum distance between the two pivots. rsiLen (default 14). pivLookback (default 5): bars on each side of a pivot.
- divMode (default 0): 0 = the RSI pivot and the price pivot must fall on the same bar; 1 = the RSI pivot alone is enough and the price extreme is read within divPw (default 2) bars around it, which gives more signals.
- maxDivDrawn (default 100): most recent divergences kept on the chart.
- enableRadar (default 1) and bufferPct (default 0.02): touch radar and its strike zone, in percent of the level.
- forecastMode (default 1): 0 = never draw the next session, 1 = draw it when the current session has as many bars as the previous one, 2 = always.
- labelShift (default 8): distance in bars between the end of a line and the centre of its label.
- labelAll (default 0): 0 = labels only on the newest matrix, 1 = labels on every session kept on the chart (older sessions are labelled left of their start, Fibonacci right of their end). With 1, zoom in: on intraday charts each label is wider than a session.
- labelGap (default 0.25): minimum vertical distance between two labels of the newest matrix, as a fraction of the high-low range of its reference session. Raise it if labels still touch on your zoom, lower it to keep them closer to their lines.
The Code
//---------------------------------------------------------------
// PRC_GCM Hybrid CPR Matrix
// version = 0
// 16.11.2026
// Iván González @ www.prorealcode.com
// Author: uniGram
// Sharing ProRealTime knowledge
//--------------------------------------------------------------------//
defparam drawonlastbaronly = true
//--------------------------------------------------------------------//
// INPUTS
//--------------------------------------------------------------------//
// Use a chart of daily timeframe or lower: the three TIMEFRAME blocks
// below cannot be lower than the chart.
// 1. Global settings and central pivot (P)
pivotAnchor = 0 // 0 = Daily, 1 = Weekly, 2 = Monthly
maxHistory = 15 // sessions kept on the chart
pivotOpacity = 100 // opacity of lines and labels, 0 to 100
showCPR = 1 // CPR matrix: TC, P, BC and its two filled bands
showVCPR = 1 // extend the previous CPR when the session never touched it
pColR = 120 // central pivot colour
pColG = 123
pColB = 134
pWidth = 1 // 1 to 5
pStyle = 2 // 0 = solid, 1 = dashed, 2 = dotted
// 2. Traditional pivots
showTrad = 1
tStyle = 0 // 0 = solid, 1 = dashed, 2 = dotted
tSupR = 76 // support colour
tSupG = 175
tSupB = 80
tSupWidth = 1
tResR = 247 // resistance colour
tResG = 124
tResB = 128
tResWidth = 1
tOnR1 = 1
tOnS1 = 1
tOnR2 = 1
tOnS2 = 1
tOnR3 = 1
tOnS3 = 1
// 3. Camarilla pivots
showCam = 0
cStyle = 0
cSupR = 8
cSupG = 153
cSupB = 129
cSupWidth = 1
cResR = 242
cResG = 54
cResB = 69
cResWidth = 1
cOnCP = 1
cOnR1 = 1
cOnS1 = 1
cOnR2 = 1
cOnS2 = 1
cOnR3 = 1
cOnS3 = 1
cOnR4 = 1
cOnS4 = 1
// 4. Fibonacci pivots
showFib = 0
fStyle = 0
fSupR = 91
fSupG = 156
fSupB = 246
fSupWidth = 1
fResR = 186
fResG = 104
fResB = 200
fResWidth = 1
fOnR1 = 1
fOnS1 = 1
fOnR2 = 1
fOnS2 = 1
fOnR3 = 1
fOnS3 = 1
// 5. RSI divergences
showDivLines = 0 // line joining the two pivots of a divergence
showDivText = 1 // R-Bull / H-Bull / R-Bear / H-Bear text
maxDivBars = 60 // maximum distance between the two pivots
rsiLen = 14
pivLookback = 5 // bars on each side of a pivot
divMode = 0 // 0 = RSI pivot and price pivot on the same bar, 1 = RSI pivot only
divPw = 2 // divMode = 1: price extreme read within +/- divPw bars of the RSI pivot
maxDivDrawn = 100 // most recent divergences kept on the chart
// 6. Smart radar (levels of the current session touched by the last bar)
enableRadar = 1
bufferPct = 0.02 // strike zone around each level, in percent of the level
// Next-session forecast: 0 = off, 1 = when the current session already has
// as many bars as the previous one, 2 = always
forecastMode = 1
labelShift = 8 // bars between the end of a line and the centre of its label
// Static labels: 0 = only the newest matrix (the forecast when it is drawn,
// otherwise the session in progress), 1 = every session kept on the chart
labelAll = 0
// The newest matrix is labelled in one column to the right of its lines. Two of
// its labels closer than labelGap x the range of the reference session are
// spread apart (TC, P and BC are often less than a text line apart)
labelGap = 0.25
//--------------------------------------------------------------------//
// HIGHER TIMEFRAME DATA (current, previous and second previous candle)
//--------------------------------------------------------------------//
TIMEFRAME(daily)
dO0 = open
dH0 = high
dL0 = low
dC0 = close
dH1 = high[1]
dL1 = low[1]
dC1 = close[1]
dH2 = high[2]
dL2 = low[2]
dC2 = close[2]
TIMEFRAME(weekly)
wO0 = open
wH0 = high
wL0 = low
wC0 = close
wH1 = high[1]
wL1 = low[1]
wC1 = close[1]
wH2 = high[2]
wL2 = low[2]
wC2 = close[2]
TIMEFRAME(monthly)
mO0 = open
mH0 = high
mL0 = low
mC0 = close
mH1 = high[1]
mL1 = low[1]
mC1 = close[1]
mH2 = high[2]
mL2 = low[2]
mC2 = close[2]
TIMEFRAME(default)
IF pivotAnchor = 1 THEN
sesO = wO0
curH = wH0
curL = wL0
curC = wC0
prvH = wH1
prvL = wL1
prvC = wC1
pr2H = wH2
pr2L = wL2
pr2C = wC2
ELSIF pivotAnchor = 2 THEN
sesO = mO0
curH = mH0
curL = mL0
curC = mC0
prvH = mH1
prvL = mL1
prvC = mC1
pr2H = mH2
pr2L = mL2
pr2C = mC2
ELSE
sesO = dO0
curH = dH0
curL = dL0
curC = dC0
prvH = dH1
prvL = dL1
prvC = dC1
pr2H = dH2
pr2L = dL2
pr2C = dC2
ENDIF
//--------------------------------------------------------------------//
// SESSION REGISTER
//--------------------------------------------------------------------//
// A new higher timeframe candle changes its open or the previous candle.
// Each session is stored once in a new slot: a pure assignment indexed by
// a scalar counter, so the ticks of the live bar cannot duplicate it.
ONCE nS = 0
newSess = 0
IF barindex > 0 THEN
IF sesO <> sesO[1] OR prvH <> prvH[1] OR prvL <> prvL[1] OR prvC <> prvC[1] THEN
newSess = 1
ENDIF
ENDIF
IF newSess = 1 AND prvH > 0 AND prvL > 0 THEN
$sX[nS] = barindex
$sH[nS] = prvH
$sL[nS] = prvL
$sC[nS] = prvC
IF pr2H > 0 AND pr2L > 0 THEN
$sVok[nS] = 1
$sQH[nS] = pr2H
$sQL[nS] = pr2L
$sQC[nS] = pr2C
ELSE
$sVok[nS] = 0
$sQH[nS] = 0
$sQL[nS] = 0
$sQC[nS] = 0
ENDIF
nS = nS + 1
ENDIF
//--------------------------------------------------------------------//
// RSI DIVERGENCE ENGINE
//--------------------------------------------------------------------//
rsiV = rsi[rsiLen](close)
lb = max(1, pivLookback)
atrDv = averagetruerange[14](close)
loR = lowest[lb](rsiV)
hiR = highest[lb](rsiV)
loP = lowest[lb](low)
hiP = highest[lb](high)
// pivot: strict against the bars after it, >= / <= against the bars before it
rsiPl = rsiV[lb] < loR AND rsiV[lb] <= loR[lb + 1]
rsiPh = rsiV[lb] > hiR AND rsiV[lb] >= hiR[lb + 1]
prcPl = low[lb] < loP AND low[lb] <= loP[lb + 1]
prcPh = high[lb] > hiP AND high[lb] >= hiP[lb + 1]
// divMode = 1: price extreme inside a window centred on the RSI pivot
pwUse = max(0, min(divPw, lb - 1))
winSz = 2 * pwUse + 1
winOff = lb - pwUse
prcLoWin = lowest[winSz](low)[winOff]
prcHiWin = highest[winSz](high)[winOff]
ONCE nDv = 0
ONCE havePl = 0
ONCE havePh = 0
plOk = 0
phOk = 0
IF barindex > rsiLen + 2 * lb + 1 THEN
IF rsiPl THEN
IF divMode = 0 THEN
IF prcPl THEN
plOk = 1
plPrice = low[lb]
ENDIF
ELSE
plOk = 1
plPrice = prcLoWin
ENDIF
ENDIF
IF rsiPh THEN
IF divMode = 0 THEN
IF prcPh THEN
phOk = 1
phPrice = high[lb]
ENDIF
ELSE
phOk = 1
phPrice = prcHiWin
ENDIF
ENDIF
ENDIF
IF plOk = 1 THEN
plRsi = rsiV[lb]
plBar = barindex - lb
IF havePl = 1 THEN
gapPl = plBar - prevPlBar
IF gapPl <= maxDivBars AND gapPl > 0 THEN
dvKind = 0
IF plPrice < prevPlPrice AND plRsi > prevPlRsi THEN
dvKind = 1
ELSIF plPrice > prevPlPrice AND plRsi < prevPlRsi THEN
dvKind = 2
ENDIF
IF dvKind > 0 THEN
$dvT[nDv] = dvKind
$dvX[nDv] = plBar
$dvY[nDv] = plPrice
$dvMY[nDv] = low[lb]
$dvPX[nDv] = prevPlBar
$dvPY[nDv] = prevPlPrice
$dvOf[nDv] = atrDv
nDv = nDv + 1
ENDIF
ENDIF
ENDIF
prevPlRsi = plRsi
prevPlPrice = plPrice
prevPlBar = plBar
havePl = 1
ENDIF
IF phOk = 1 THEN
phRsi = rsiV[lb]
phBar = barindex - lb
IF havePh = 1 THEN
gapPh = phBar - prevPhBar
IF gapPh <= maxDivBars AND gapPh > 0 THEN
dvKind = 0
IF phPrice > prevPhPrice AND phRsi < prevPhRsi THEN
dvKind = 3
ELSIF phPrice < prevPhPrice AND phRsi > prevPhRsi THEN
dvKind = 4
ENDIF
IF dvKind > 0 THEN
$dvT[nDv] = dvKind
$dvX[nDv] = phBar
$dvY[nDv] = phPrice
$dvMY[nDv] = high[lb]
$dvPX[nDv] = prevPhBar
$dvPY[nDv] = prevPhPrice
$dvOf[nDv] = atrDv
nDv = nDv + 1
ENDIF
ENDIF
ENDIF
prevPhRsi = phRsi
prevPhPrice = phPrice
prevPhBar = phBar
havePh = 1
ENDIF
//--------------------------------------------------------------------//
// DRAWING (last bar only: the whole picture is rebuilt on every update)
//--------------------------------------------------------------------//
IF islastbarupdate THEN
lnA = round(255 * max(0, min(100, pivotOpacity)) / 100)
pw10 = POW(10, Decimals)
// ---------------- pivot sessions ----------------
IF nS > 0 THEN
IF nS >= 2 THEN
sessLen = $sX[nS - 1] - $sX[nS - 2]
ELSE
sessLen = 20
ENDIF
curLen = barindex - $sX[nS - 1] + 1
doFc = 0
IF forecastMode = 2 THEN
doFc = 1
ELSIF forecastMode = 1 AND nS >= 2 AND curLen >= sessLen THEN
doFc = 1
ENDIF
kFirst = max(0, nS - maxHistory)
kLast = nS - 1 + doFc
FOR k = kFirst TO kLast DO
isCur = 0
// one label column per session crowds the chart: by default only the
// newest matrix (k = kLast) carries its static labels
newest = 0
IF k = kLast THEN
newest = 1
ENDIF
doLbl = 0
IF labelAll = 1 OR newest = 1 THEN
doLbl = 1
ENDIF
IF k < nS THEN
xA = $sX[k]
sesH = $sH[k]
sesL = $sL[k]
sesC = $sC[k]
vOk = $sVok[k]
vqH = $sQH[k]
vqL = $sQL[k]
vqC = $sQC[k]
IF k < nS - 1 THEN
xB = $sX[k + 1]
ELSE
xB = max(barindex + 3, xA + sessLen)
isCur = 1
ENDIF
ELSE
// forecast: the session in progress becomes the reference
xA = barindex + 1
xB = xA + sessLen
sesH = curH
sesL = curL
sesC = curC
vOk = 1
vqH = prvH
vqL = prvL
vqC = prvC
ENDIF
// when the newest matrix is the session in progress, a touched level is
// shown in its label column instead of in a second label by the last bar
mergeR = 0
IF newest = 1 AND isCur = 1 THEN
mergeR = 1
ENDIF
nL = 0
pv = (sesH + sesL + sesC) / 3
bcV = (sesH + sesL) / 2
tcV = (pv - bcV) + pv
actTC = max(bcV, tcV)
actBC = min(bcV, tcV)
rg = sesH - sesL
FOR j = 0 TO 26 DO
$on[j] = 0
$lv[j] = pv
NEXT
// 0 = P, 1 = TC, 2 = BC
$on[0] = 1
IF showCPR = 1 THEN
$lv[1] = actTC
$on[1] = 1
$lv[2] = actBC
$on[2] = 1
DRAWRECTANGLE(xA, pv, xB, actTC) COLOURED(242, 54, 69, 0) FILLCOLOR(242, 54, 69, 51)
DRAWRECTANGLE(xA, actBC, xB, pv) COLOURED(56, 142, 60, 0) FILLCOLOR(56, 142, 60, 51)
ENDIF
// 3 = VCPR, 4 = V-TC, 5 = V-BC: the CPR of the session before,
// extended when the reference session never traded inside it
IF showVCPR = 1 AND vOk = 1 THEN
vP = (vqH + vqL + vqC) / 3
vBC = (vqH + vqL) / 2
vTC = (vP - vBC) + vP
vActTC = max(vBC, vTC)
vActBC = min(vBC, vTC)
IF sesL > vActTC OR sesH < vActBC THEN
$lv[3] = vP
$on[3] = 1
$lv[4] = vActTC
$on[4] = 1
$lv[5] = vActBC
$on[5] = 1
DRAWRECTANGLE(xA, vP, xB, vActTC) COLOURED(242, 54, 69, 0) FILLCOLOR(242, 54, 69, 20)
DRAWRECTANGLE(xA, vActBC, xB, vP) COLOURED(56, 142, 60, 0) FILLCOLOR(56, 142, 60, 20)
ENDIF
ENDIF
// 6..11 = traditional R1, S1, R2, S2, R3, S3
IF showTrad = 1 THEN
$lv[6] = pv * 2 - sesL
$on[6] = tOnR1
$lv[7] = pv * 2 - sesH
$on[7] = tOnS1
$lv[8] = pv + rg
$on[8] = tOnR2
$lv[9] = pv - rg
$on[9] = tOnS2
$lv[10] = sesH + 2 * (pv - sesL)
$on[10] = tOnR3
$lv[11] = sesL - 2 * (sesH - pv)
$on[11] = tOnS3
ENDIF
// 12..20 = Camarilla CP, R1, S1, R2, S2, R3, S3, R4, S4
IF showCam = 1 THEN
$lv[12] = sesC
$on[12] = cOnCP
$lv[13] = sesC + rg * 1.1 / 12
$on[13] = cOnR1
$lv[14] = sesC - rg * 1.1 / 12
$on[14] = cOnS1
$lv[15] = sesC + rg * 1.1 / 6
$on[15] = cOnR2
$lv[16] = sesC - rg * 1.1 / 6
$on[16] = cOnS2
$lv[17] = sesC + rg * 1.1 / 4
$on[17] = cOnR3
$lv[18] = sesC - rg * 1.1 / 4
$on[18] = cOnS3
$lv[19] = sesC + rg * 1.1 / 2
$on[19] = cOnR4
$lv[20] = sesC - rg * 1.1 / 2
$on[20] = cOnS4
ENDIF
// 21..26 = Fibonacci R1, S1, R2, S2, R3, S3
IF showFib = 1 THEN
$lv[21] = pv + 0.382 * rg
$on[21] = fOnR1
$lv[22] = pv - 0.382 * rg
$on[22] = fOnS1
$lv[23] = pv + 0.618 * rg
$on[23] = fOnR2
$lv[24] = pv - 0.618 * rg
$on[24] = fOnS2
$lv[25] = pv + rg
$on[25] = fOnR3
$lv[26] = pv - rg
$on[26] = fOnS3
ENDIF
// ---------------- one pass per level ----------------
FOR j = 0 TO 26 DO
IF $on[j] = 1 THEN
lvl = $lv[j]
lvTxt = round(lvl * pw10) / pw10
// colour, width and style of the level family
IF j = 0 OR j = 3 OR j = 12 THEN
cr = pColR
cg = pColG
cb = pColB
wd = 1
st = 2
IF j = 0 THEN
wd = pWidth
st = pStyle
ELSIF j = 12 THEN
wd = cSupWidth
ENDIF
ELSIF j = 1 OR j = 4 THEN
cr = 242
cg = 54
cb = 69
wd = 1
st = 0
IF j = 4 THEN
st = 2
ENDIF
ELSIF j = 2 OR j = 5 THEN
cr = 56
cg = 142
cb = 60
wd = 1
st = 0
IF j = 5 THEN
st = 2
ENDIF
ELSIF j <= 11 THEN
st = tStyle
IF (j - 6) MOD 2 = 0 THEN
cr = tResR
cg = tResG
cb = tResB
wd = tResWidth
ELSE
cr = tSupR
cg = tSupG
cb = tSupB
wd = tSupWidth
ENDIF
ELSIF j <= 20 THEN
st = cStyle
IF (j - 13) MOD 2 = 0 THEN
cr = cResR
cg = cResG
cb = cResB
wd = cResWidth
ELSE
cr = cSupR
cg = cSupG
cb = cSupB
wd = cSupWidth
ENDIF
ELSE
st = fStyle
IF (j - 21) MOD 2 = 0 THEN
cr = fResR
cg = fResG
cb = fResB
wd = fResWidth
ELSE
cr = fSupR
cg = fSupG
cb = fSupB
wd = fSupWidth
ENDIF
ENDIF
// smart radar: only the session in progress, only the last bar
hit = 0
IF enableRadar = 1 AND isCur = 1 THEN
buf = lvl * bufferPct / 100
IF high >= lvl - buf AND low <= lvl + buf THEN
hit = 1
ENDIF
ENDIF
lA = lnA
IF hit = 1 THEN
// touched level: wide translucent glow under a thin opaque core
lA = 255
wd = 1
DRAWSEGMENT(xA, lvl, xB, lvl) COLOURED(cr, cg, cb, 51) STYLE(line, 5)
ENDIF
// style and width must be literals: one branch per combination
IF st = 0 THEN
IF wd <= 1 THEN
DRAWSEGMENT(xA, lvl, xB, lvl) COLOURED(cr, cg, cb, lA) STYLE(line, 1)
ELSIF wd = 2 THEN
DRAWSEGMENT(xA, lvl, xB, lvl) COLOURED(cr, cg, cb, lA) STYLE(line, 2)
ELSIF wd = 3 THEN
DRAWSEGMENT(xA, lvl, xB, lvl) COLOURED(cr, cg, cb, lA) STYLE(line, 3)
ELSIF wd = 4 THEN
DRAWSEGMENT(xA, lvl, xB, lvl) COLOURED(cr, cg, cb, lA) STYLE(line, 4)
ELSE
DRAWSEGMENT(xA, lvl, xB, lvl) COLOURED(cr, cg, cb, lA) STYLE(line, 5)
ENDIF
ELSIF st = 1 THEN
IF wd <= 1 THEN
DRAWSEGMENT(xA, lvl, xB, lvl) COLOURED(cr, cg, cb, lA) STYLE(dottedline2, 1)
ELSIF wd = 2 THEN
DRAWSEGMENT(xA, lvl, xB, lvl) COLOURED(cr, cg, cb, lA) STYLE(dottedline2, 2)
ELSIF wd = 3 THEN
DRAWSEGMENT(xA, lvl, xB, lvl) COLOURED(cr, cg, cb, lA) STYLE(dottedline2, 3)
ELSIF wd = 4 THEN
DRAWSEGMENT(xA, lvl, xB, lvl) COLOURED(cr, cg, cb, lA) STYLE(dottedline2, 4)
ELSE
DRAWSEGMENT(xA, lvl, xB, lvl) COLOURED(cr, cg, cb, lA) STYLE(dottedline2, 5)
ENDIF
ELSE
IF wd <= 1 THEN
DRAWSEGMENT(xA, lvl, xB, lvl) COLOURED(cr, cg, cb, lA) STYLE(dottedline, 1)
ELSIF wd = 2 THEN
DRAWSEGMENT(xA, lvl, xB, lvl) COLOURED(cr, cg, cb, lA) STYLE(dottedline, 2)
ELSIF wd = 3 THEN
DRAWSEGMENT(xA, lvl, xB, lvl) COLOURED(cr, cg, cb, lA) STYLE(dottedline, 3)
ELSIF wd = 4 THEN
DRAWSEGMENT(xA, lvl, xB, lvl) COLOURED(cr, cg, cb, lA) STYLE(dottedline, 4)
ELSE
DRAWSEGMENT(xA, lvl, xB, lvl) COLOURED(cr, cg, cb, lA) STYLE(dottedline, 5)
ENDIF
ENDIF
// the label of this level is stored and drawn after the loop, once the
// labels of the newest matrix have been placed
addLb = 0
IF doLbl = 1 THEN
IF j = 4 OR j = 5 THEN
// V-TC and V-BC carry no static label, only the radar one
addLb = hit * mergeR
ELSE
addLb = 1
ENDIF
ENDIF
IF addLb = 1 THEN
$lbY[nL] = lvl
$lbJ[nL] = j
$lbR[nL] = cr
$lbG[nL] = cg
$lbB[nL] = cb
$lbA[nL] = lnA
IF j = 3 THEN
$lbR[nL] = 255
$lbG[nL] = 183
$lbB[nL] = 77
ENDIF
IF hit = 1 THEN
$lbA[nL] = 255
ENDIF
nL = nL + 1
ENDIF
// radar label next to the last bar: name and price of the touched level
IF hit = 1 AND mergeR = 0 THEN
xR = barindex + 1 + labelShift
IF j = 0 THEN
DRAWTEXT("P | #lvTxt#", xR, lvl) COLOURED(cr, cg, cb, 255)
ELSIF j = 1 THEN
DRAWTEXT("TC | #lvTxt#", xR, lvl) COLOURED(cr, cg, cb, 255)
ELSIF j = 2 THEN
DRAWTEXT("BC | #lvTxt#", xR, lvl) COLOURED(cr, cg, cb, 255)
ELSIF j = 3 THEN
DRAWTEXT("VCPR | #lvTxt#", xR, lvl) COLOURED(cr, cg, cb, 255)
ELSIF j = 4 THEN
DRAWTEXT("V-TC | #lvTxt#", xR, lvl) COLOURED(cr, cg, cb, 255)
ELSIF j = 5 THEN
DRAWTEXT("V-BC | #lvTxt#", xR, lvl) COLOURED(cr, cg, cb, 255)
ELSIF j = 6 THEN
DRAWTEXT("T-R1 | #lvTxt#", xR, lvl) COLOURED(cr, cg, cb, 255)
ELSIF j = 7 THEN
DRAWTEXT("T-S1 | #lvTxt#", xR, lvl) COLOURED(cr, cg, cb, 255)
ELSIF j = 8 THEN
DRAWTEXT("T-R2 | #lvTxt#", xR, lvl) COLOURED(cr, cg, cb, 255)
ELSIF j = 9 THEN
DRAWTEXT("T-S2 | #lvTxt#", xR, lvl) COLOURED(cr, cg, cb, 255)
ELSIF j = 10 THEN
DRAWTEXT("T-R3 | #lvTxt#", xR, lvl) COLOURED(cr, cg, cb, 255)
ELSIF j = 11 THEN
DRAWTEXT("T-S3 | #lvTxt#", xR, lvl) COLOURED(cr, cg, cb, 255)
ELSIF j = 12 THEN
DRAWTEXT("C-CP | #lvTxt#", xR, lvl) COLOURED(cr, cg, cb, 255)
ELSIF j = 13 THEN
DRAWTEXT("C-R1 | #lvTxt#", xR, lvl) COLOURED(cr, cg, cb, 255)
ELSIF j = 14 THEN
DRAWTEXT("C-S1 | #lvTxt#", xR, lvl) COLOURED(cr, cg, cb, 255)
ELSIF j = 15 THEN
DRAWTEXT("C-R2 | #lvTxt#", xR, lvl) COLOURED(cr, cg, cb, 255)
ELSIF j = 16 THEN
DRAWTEXT("C-S2 | #lvTxt#", xR, lvl) COLOURED(cr, cg, cb, 255)
ELSIF j = 17 THEN
DRAWTEXT("C-R3 | #lvTxt#", xR, lvl) COLOURED(cr, cg, cb, 255)
ELSIF j = 18 THEN
DRAWTEXT("C-S3 | #lvTxt#", xR, lvl) COLOURED(cr, cg, cb, 255)
ELSIF j = 19 THEN
DRAWTEXT("C-R4 | #lvTxt#", xR, lvl) COLOURED(cr, cg, cb, 255)
ELSIF j = 20 THEN
DRAWTEXT("C-S4 | #lvTxt#", xR, lvl) COLOURED(cr, cg, cb, 255)
ELSIF j = 21 THEN
DRAWTEXT("F-R1 | #lvTxt#", xR, lvl) COLOURED(cr, cg, cb, 255)
ELSIF j = 22 THEN
DRAWTEXT("F-S1 | #lvTxt#", xR, lvl) COLOURED(cr, cg, cb, 255)
ELSIF j = 23 THEN
DRAWTEXT("F-R2 | #lvTxt#", xR, lvl) COLOURED(cr, cg, cb, 255)
ELSIF j = 24 THEN
DRAWTEXT("F-S2 | #lvTxt#", xR, lvl) COLOURED(cr, cg, cb, 255)
ELSIF j = 25 THEN
DRAWTEXT("F-R3 | #lvTxt#", xR, lvl) COLOURED(cr, cg, cb, 255)
ELSE
DRAWTEXT("F-S3 | #lvTxt#", xR, lvl) COLOURED(cr, cg, cb, 255)
ENDIF
ENDIF
ENDIF
NEXT
// ---------------- labels of this matrix ----------------
IF nL > 0 THEN
IF newest = 1 THEN
// one column to the right of the lines, over the empty bars after the
// last candle, so no label covers a candle. Labels closer than lbGap
// are spread apart around their mean price, keeping their order.
lbXc = xB + labelShift
lbGap = labelGap * (sesH - sesL)
// insertion sort by price
FOR m = 1 TO nL - 1 DO
hY = $lbY[m]
hJ = $lbJ[m]
hR = $lbR[m]
hG = $lbG[m]
hBl = $lbB[m]
hA = $lbA[m]
ps = m
moving = 1
WHILE moving = 1 DO
moving = 0
IF ps > 0 THEN
IF $lbY[ps - 1] > hY THEN
$lbY[ps] = $lbY[ps - 1]
$lbJ[ps] = $lbJ[ps - 1]
$lbR[ps] = $lbR[ps - 1]
$lbG[ps] = $lbG[ps - 1]
$lbB[ps] = $lbB[ps - 1]
$lbA[ps] = $lbA[ps - 1]
ps = ps - 1
moving = 1
ENDIF
ENDIF
WEND
$lbY[ps] = hY
$lbJ[ps] = hJ
$lbR[ps] = hR
$lbG[ps] = hG
$lbB[ps] = hBl
$lbA[ps] = hA
NEXT
// groups of labels that would overlap: each group is centred on the
// mean price of its levels, one lbGap between consecutive labels
nC = 0
FOR m = 0 TO nL - 1 DO
$cS[nC] = m
$cE[nC] = m
$cB[nC] = $lbY[m]
nC = nC + 1
merging = 1
WHILE merging = 1 DO
merging = 0
IF nC >= 2 THEN
prevTop = $cB[nC - 2] + ($cE[nC - 2] - $cS[nC - 2]) * lbGap
IF prevTop + lbGap > $cB[nC - 1] THEN
$cE[nC - 2] = $cE[nC - 1]
nC = nC - 1
qa = $cS[nC - 1]
qb = $cE[nC - 1]
sumY = 0
FOR q2 = qa TO qb DO
sumY = sumY + $lbY[q2]
NEXT
nMem = qb - qa + 1
$cB[nC - 1] = sumY / nMem - (nMem - 1) * lbGap / 2
merging = 1
ENDIF
ENDIF
WEND
NEXT
FOR c2 = 0 TO nC - 1 DO
qa = $cS[c2]
qb = $cE[c2]
FOR q2 = qa TO qb DO
$lbP[q2] = $cB[c2] + (q2 - qa) * lbGap
$lbX[q2] = lbXc
NEXT
NEXT
ELSE
// older sessions (labelAll = 1): where the original puts them, left of
// the session start and Fibonacci right of its end
FOR m = 0 TO nL - 1 DO
$lbP[m] = $lbY[m]
IF $lbJ[m] >= 21 THEN
$lbX[m] = xB + labelShift
ELSE
$lbX[m] = xA - labelShift
ENDIF
NEXT
ENDIF
// DRAWTEXT prints every interpolated number followed by a space, so the
// price goes last: "TC (#lvTxt#)" would read "TC (412,5 )"
FOR m = 0 TO nL - 1 DO
lj = $lbJ[m]
lx = $lbX[m]
ly = $lbP[m]
lvTxt = round($lbY[m] * pw10) / pw10
hR = $lbR[m]
hG = $lbG[m]
hBl = $lbB[m]
hA = $lbA[m]
IF lj = 0 THEN
DRAWTEXT("P #lvTxt#", lx, ly) COLOURED(hR, hG, hBl, hA)
ELSIF lj = 1 THEN
DRAWTEXT("TC #lvTxt#", lx, ly) COLOURED(hR, hG, hBl, hA)
ELSIF lj = 2 THEN
DRAWTEXT("BC #lvTxt#", lx, ly) COLOURED(hR, hG, hBl, hA)
ELSIF lj = 3 THEN
DRAWTEXT("VCPR #lvTxt#", lx, ly) COLOURED(hR, hG, hBl, hA)
ELSIF lj = 4 THEN
DRAWTEXT("V-TC #lvTxt#", lx, ly) COLOURED(hR, hG, hBl, hA)
ELSIF lj = 5 THEN
DRAWTEXT("V-BC #lvTxt#", lx, ly) COLOURED(hR, hG, hBl, hA)
ELSIF lj = 6 THEN
DRAWTEXT("T-R1 #lvTxt#", lx, ly) COLOURED(hR, hG, hBl, hA)
ELSIF lj = 7 THEN
DRAWTEXT("T-S1 #lvTxt#", lx, ly) COLOURED(hR, hG, hBl, hA)
ELSIF lj = 8 THEN
DRAWTEXT("T-R2 #lvTxt#", lx, ly) COLOURED(hR, hG, hBl, hA)
ELSIF lj = 9 THEN
DRAWTEXT("T-S2 #lvTxt#", lx, ly) COLOURED(hR, hG, hBl, hA)
ELSIF lj = 10 THEN
DRAWTEXT("T-R3 #lvTxt#", lx, ly) COLOURED(hR, hG, hBl, hA)
ELSIF lj = 11 THEN
DRAWTEXT("T-S3 #lvTxt#", lx, ly) COLOURED(hR, hG, hBl, hA)
ELSIF lj = 12 THEN
DRAWTEXT("C-CP #lvTxt#", lx, ly) COLOURED(hR, hG, hBl, hA)
ELSIF lj = 13 THEN
DRAWTEXT("C-R1 #lvTxt#", lx, ly) COLOURED(hR, hG, hBl, hA)
ELSIF lj = 14 THEN
DRAWTEXT("C-S1 #lvTxt#", lx, ly) COLOURED(hR, hG, hBl, hA)
ELSIF lj = 15 THEN
DRAWTEXT("C-R2 #lvTxt#", lx, ly) COLOURED(hR, hG, hBl, hA)
ELSIF lj = 16 THEN
DRAWTEXT("C-S2 #lvTxt#", lx, ly) COLOURED(hR, hG, hBl, hA)
ELSIF lj = 17 THEN
DRAWTEXT("C-R3 #lvTxt#", lx, ly) COLOURED(hR, hG, hBl, hA)
ELSIF lj = 18 THEN
DRAWTEXT("C-S3 #lvTxt#", lx, ly) COLOURED(hR, hG, hBl, hA)
ELSIF lj = 19 THEN
DRAWTEXT("C-R4 #lvTxt#", lx, ly) COLOURED(hR, hG, hBl, hA)
ELSIF lj = 20 THEN
DRAWTEXT("C-S4 #lvTxt#", lx, ly) COLOURED(hR, hG, hBl, hA)
ELSIF lj = 21 THEN
DRAWTEXT("F-R1 #lvTxt#", lx, ly) COLOURED(hR, hG, hBl, hA)
ELSIF lj = 22 THEN
DRAWTEXT("F-S1 #lvTxt#", lx, ly) COLOURED(hR, hG, hBl, hA)
ELSIF lj = 23 THEN
DRAWTEXT("F-R2 #lvTxt#", lx, ly) COLOURED(hR, hG, hBl, hA)
ELSIF lj = 24 THEN
DRAWTEXT("F-S2 #lvTxt#", lx, ly) COLOURED(hR, hG, hBl, hA)
ELSIF lj = 25 THEN
DRAWTEXT("F-R3 #lvTxt#", lx, ly) COLOURED(hR, hG, hBl, hA)
ELSE
DRAWTEXT("F-S3 #lvTxt#", lx, ly) COLOURED(hR, hG, hBl, hA)
ENDIF
NEXT
ENDIF
NEXT
ENDIF
// ---------------- RSI divergences ----------------
IF nDv > 0 THEN
dFirst = max(0, nDv - maxDivDrawn)
FOR q = dFirst TO nDv - 1 DO
dvK = $dvT[q]
dvBar = $dvX[q]
dvMk = $dvMY[q]
dvGap = $dvOf[q] * 0.4
IF dvK <= 2 THEN
DRAWTEXT("▲", dvBar, dvMk - dvGap) COLOURED(8, 153, 129, 255)
IF showDivText = 1 THEN
IF dvK = 1 THEN
DRAWTEXT("R-Bull", dvBar, dvMk - 2.2 * dvGap) COLOURED(8, 153, 129, 255)
ELSE
DRAWTEXT("H-Bull", dvBar, dvMk - 2.2 * dvGap) COLOURED(8, 153, 129, 255)
ENDIF
ENDIF
IF showDivLines = 1 THEN
IF dvK = 1 THEN
DRAWSEGMENT($dvPX[q], $dvPY[q], dvBar, $dvY[q]) COLOURED(8, 153, 129, 255) STYLE(line, 1)
ELSE
DRAWSEGMENT($dvPX[q], $dvPY[q], dvBar, $dvY[q]) COLOURED(8, 153, 129, 255) STYLE(dottedline2, 1)
ENDIF
ENDIF
ELSE
DRAWTEXT("▼", dvBar, dvMk + dvGap) COLOURED(242, 54, 69, 255)
IF showDivText = 1 THEN
IF dvK = 3 THEN
DRAWTEXT("R-Bear", dvBar, dvMk + 2.2 * dvGap) COLOURED(242, 54, 69, 255)
ELSE
DRAWTEXT("H-Bear", dvBar, dvMk + 2.2 * dvGap) COLOURED(242, 54, 69, 255)
ENDIF
ENDIF
IF showDivLines = 1 THEN
IF dvK = 3 THEN
DRAWSEGMENT($dvPX[q], $dvPY[q], dvBar, $dvY[q]) COLOURED(242, 54, 69, 255) STYLE(line, 1)
ELSE
DRAWSEGMENT($dvPX[q], $dvPY[q], dvBar, $dvY[q]) COLOURED(242, 54, 69, 255) STYLE(dottedline2, 1)
ENDIF
ENDIF
ENDIF
NEXT
ENDIF
ENDIF
//--------------------------------------------------------------------//
RETURN