High volumes Stocks Screener

High volumes Stocks Screener

The detection of high volumes may be part of the arsenal strategy of many traders, especially swing traders .

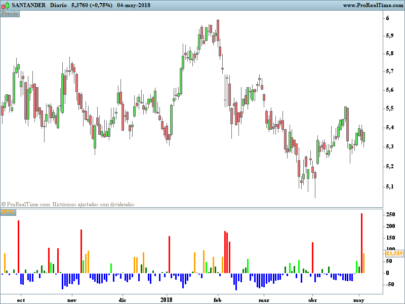
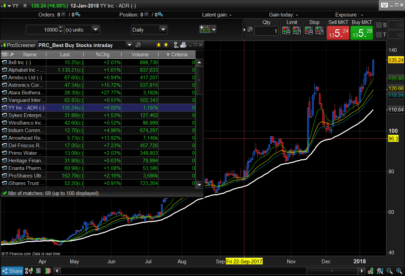
This screener detects shares (or others) with high volume in the previous 3 days.

A volume is defined as high if it exceeds 3 times the average of the last 20 volumes .

The actions must have a volume of at least 10,000

The ” freshness signal ” means the age of the signal (from 1 to 3 days).

You are free to change these settings.

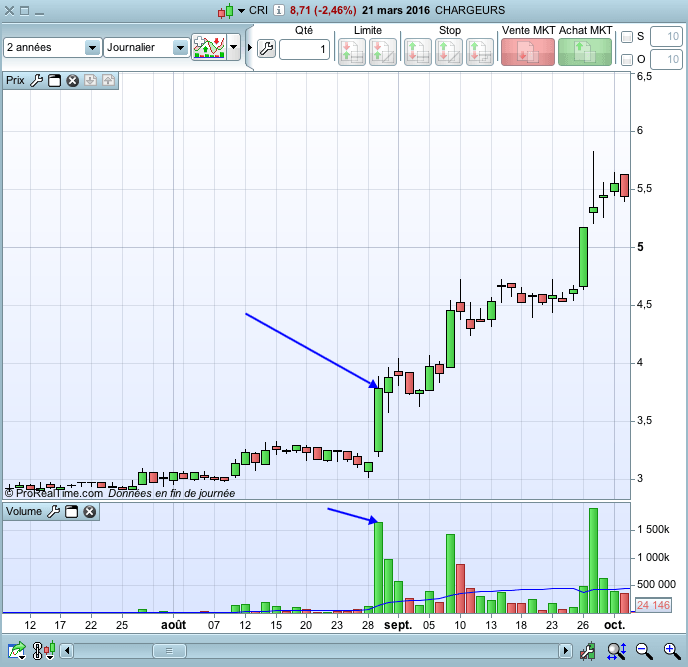
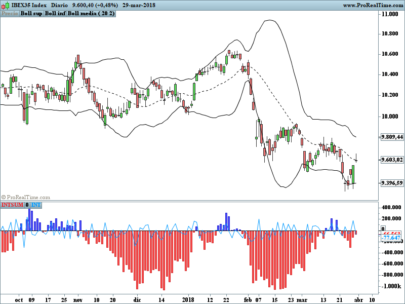
I used this screener to detect among other actions “CHARGEURS” , who introduced all the conditions for a nice increase : a bullish gap and a large green candle, with a very strong volume.

Here is the code of the screener. Remember to select the desired market (ie ” Euronext ” ) and timeframe ( for example, ” Daily” ) . In theory, the daily timeframe is best for this type of strategy (swing trading).

Share this

Risk disclosure:

No information on this site is investment advice or a solicitation to buy or sell any financial instrument. Past performance is not indicative of future results. Trading may expose you to risk of loss greater than your deposits and is only suitable for experienced investors who have sufficient financial means to bear such risk.

ProRealTime ITF files and other attachments : How to import ITF files into ProRealTime platform?

PRC is also on YouTube, subscribe to our channel for exclusive content and tutorials

  1. Trading-TPO • 03/22/2016 #

    Merci pour ce Proscreener que je conte essayer des que j’aurais ouvert un compte chez un broker action à moins que les CFD fonctionne aussi sur ce screen?

  2. Doctrading • 03/22/2016 #

    Bonjour,
    La détection de volumes élevés est surtout valable pour le marché actions.Par exemple, sur le forex ce n’est pas la même chose, c’est le nombre de fois où la valeur change.
    Pour les CFD je ne sais pas, je pense que c’est comme pour le forex, car les données des CFD sont détenues par le broker.Cordialement,

    • Samsam13 • 03/22/2016 #

      Bonjour, oui certains brokers CFD ne “pricent” pas les cours actions, mais reprennent les cours officiels des places d’échanges (et MTF), et donc donnent les volumes.
      Pour les autres je ne sais pas, mais c’est le cas pour IG, et donc pour ProrealTimeCFD, les volumes sont dispo. Sont-ils toujours corrects ? Il faudrait leur demander directement

  3. Xavier • 03/22/2016 #

    Bonjour Doctrading,
    Super code, merci.

  4. RobHansson • 03/22/2016 #

    Thanks for this screener. I would like the tool removed the shares that have been on the list very short time. Otherwise, these are displayed with the screener every day. Example least 200 days backwards, have tried but not succeeded. Could someone help me? / Thanks Robert

  5. davidspain • 03/22/2016 #

    hello doctor!!
    amazing job. I would like to ask u if it is possible to create an indicator like this in order to screen shares that have negotiated their maximum volumen of shares per week in THEIR WHOLE HISTORY.
     
    Best regards!

  6. GABRIELE1976 • 03/22/2016 #

    bonjour, je voudrais utiliser ce screener pour trouver les titres qui, à l’ouverture de la journée ont des volumes croissants avec un délai de 10 minutes. Merci de votre aide

avatar
Register or

Likes

avatar avatar avatar avatar avatar avatar avatar avatar avatar avatar avatar
Related users ' posts
TAC Bolsa Estas equivocado al 99,9%. La correlación entre las series de precios y volúmenes las des...
Domenec Si hablas de un indice regional como el Ibex es posible que sea asi yo nunca lo he operado y...
TAC Bolsa Regional de Mostoles, en una cosa tienes razón mejor dejarlo aquí...
Xusto Hello, Fully Agree, I will update it with your advice. Btw Can would you like share you co...
Niklas johansson hägglund do you now if it's possible to use this strategy with this code in tradingview also?
Alexander9 This code for metastock ?, can for amibroker . Thanks
TACBOLSA
6 years ago
luxrun Thank you so much Tac BOLSA, I can not post the picture tonight I'll try tomorrow. I loaded ...
TAC Bolsa A new version of TAC Volume HPI DIV10.4 is available. that marks the divergence In the fo...
Raymundo Buenas tardes. Como puedo descargar algunos indicadores de esta pagina ?
mangiaragni Buongiorno io non riesco a visualizzare nessun tipo di volume , mi torna sempre una linea dr...
Nicolas Assicurati che lo strumento che stai guardando abbia dei volumi! È il caso?
Despair What do you mean by “German extra stocks”?
odin i mean german xetra stocks :-)
Despair Ok! Thanks.
Mully Bonjour, est ce que quelqu'un sait comment ajouter les niveaux de résistances / supports su...
Nicolas Il s'agit de l'indicateur "volume par niveau de prix" disponible par défaut dans la plateforme.
Carlos Garcia If price tags the lower BBand, look for IIIX has positive values to enter a trade. Converse...
Thally Thanks for the quick response Nicholas. Would you have any idea how to resolve. Manually ref...
Thally Do you think adjusting the below code might help? newperiod = minuteminute[1] if newperi...
Nicolas There is no "second" instruction.
Actabi Thank you ! Have you realised your "next step" ?
Jessar guten Tag, gibt es bereits die Aktualisierte Datei?
Per Inge Gents - An update - I have been studying various trading approaches, as this one that is bas...
YvesRobert Merci beaucoup Nicolas. Existe t'il un petit programme qui permet de tracer sur la graphe en...
Nicolas Oui il y a celui ci: https://market.prorealcode.com/product/prt-renko/?lang=fr
YvesRobert Bonjour Nicolas, j'ai une question technique à te poser. Je visualise souvent le cours en RE...
GenesisEX Thank you all for your contributions this is a great submission. Thanks for your inputs.
tino Bonjour nicolas. Je ne parviens pas à recopier le screener de l'indicateur. Auriez vous la g...
Nicolas Quel screener svp? C'est dans un des sujets du forum? Merci de fournir le lien.
gabri Ha ragione in computer, ho sbagliato io BullAD = summation[period](ADvolbull*((Close-Low) –...
marcov66 Perfetto! Funziona. Grazie di tutto!
SkrHugo Bonjour, J'essaye d'utiliser le script avec le graphique renko mais sa ne marche pas, quelq...
Gianluca thank you very nice screener
Vonasi An interesting idea that was easily turned into a strategy on a shorter time frame that appe...
Stenozar Hi Vonasi, is it possible for you to share your code here? thanks in advance
Vonasi Sorry Stenozar. I have only really spent an hour or so on this strategy so far and it is far...
Alai-n I also have the same problem that I can not solve especially on LowVolume (Yellow) ... Sorry
Mert No need to apologise, my friend. It is great code. I hope you find a solution soon. Regards.
gabri I think it's because the lookback period changes at every new bar and that means that many c...
Giuseppe68 ciao, ho provato l'indicatore e mi sembra interessante, ma in fase di backtest non riesco ad...
poldoposta veramente bello.....complimenti
rb-72 5 Minutes, 15 Minutes, The most effective 1 Hour below 0 or above 0 as a turn signal in the ...
Andraxx Interpretación de el indicador??? Gracias
TAC Bolsa Oscilador que hace una medición ponderara basado en la distancia entre precio y una media Mó...
julien1978 changing the trendDetectionLength setting does not seem to have any effect on the wave calcu...
arran i can't seem to get this indicator to work on forex pairs. it works great on indices etc. An...
Nicolas Indicator needs Volume, and there are no volumes with forex pairs with IG.

Top