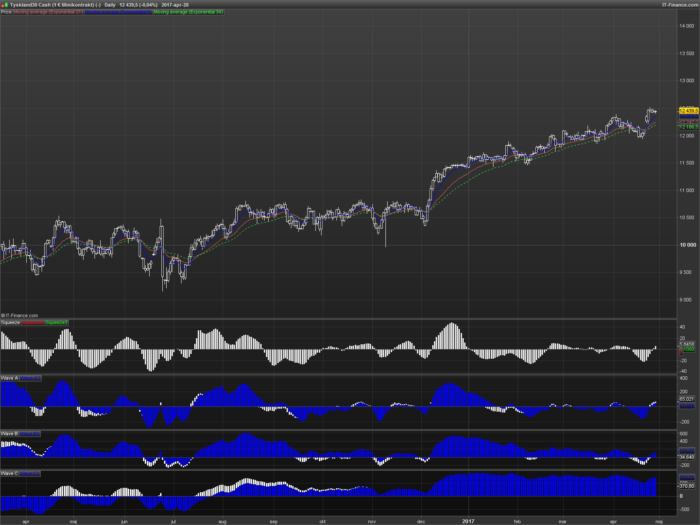
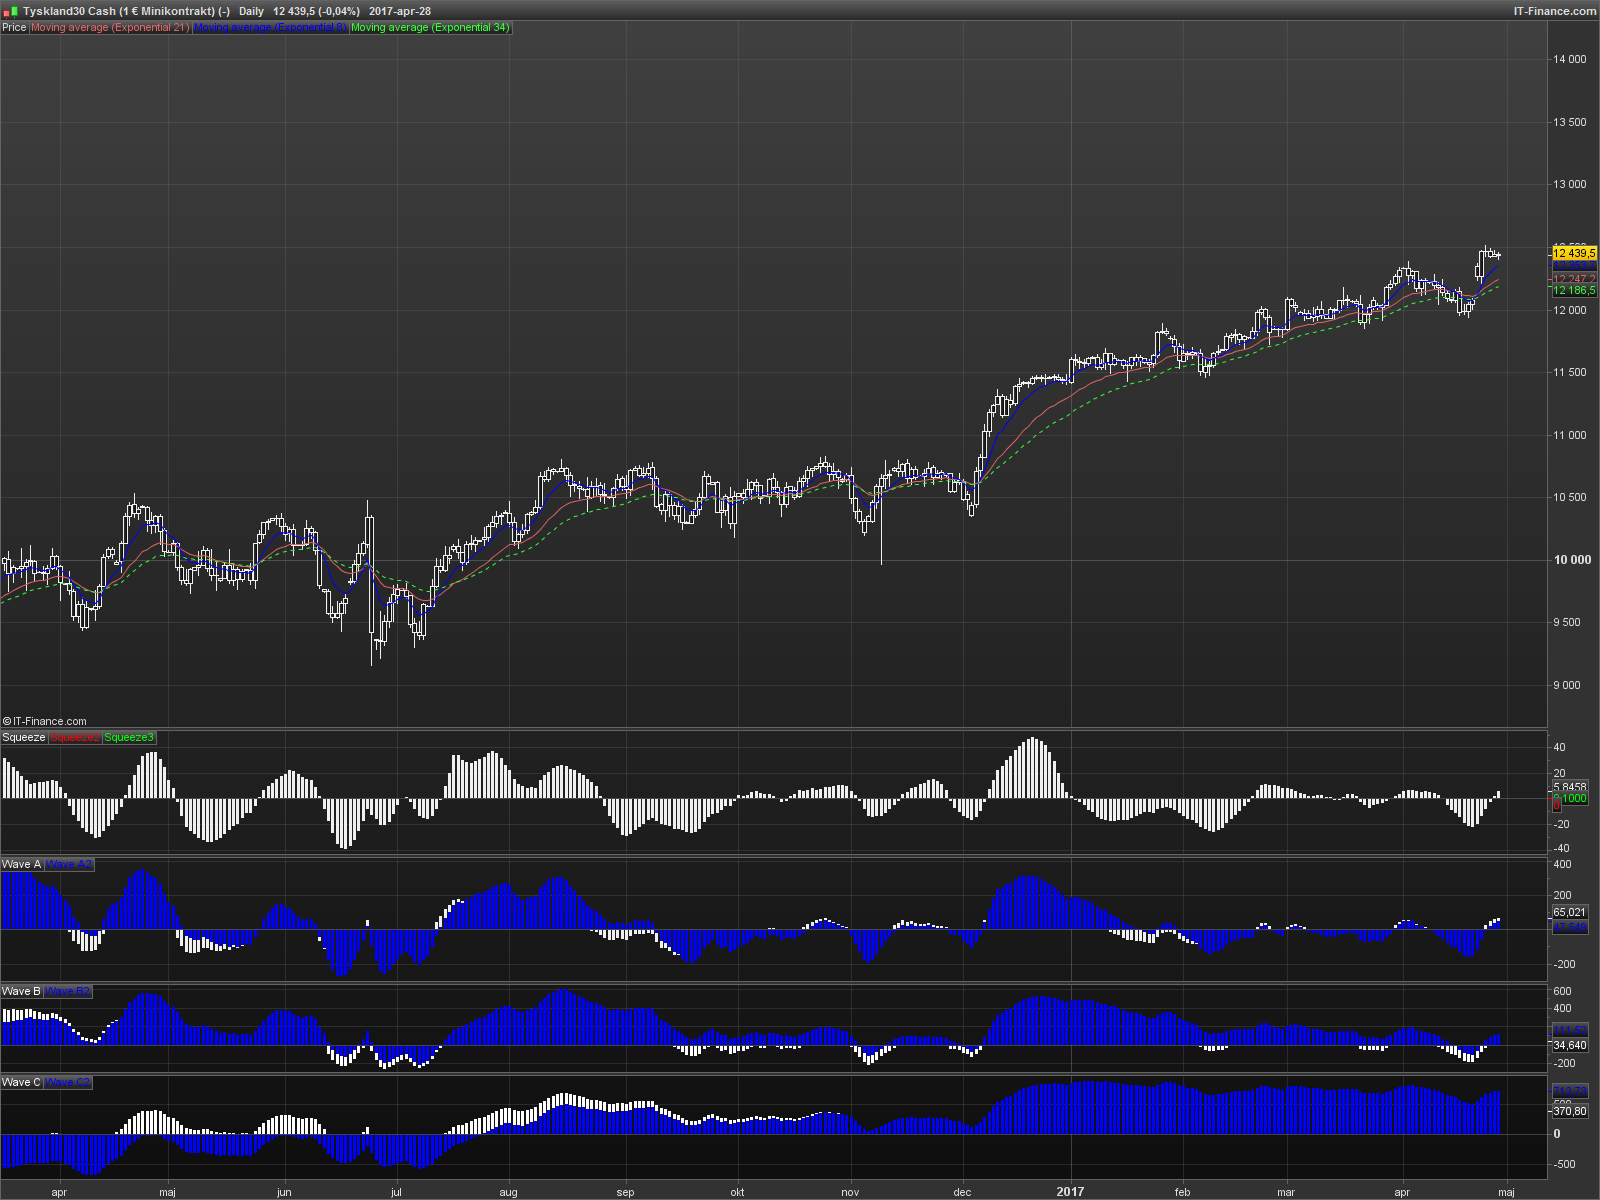
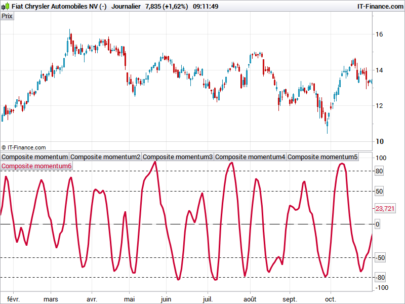
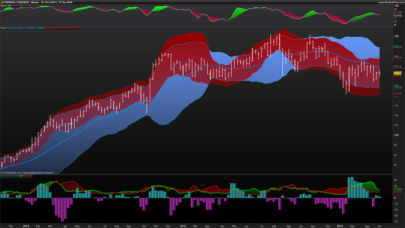
Waves is to visualize the overall strength and direction of a given market across multiple time frames.
Waves measuring short term (wave A), medium term (wave B) and long term momentum (wave C).
The A wave can be used as a signal on crossings of the zero line. Wave C shows the longer term trend and is most important for direction.
Wave A code:
|
1 2 3 4 5 |
A1= exponentialaverage[8](close)-exponentialaverage[34](close)- exponentialaverage[34](exponentialaverage[8](close)-exponentialaverage[34](close)) A2=exponentialaverage[8](close)-exponentialaverage[55](close)- exponentialaverage[55](exponentialaverage[8](close)-exponentialaverage[55](close)) return A1 coloured(255,255,255),A2 coloured(0,0,255) |
Wave B code:
|
1 2 3 4 5 |
B1= exponentialaverage[8](close)-exponentialaverage[89](close)- exponentialaverage[89](exponentialaverage[8](close)-exponentialaverage[89](close)) B2=exponentialaverage[8](close)-exponentialaverage[144](close)- exponentialaverage[144](exponentialaverage[8](close)-exponentialaverage[144](close)) return B1 coloured(255,255,255),B2 coloured(0,0,255) |
Wave C code:
|
1 2 3 4 5 |
C1= exponentialaverage[8](close)-exponentialaverage[233](close)- exponentialaverage[233](exponentialaverage[8](close)-exponentialaverage[233](close)) C2=exponentialaverage[8](close)-exponentialaverage[377](close)- exponentialaverage[377](exponentialaverage[8](close)-exponentialaverage[377](close)) return C1 coloured(255,255,255),C2 coloured(0,0,255) |
Share this
No information on this site is investment advice or a solicitation to buy or sell any financial instrument. Past performance is not indicative of future results. Trading may expose you to risk of loss greater than your deposits and is only suitable for experienced investors who have sufficient financial means to bear such risk.
ProRealTime ITF files and other attachments :
Find other exclusive trading pro-tools on ![]()
PRC is also on YouTube, subscribe to our channel for exclusive content and tutorials


Hi swingforfortune,
Thanks a lot about your interesting posting. Let ask you to explain more about your indicator. It’s very useful and intersteing. Thank again
Hello.
Basically they are a twist of the MACD histogram and can be used as such. They visualizes momentum in different time frames.
http://stockcharts.com/school/doku.php?id=chart_school:technical_indicators:macd-histogram#macd-histogram
You want the waves to all be positive or negative to be long or short. All above zero –> No shorts, buy dips.
Is momentum rising or falling are there any divergences to the price? This is what I look for.
Hope that helps.
Hi again
Thanks for the explanation. Have a good day