What is Volatility Ratio
The volatility ratio is a technical measure used to identify price patterns and breakouts. In technical analysis it uses true range to gain an understanding of how a security’s price is moving on the current day in comparison to its past volatility.
BREAKING DOWN Volatility Ratio
The volatility ratio is a measure that helps investors follow the volatility of a stock’s price. It is one of a few technical indicators focused on volatility. In general, standard deviation is typically one of the most common measures used for following volatility. Standard deviation forms the basis for several technical channels including Bollinger Bands. Comprehensively envelope channels of many different varieties are used by technical analysts to identify price ranges and volatility patterns that help lead to trading signals. Historical volatility is also another common trendline that can be used to follow volatility.
The volatility ratio was developed to contribute to the analysis of price volatility. Across the industry volatility and volatility ratio calculations may vary. For technical analysis, Jack Schwager is known for introducing the concept of a volatility ratio in his book “Technical Analysis.”
Calculating the Volatility Ratio
Schwager’s methodology for calculating the volatility ratio builds on the concept of true range which was developed and introduced by Welles Wilder but has several iterations.
VR = TTR / ATR
where: VR = Volatility Ratio
TTR = Today’s True Range
Today’s True Range = Max − Min
Max = Today’s High, Yesterday’s Close
Min = Today’s Low, Yesterday’s Close
ATR = Average True Range of the Past N-Day Period
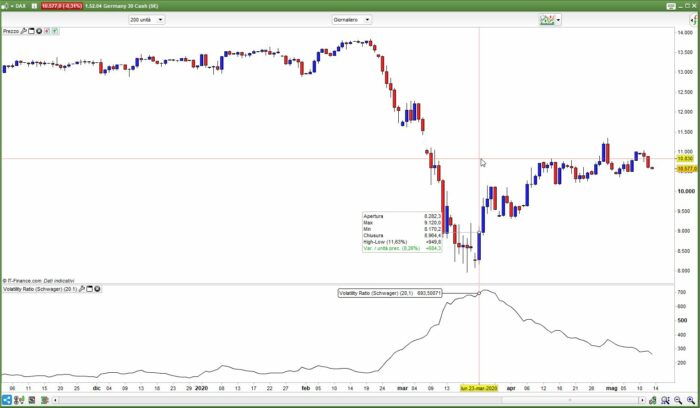
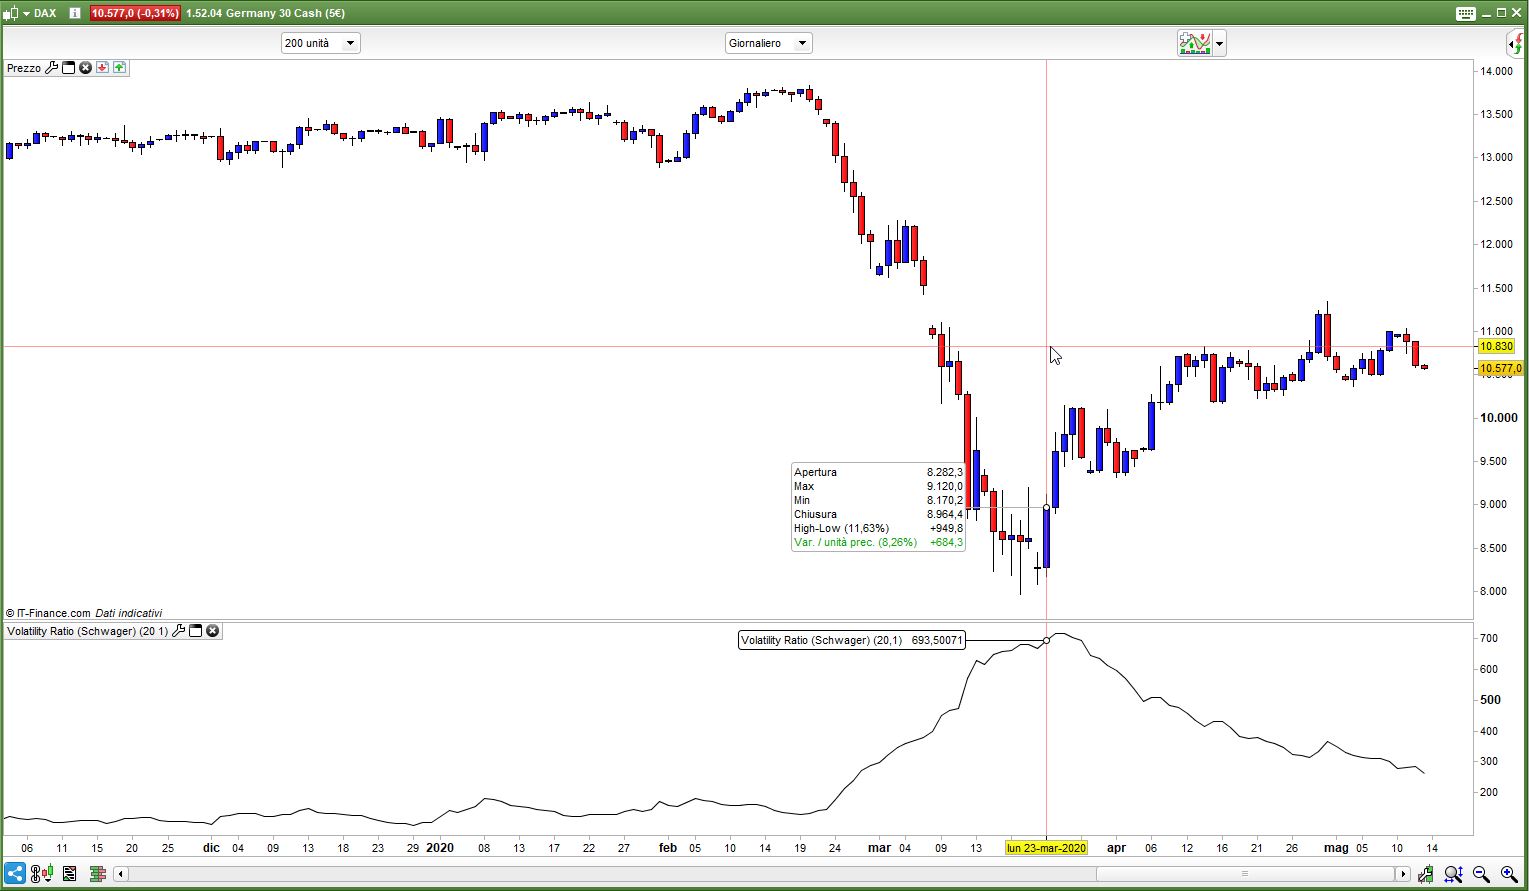
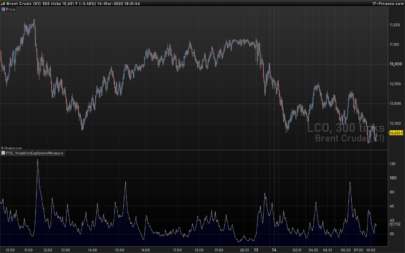
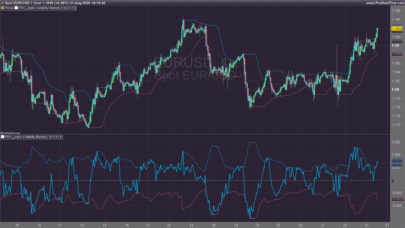
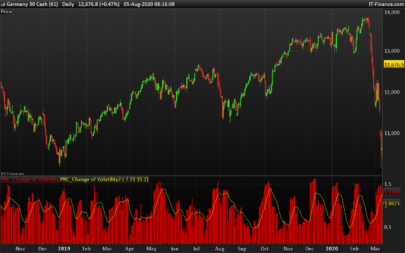
Volatility Ratio (Schwager)
https://www.investopedia.com/terms/v/volatility-ratio.asp
https://www.incrediblecharts.com/indicators/volatility_ratio_schwager.php
|
1 2 3 4 5 6 7 8 9 10 11 |
DEFPARAM CalculateOnLastBars = 1000 //Periods = 20 //AvgT = 0 Periods = max(1,min(999,Periods)) AvgT = max(0,min(6,AvgT)) MyTR1 = high - low MyTR2 = high - close[1] MyTR3 = close[1] - low MyTrueRange = max(MyTR1,max(MyTR2,MyTR3)) VolatilRatio = average[Periods,AvgT](MyTrueRange) RETURN VolatilRatio AS "Volatility Ratio (Schwager)" |
Share this
No information on this site is investment advice or a solicitation to buy or sell any financial instrument. Past performance is not indicative of future results. Trading may expose you to risk of loss greater than your deposits and is only suitable for experienced investors who have sufficient financial means to bear such risk.
ProRealTime ITF files and other attachments :
Find other exclusive trading pro-tools on ![]()
PRC is also on YouTube, subscribe to our channel for exclusive content and tutorials

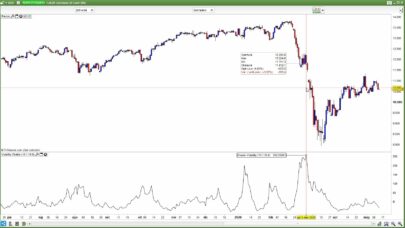
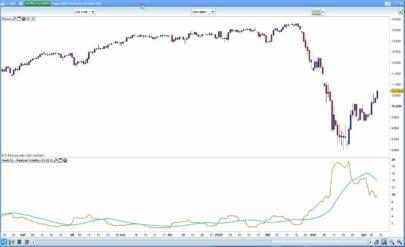
Roberto, I made a modest contribution after reading the two links that you indicated as a reference for the creation of the Schwager volatility indicator. In incrediblecharts.com the calculation of the indicator differs because it uses today’s true range and compares it with the ema of a given period (default = 14). The result is a more nervous indicator, but with an equal scale for all assets (only stocks tested, also in intraday) and a value of attention when the peak exceeds 2. However they are very interesting studies and other contributions are welcome, thanks . This is the code … very simple!
// volatilità Schwager calcolo incrediblecharts.com
x = TR (close)
y = exponentialaverage (x)
mioSchwager= x/y
lineadue=2
return mioSchwager as “volatilità Schwager”, lineadue as “attenzione”
sorry, add prt code add doesn’t work
Don’t worry about PRT code, I can’t make it work either!
Great for pointing that out, it’s really interesting and can be of much help whenever volatility needs to be evaluated for trading opportunities!
Thank you luxrun 🙂
@Luxrun, good morning, you mentionned “y = exponentialaverage (x)”, isn’t the period of the average missing? it works OK as an indicator, but when embedded into a system, there are error messages coming out.