





Trend Volume Profile and Rolling POC
Introduction
A fixed-session volume profile answers “where did volume trade today?”. During a trend the more useful question is “where has volume traded since this move began, and is that level following price?”. The Trend Volume Profile and Rolling POC, by BigBeluga, ties both together: an ATR envelope defines the trend, and as soon as a new trend starts the indicator anchors a volume profile at its first bar and tracks the Point of Control (POC) of that profile on every bar that follows.
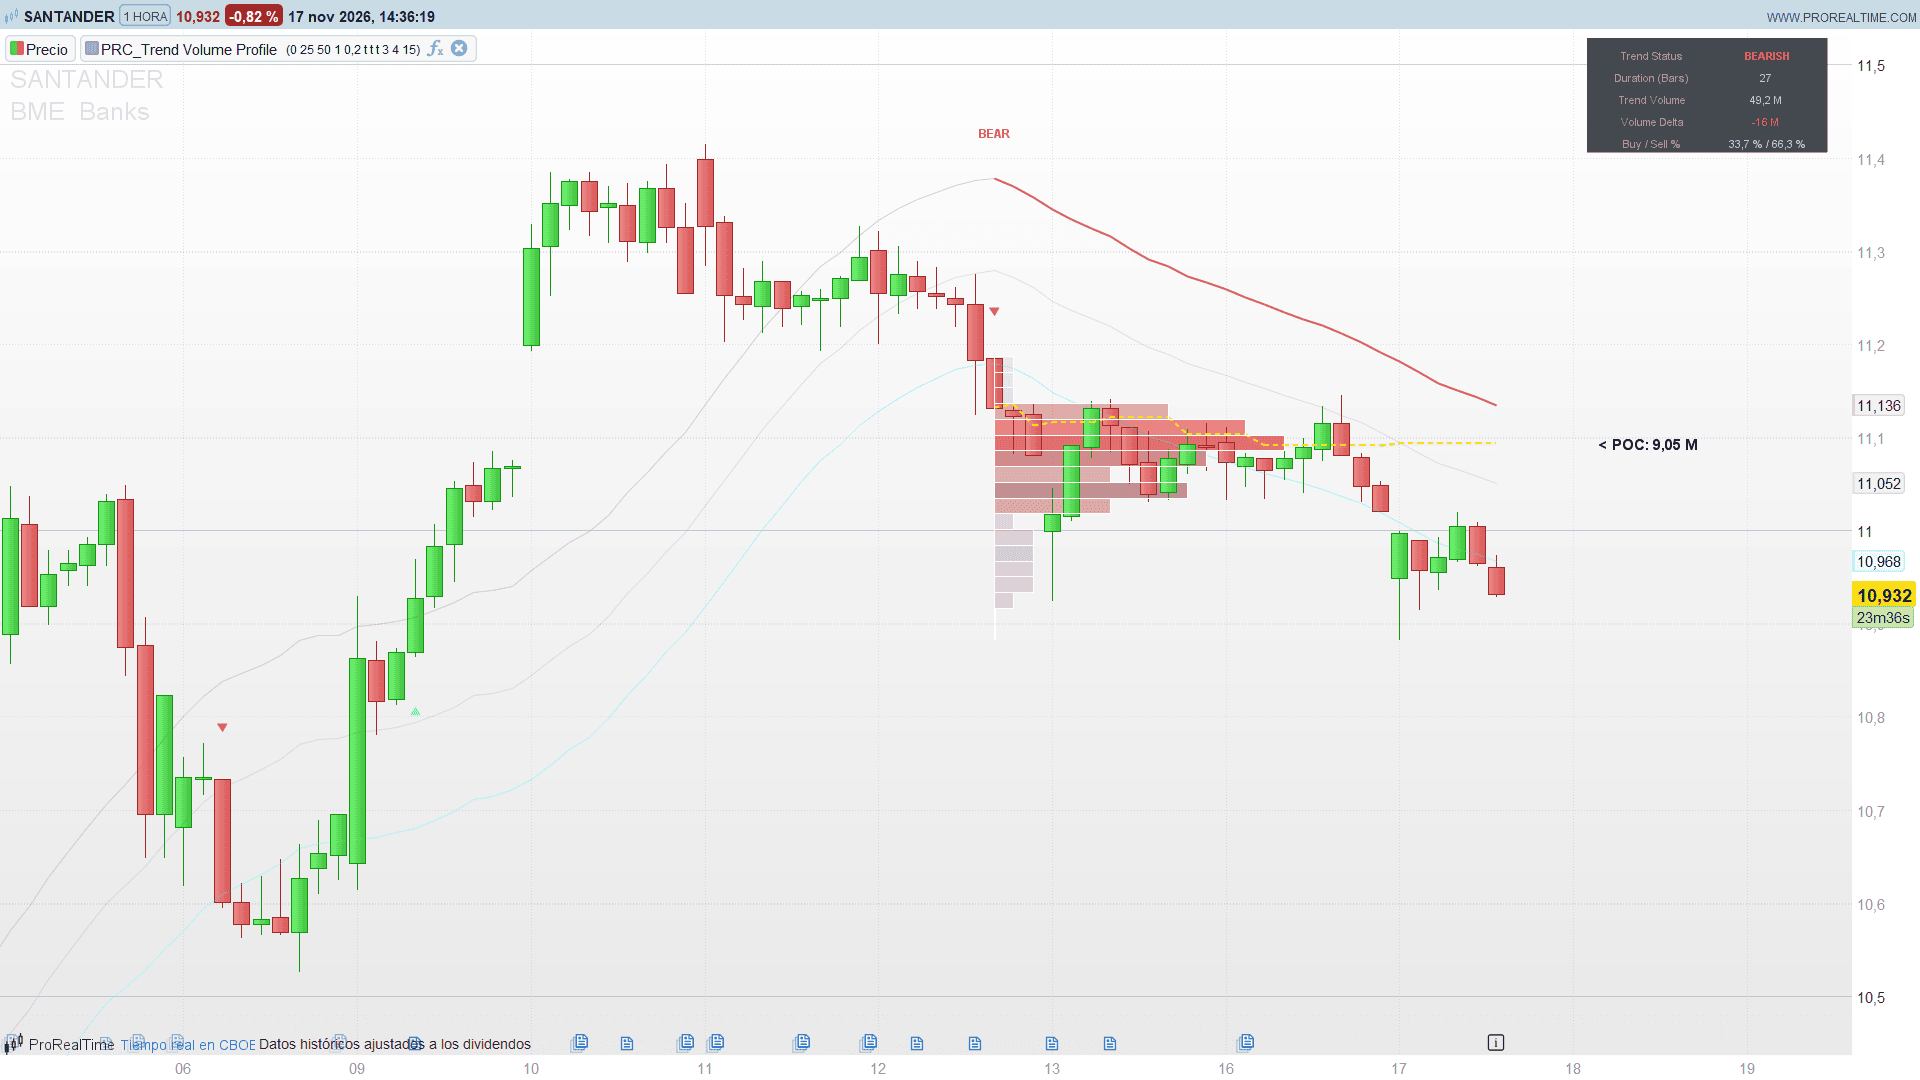
The result is a profile that always describes the current trend, a POC line that shows how the value area migrates with price, and a small panel that summarises the trend: duration, volume, delta and the buy / sell split.
Theory Behind the Indicator
Envelope. A moving average of the close (simple by default, 25 bars) plus and minus one ATR (50 bars). The three lines are drawn faintly in the background.
Trend. A bullish trend starts when the close crosses above the upper band. It turns bearish when, during a bullish trend, the close falls below the lower band, and it turns bullish again on the next cross above the upper band. Each change is marked with a triangle. During the trend, the active band (the lower one in a bullish trend, the upper one in a bearish trend) is drawn from the first bar of the trend as a trailing line.
Volume profile. On every bar, the range between the lowest low and the highest high of the trend is split into rows of 0.2 ATR (between 2 and 100 rows). The volume of each bar of the trend is shared among the rows its high-low range touches, in proportion to the overlap; a bar with no range puts all its volume in its row. The row with the most volume is the POC.
Rolling POC. Because the profile is rebuilt on every bar, the POC has a value on every bar of the trend. Joined together they form the rolling POC line: flat while value is building at one price, stepping when the market accepts a new level.
Trend statistics. Each bar’s volume is split into buying and selling according to where it closed within its range (a close on the high is all buying, a close on the low all selling). The panel adds them up over the trend.
Key Features at a Glance
- ATR envelope with six moving average types: SMA, EMA, WMA, HMA, RMA and VWMA.
- Trend start markers and a trailing trend line with a BULL / BEAR label at the start.
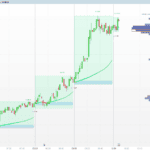
- Volume profile anchored to the first bar of the current trend, coloured with a gradient from the bottom row to the top row and with more opacity for the heavier rows.
- Rolling POC line with a glow and a label showing the POC volume.
- Panel with trend status, duration in bars, trend volume, volume delta and buy / sell percentages.
- Separate colour schemes for bullish and bearish trends.
How to Read the Indicator
- POC rising with price in an uptrend: buyers are accepting higher prices; the trend has support from volume.
- Price far above a flat POC: the move is running ahead of where most of the volume traded. Pullbacks toward the POC are common.
- POC stepping down during an uptrend: volume is concentrating at lower prices, an early warning that the trend is losing strength.
- Profile shape: a single dominant row means one level has absorbed the trend’s volume; several heavy rows spread out mean the trend has been travelling and building value as it goes.
- Delta and buy %: in a healthy bullish trend the buy share stays above 50 % and the delta positive. A bullish trend with a negative delta deserves caution.
Practical Applications
- Pullback entries: buy dips toward the rolling POC in a bullish trend (or sell rallies toward it in a bearish trend), with the trend line as the invalidation level.
- Trend quality filter: compare the duration and the buy / sell split of the current trend with previous ones before adding to a position.
- Targets and exits: when price breaks the trend line, the POC of the trend just ended is a reference for the first reaction.
- Tuning: a smaller Bin Size Multiplier gives a finer profile; a larger ATR multiplier makes the trend changes rarer and the profiles longer.
Indicator Configuration
- maType (default 0): basis average. 0 = SMA, 1 = EMA, 2 = WMA, 3 = HMA, 4 = RMA, 5 = VWMA.
- maLength (default 25): length of the basis average.
- atrLength (default 50): ATR length.
- atrMult (default 1.0): ATR multiplier of the envelope.
- binSizeMult (default 0.2): height of each profile row as a fraction of the ATR. Lower values give more, thinner rows.
- showProfile (default 1): show the anchored volume profile.
- showPoc (default 1): show the rolling POC line and its volume label.
- showTable (default 1): show the trend progression panel.
- anchorLabelSize (default 3): size of the BULL / BEAR label, from 1 (tiny) to 5 (huge).
- pocLabelSize (default 4): size of the POC label, from 1 (tiny) to 5 (huge).
- maxProfileWidth (default 15): number of bars covered by the largest profile row.
The Code
//---------------------------------------------------------------
// PRC_Trend Volume Profile
// version = 0
// 17.11.2026
// Iván González @ www.prorealcode.com
// Author: BigBeluga
// Sharing ProRealTime knowledge
//--------------------------------------------------------------------//
defparam drawonlastbaronly = true
//--------------------------------------------------------------------//
// INPUTS
//--------------------------------------------------------------------//
maType = 0             // basis: 0 = SMA, 1 = EMA, 2 = WMA, 3 = HMA, 4 = RMA, 5 = VWMA
maLength = 25          // basis length
atrLength = 50         // ATR length
atrMult = 1.0          // ATR multiplier of the envelope
binSizeMult = 0.2      // profile bin height as a fraction of the ATR
showProfile = 1        // anchored volume profile (1 = on, 0 = off)
showPoc = 1            // rolling POC line and its volume label
showTable = 1          // trend progression panel (top right)
anchorLabelSize = 3    // BULL / BEAR label: 1 tiny, 2 small, 3 normal, 4 large, 5 huge
pocLabelSize = 4       // POC label: 1 tiny, 2 small, 3 normal, 4 large, 5 huge
maxProfileWidth = 15   // bars covered by the largest profile bin
//--------------------------------------------------------------------//
// BASIS AND ENVELOPE
//--------------------------------------------------------------------//
maS = average[maLength, 0](close)
maE = average[maLength, 1](close)
maW = average[maLength, 2](close)
maH = average[maLength, 7](close)
maR = average[maLength, 3](close)
sumPV = summation[maLength](close * volume)
sumV = summation[maLength](volume)
IF maType = 1 THEN
   basis = maE
ELSIF maType = 2 THEN
   basis = maW
ELSIF maType = 3 THEN
   basis = maH
ELSIF maType = 4 THEN
   basis = maR
ELSIF maType = 5 THEN
   IF sumV > 0 THEN
      basis = sumPV / sumV
   ELSE
      basis = maS
   ENDIF
ELSE
   basis = maS
ENDIF
atrV = averagetruerange[atrLength](close)
upperBand = basis + atrV * atrMult
lowerBand = basis - atrV * atrMult
//--------------------------------------------------------------------//
// TREND STATE
//--------------------------------------------------------------------//
once pendDir = 0
once actDir = 0
once trendStart = 0
once nCh = 0
IF close crosses over upperBand THEN
   pendDir = 1
ELSIF close < lowerBand AND pendDir > 0 THEN
   pendDir = -1
ENDIF
trendChg = 0
IF barindex > 0 THEN
   IF pendDir <> pendDir[1] THEN
      actDir = pendDir
      trendStart = barindex
      trendChg = 1
   ENDIF
ENDIF
// trend change markers (array written at the counter: same slot on every tick)
IF trendChg = 1 THEN
   $chBar[nCh] = barindex
   $chDir[nCh] = actDir
   IF actDir = 1 THEN
      $chPx[nCh] = low - 0.5 * atrV
   ELSE
      $chPx[nCh] = high + 0.5 * atrV
   ENDIF
   nCh = nCh + 1
ENDIF
//--------------------------------------------------------------------//
// VOLUME PROFILE OF THE TREND AND ROLLING POC (every bar)
//--------------------------------------------------------------------//
nBack = max(barindex - trendStart, 0)
IF actDir <> 0 THEN
   rngLo = low
   rngHi = high
   FOR i = 0 TO nBack DO
      rngLo = min(rngLo, low[i])
      rngHi = max(rngHi, high[i])
   NEXT
   spanT = max(rngHi - rngLo, atrV * 0.1)
   binH = max(atrV * binSizeMult, 0.0001)
   nBins = min(max(floor(spanT / binH + 0.5), 2), 100)
   binH = spanT / nBins
   FOR z = 0 TO nBins - 1 DO
      $vb[z] = 0
   NEXT
   FOR i = 0 TO nBack DO
      bLo = low[i]
      bHi = high[i]
      bVol = volume[i]
      bRng = bHi - bLo
      IF bRng <= 0 THEN
         tBin = min(max(floor((bLo - rngLo) / binH), 0), nBins - 1)
         $vb[tBin] = $vb[tBin] + bVol
      ELSE
         fBin = max(floor((bLo - rngLo) / binH), 0)
         lBin = min(floor((bHi - rngLo) / binH), nBins - 1)
         FOR b = fBin TO lBin DO
            edgeLo = rngLo + b * binH
            edgeHi = edgeLo + binH
            ovl = min(bHi, edgeHi) - max(bLo, edgeLo)
            IF ovl > 0 THEN
               $vb[b] = $vb[b] + bVol * (ovl / bRng)
            ENDIF
         NEXT
      ENDIF
   NEXT
   // point of control: first bin with the largest volume
   pocI = 0
   pocV = -1
   FOR z = 0 TO nBins - 1 DO
      IF $vb[z] > pocV THEN
         pocV = $vb[z]
         pocI = z
      ENDIF
   NEXT
   pocP = rngLo + (pocI + 0.5) * binH
ENDIF
//--------------------------------------------------------------------//
// DRAWING (rebuilt on the last bar)
//--------------------------------------------------------------------//
IF islastbarupdate THEN
   IF actDir = 1 THEN
      trnR = 0
      trnG = 242
      trnB = 254
   ELSE
      trnR = 255
      trnG = 88
      trnB = 88
   ENDIF
   // trend change markers (whole history)
   FOR k = 0 TO nCh - 1 DO
      mBar = $chBar[k]
      mPx = $chPx[k]
      IF $chDir[k] = 1 THEN
         DRAWTEXT("▲", mBar, mPx, dialog, bold, 12) COLOURED(0, 242, 254, 255)
      ELSE
         DRAWTEXT("▼", mBar, mPx, dialog, bold, 12) COLOURED(255, 88, 88, 255)
      ENDIF
   NEXT
   // trend boundary: the active band since the trend began
   // (before the first trend, the upper band since it exists)
   IF actDir <> 0 THEN
      nLine = nBack
   ELSE
      nLine = barindex - max(maLength, atrLength) - 1
   ENDIF
   IF nLine > 0 THEN
   FOR k = 0 TO nLine - 1 DO
      IF actDir = 1 THEN
         DRAWSEGMENT(barindex - k - 1, lowerBand[k + 1], barindex - k, lowerBand[k]) COLOURED(trnR, trnG, trnB, 255) STYLE(line, 2)
      ELSE
         DRAWSEGMENT(barindex - k - 1, upperBand[k + 1], barindex - k, upperBand[k]) COLOURED(trnR, trnG, trnB, 255) STYLE(line, 2)
      ENDIF
   NEXT
   ENDIF
   IF actDir <> 0 THEN
      // rolling POC: glow and dotted line
      IF showPoc = 1 THEN
         FOR k = 0 TO nBack - 1 DO
            DRAWSEGMENT(barindex - k - 1, pocP[k + 1], barindex - k, pocP[k]) COLOURED(255, 215, 0, 26) STYLE(line, 5)
            DRAWSEGMENT(barindex - k - 1, pocP[k + 1], barindex - k, pocP[k]) COLOURED(255, 215, 0, 255) STYLE(dottedline, 2)
         NEXT
      ENDIF
      // BULL / BEAR label at the trend start
      IF actDir = 1 THEN
         ancY = lowerBand[nBack] - 0.5 * atrV[nBack]
      ELSE
         ancY = upperBand[nBack] + 0.5 * atrV[nBack]
      ENDIF
      IF actDir = 1 THEN
         IF anchorLabelSize = 1 THEN
            DRAWTEXT("BULL", trendStart, ancY, sansserif, bold, 8) COLOURED(trnR, trnG, trnB, 255)
         ELSIF anchorLabelSize = 2 THEN
            DRAWTEXT("BULL", trendStart, ancY, sansserif, bold, 10) COLOURED(trnR, trnG, trnB, 255)
         ELSIF anchorLabelSize = 4 THEN
            DRAWTEXT("BULL", trendStart, ancY, sansserif, bold, 15) COLOURED(trnR, trnG, trnB, 255)
         ELSIF anchorLabelSize = 5 THEN
            DRAWTEXT("BULL", trendStart, ancY, sansserif, bold, 18) COLOURED(trnR, trnG, trnB, 255)
         ELSE
            DRAWTEXT("BULL", trendStart, ancY, sansserif, bold, 12) COLOURED(trnR, trnG, trnB, 255)
         ENDIF
      ELSE
         IF anchorLabelSize = 1 THEN
            DRAWTEXT("BEAR", trendStart, ancY, sansserif, bold, 8) COLOURED(trnR, trnG, trnB, 255)
         ELSIF anchorLabelSize = 2 THEN
            DRAWTEXT("BEAR", trendStart, ancY, sansserif, bold, 10) COLOURED(trnR, trnG, trnB, 255)
         ELSIF anchorLabelSize = 4 THEN
            DRAWTEXT("BEAR", trendStart, ancY, sansserif, bold, 15) COLOURED(trnR, trnG, trnB, 255)
         ELSIF anchorLabelSize = 5 THEN
            DRAWTEXT("BEAR", trendStart, ancY, sansserif, bold, 18) COLOURED(trnR, trnG, trnB, 255)
         ELSE
            DRAWTEXT("BEAR", trendStart, ancY, sansserif, bold, 12) COLOURED(trnR, trnG, trnB, 255)
         ENDIF
      ENDIF
      // anchored volume profile: gradient by bin position, opacity by volume
      maxBinV = max(pocV, 0)
      IF showProfile = 1 AND maxBinV > 0 THEN
         IF actDir = 1 THEN
            baseR = 46
            baseG = 49
            baseB = 146
            topR = 27
            topG = 255
            topB = 255
         ELSE
            baseR = 58
            baseG = 8
            baseB = 21
            topR = 255
            topG = 88
            topB = 88
         ENDIF
         FOR z = 0 TO nBins - 1 DO
            zVol = $vb[z]
            IF zVol > 0 THEN
               zLo = rngLo + z * binH
               zHi = zLo + binH
               relV = zVol / maxBinV
               xRight = floor(trendStart + relV * maxProfileWidth + 0.5)
               gPos = z / (nBins - 1)
               fR = round(baseR + (topR - baseR) * gPos)
               fG = round(baseG + (topG - baseG) * gPos)
               fB = round(baseB + (topB - baseB) * gPos)
               transp = floor(90 - relV * 65 + 0.5)
               fA = round(255 * (100 - transp) / 100)
               DRAWRECTANGLE(trendStart, zHi, xRight, zLo) COLOURED(255, 255, 255, 255) FILLCOLOR(fR, fG, fB, fA)
            ENDIF
         NEXT
      ENDIF
      // POC volume label to the right of the last bar
      IF showPoc = 1 THEN
         labX = barindex + 8
         IF pocLabelSize = 1 THEN
            DRAWTEXT("< POC: #maxBinV#", labX, pocP, sansserif, bold, 8) COLOURED(0, 0, 0, 255)
         ELSIF pocLabelSize = 2 THEN
            DRAWTEXT("< POC: #maxBinV#", labX, pocP, sansserif, bold, 10) COLOURED(0, 0, 0, 255)
         ELSIF pocLabelSize = 3 THEN
            DRAWTEXT("< POC: #maxBinV#", labX, pocP, sansserif, bold, 12) COLOURED(0, 0, 0, 255)
         ELSIF pocLabelSize = 5 THEN
            DRAWTEXT("< POC: #maxBinV#", labX, pocP, sansserif, bold, 18) COLOURED(0, 0, 0, 255)
         ELSE
            DRAWTEXT("< POC: #maxBinV#", labX, pocP, sansserif, bold, 15) COLOURED(0, 0, 0, 255)
         ENDIF
      ENDIF
      // trend progression panel
      IF showTable = 1 THEN
         totV = 0
         buyV = 0
         sellV = 0
         FOR i = 0 TO nBack DO
            pVol = volume[i]
            pRng = high[i] - low[i]
            IF pRng > 0 THEN
               buyF = (close[i] - low[i]) / pRng
            ELSIF close[i] >= open[i] THEN
               buyF = 1
            ELSE
               buyF = 0
            ENDIF
            totV = totV + pVol
            buyV = buyV + pVol * buyF
            sellV = sellV + pVol * (1 - buyF)
         NEXT
         IF totV > 0 THEN
            buyPct = round(buyV / totV * 1000) / 10
            sellPct = round(sellV / totV * 1000) / 10
         ELSE
            buyPct = 50
            sellPct = 50
         ENDIF
         volDelta = round((buyV - sellV) * 100) / 100
         totVT = round(totV * 100) / 100
         durBars = nBack + 1
         IF volDelta >= 0 THEN
            dR = 0
            dG = 242
            dB = 254
         ELSE
            dR = 255
            dG = 88
            dB = 88
         ENDIF
         DRAWRECTANGLE(-330, -8, -90, -122) ANCHOR(TOPRIGHT, XSHIFT, YSHIFT) COLOURED(48, 54, 61, 128) FILLCOLOR(22, 27, 34, 204)
         DRAWTEXT("Trend Status", -265, -25, sansserif, standard, 11) ANCHOR(TOPRIGHT, XSHIFT, YSHIFT) COLOURED(150, 155, 160, 255)
         DRAWTEXT("Duration (Bars)", -265, -47, sansserif, standard, 11) ANCHOR(TOPRIGHT, XSHIFT, YSHIFT) COLOURED(150, 155, 160, 255)
         DRAWTEXT("Trend Volume", -265, -69, sansserif, standard, 11) ANCHOR(TOPRIGHT, XSHIFT, YSHIFT) COLOURED(150, 155, 160, 255)
         DRAWTEXT("Volume Delta", -265, -91, sansserif, standard, 11) ANCHOR(TOPRIGHT, XSHIFT, YSHIFT) COLOURED(150, 155, 160, 255)
         DRAWTEXT("Buy / Sell %", -265, -113, sansserif, standard, 11) ANCHOR(TOPRIGHT, XSHIFT, YSHIFT) COLOURED(150, 155, 160, 255)
         IF actDir = 1 THEN
            DRAWTEXT("BULLISH", -150, -25, sansserif, bold, 11) ANCHOR(TOPRIGHT, XSHIFT, YSHIFT) COLOURED(trnR, trnG, trnB, 255)
         ELSE
            DRAWTEXT("BEARISH", -150, -25, sansserif, bold, 11) ANCHOR(TOPRIGHT, XSHIFT, YSHIFT) COLOURED(trnR, trnG, trnB, 255)
         ENDIF
         DRAWTEXT("#durBars#", -150, -47, sansserif, standard, 11) ANCHOR(TOPRIGHT, XSHIFT, YSHIFT) COLOURED(199, 203, 208, 255)
         DRAWTEXT("#totVT#", -150, -69, sansserif, standard, 11) ANCHOR(TOPRIGHT, XSHIFT, YSHIFT) COLOURED(199, 203, 208, 255)
         DRAWTEXT("#volDelta#", -150, -91, sansserif, standard, 11) ANCHOR(TOPRIGHT, XSHIFT, YSHIFT) COLOURED(dR, dG, dB, 255)
         DRAWTEXT("#buyPct#% / #sellPct#%", -150, -113, sansserif, standard, 11) ANCHOR(TOPRIGHT, XSHIFT, YSHIFT) COLOURED(199, 203, 208, 255)
      ENDIF
   ENDIF
ENDIF
RETURN upperBand COLOURED(255, 88, 88, 77) AS "Upper Band", lowerBand COLOURED(0, 242, 254, 77) AS "Lower Band", basis COLOURED(120, 123, 134, 51) AS "Basis"