






Bull vs Bear Intraday Session Volume Profiles
Introduction
A volume profile tells you where the volume traded, but not who was in control while it traded. Two price levels with the same volume can mean very different things if one was built by rising candles and the other by falling ones.
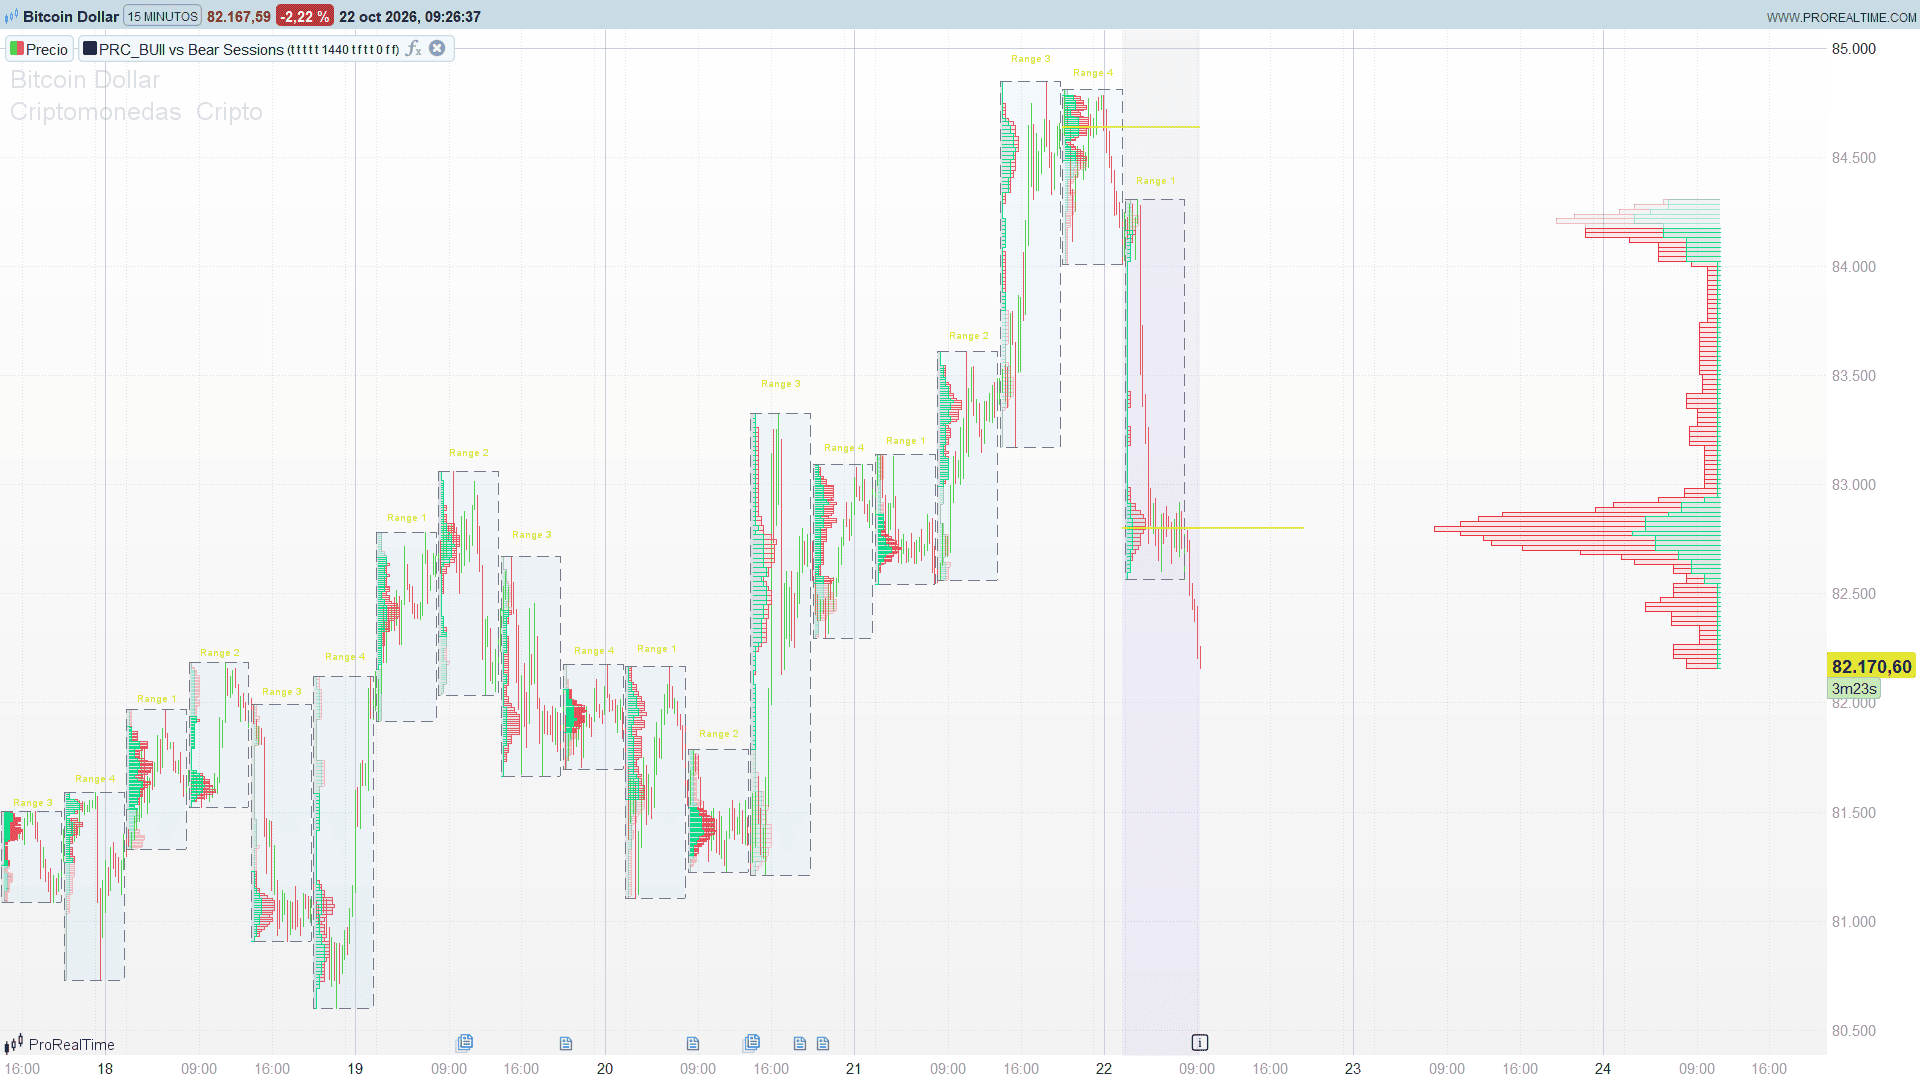
Bull Vs. Bear Market Intraday Sessions by KioseffTrading splits the day into sessions (four sessions of six hours by default) and draws, at the end of each one, a volume profile that separates the volume of the bullish candles from the volume of the bearish candles, row by row. A live profile of the current day sits to the right of the last bar, so you always see who is winning today, level by level.
Theory Behind the Indicator
Sessions. Up to nine sessions are defined in UTC hours. By default four of them are active: 00:00-06:00, 06:00-12:00, 12:00-18:00 and 18:00-24:00, which covers the whole day. When a session ends, its profile is built and drawn inside a box that covers the session.
Bull and bear volume. The price range of the session is split into 100 rows. Each candle of the session spreads its volume evenly over the rows between its low and its high: into the bull column if it closed above its open, into the bear column if it closed below (a candle that closes at its open adds nothing). The result is two histograms per session.
Drawing. For each row, the bull bar starts at the beginning of the session and the bear bar follows it, so the total length of the row is the total volume and the split shows who dominated that level (“Same Side” mode). The “Middle” mode draws bull to the left and bear to the right of the middle of the session instead. The longest row is a quarter of the session length (Scaling Factor 4).
Value area. The value area grows symmetrically around the row with the highest total volume (the POC) until it contains 70% of the bull volume of the session. Rows inside the value area are drawn with a stronger fill and outline; rows outside it are lighter.
Live profile. The current period (one day by default) is profiled the same way, 80 bars wide, growing to the left from 200 bars ahead of the last candle, with a purple background over the candles of the period.
Key Features at a Glance
- Up to nine intraday sessions in UTC, each with its own name and colours.
- Bull and bear volume profile per session, in “Same Side” or “Middle” layout.
- Value area highlighted inside every profile.
- Live profile of the current day (or week, month, or any intraday period).
- Optional POC lines (one per session, or a bull POC and a bear POC) that extend to the right until price touches them, with optional deletion of touched POCs.
- Optional value area lines with the same behaviour.
- Optional delta (bull minus bear volume) per slice of the session, with the total delta above the box.
How to Read the Indicator
- Rows dominated by green were built mostly by rising candles: buyers controlled that price level during the session. Rows dominated by red were built by falling candles.
- A profile where the green dominates the top and the red the bottom shows a session that was bought high and sold low, typical of a rising session; the opposite shape is typical of a falling one.
- The value area shows where most of the session’s activity happened. A new session that opens outside the previous value area is moving away from accepted prices.
- POC lines that are still extending have not been revisited: these “naked” POCs often act as magnets or reaction levels.
- The live profile on the right updates with every bar: compare its shape with the finished sessions to see whether today is building value higher, lower or in the same place.
Practical Applications
- Session context: compare the Asian, European and American parts of the day (adjust the session hours to your market) to see where each session built its value and who controlled it.
- Support and resistance: rows with a strong bull dominance below the price often act as support; rows with a strong bear dominance above it, as resistance.
- Naked POCs as targets: with the POC lines on and deletion of touched POCs enabled, only the untouched POCs stay on the chart.
- Delta by level: the delta labels show, slice by slice, where the session was net buying or net selling.
Indicator Configuration
Sessions:
- showT1 … showT9 (default 1, 1, 1, 1, 0, 0, 0, 0, 0): 1 = show the session.
- t1Start / t1End … t9Start / t9End (defaults 0-600, 600-1200, 1200-1800, 1800-0, then the same four again): session hours in UTC, written as HHMM. An end of 0 is midnight; if the end is lower than the start, the session crosses midnight.
- Session names and colours: in the INIT block of the code (“Range 1” to “Range 9”, bull #14D990 and bear #F24968 by default).
Live profile:
- showLive (default 1): 1 = draw the live profile of the current period.
- liveTF (default 1440): period of the live profile in minutes: 1440 = day, 10080 = week, 43200 = month, or an intraday value such as 240.
- liveUpR/G/B, liveDnR/G/B (default 0, 230, 118 and 242, 54, 69): bull and bear colours of the live profile.
Profiles:
- boxed (default 1): 1 = draw the box and the name of each session.
- nRows (default 100): number of rows of each profile.
- factor (default 4): scaling factor; the longest row is the session length divided by this value.
- sameSide (default 1): 1 = “Same Side” layout, 0 = “Middle”.
Delta:
- showDelta (default 0): 1 = show the delta per slice and the total delta.
- deltaRows (default 20): number of delta slices per session.
- deltaSize (default 1): text size, 1 tiny to 5 huge.
POC:
- showPoc (default 0), deletePoc (default 0), pocType (0 = regular POC, 1 = bull and bear POC), pocShow (default 10 POCs), pocWidth (default 2, from 1 to 5), pocR/G/B (default yellow) and pocTransp (default 25).
Value area:
- showVa (default 0), vaR/G/B (line colour), vaPct (default 70), vaShow (default 20 lines), deleteVa (default 0).
- vaFillTransp / vaLineTransp (default 90 / 0): transparency of the value area fill and outline.
- nonVaFillTransp / nonVaLineTransp (default 95 / 70): transparency of the rest of the profile.
To keep the chart readable, only the most recent profiles are drawn (about the last 16 sessions with the default settings); older sessions keep their box and name. A session that ends while the market is open is drawn the next time the indicator is loaded.
The Code
//---------------------------------------------------------------
// PRC_Bull vs Bear Sessions
// version = 0
// 22.10.2026
// Iván González @ www.prorealcode.com
// Author: KioseffTrading
// Sharing ProRealTime knowledge
//--------------------------------------------------------------------//
defparam drawonlastbaronly = true
//--------------------------------------------------------------------//
// INPUTS
//--------------------------------------------------------------------//
// Sessions in UTC, HHMM (end 0 = midnight). 1 = show, 0 = hide.
// Names and colours of each session are set in the INIT block below.
showT1 = 1
t1Start = 0
t1End = 600
showT2 = 1
t2Start = 600
t2End = 1200
showT3 = 1
t3Start = 1200
t3End = 1800
showT4 = 1
t4Start = 1800
t4End = 0
showT5 = 0
t5Start = 0
t5End = 600
showT6 = 0
t6Start = 600
t6End = 1200
showT7 = 0
t7Start = 1200
t7End = 1800
showT8 = 0
t8Start = 1800
t8End = 0
showT9 = 0
t9Start = 0
t9End = 600
// Live profile of the current period (to the right of the last bar)
showLive = 1
liveTF = 1440 // period in minutes: 1440 = day, 10080 = week, 43200 = month
liveUpR = 0
liveUpG = 230
liveUpB = 118
liveDnR = 242
liveDnG = 54
liveDnB = 69
// Profiles
boxed = 1 // 1 = box and name around each session
nRows = 100 // profile rows (10 to 2000)
factor = 4 // scaling factor: widest row = session bars / factor
sameSide = 1 // 1 = "Same Side" (bull then bear from the session start), 0 = "Middle"
// Delta
showDelta = 0
deltaRows = 20
deltaSize = 1 // 1 tiny, 2 small, 3 normal, 4 large, 5 huge
// POC
showPoc = 0
deletePoc = 0 // 1 = delete POCs once price touches them
pocType = 0 // 0 = regular POC, 1 = bull and bear POC
pocShow = 10 // POCs to show
pocWidth = 2 // 1 to 5
pocR = 255
pocG = 235
pocB = 59
pocTransp = 25
// Value area
showVa = 0
vaR = 120 // value area lines colour
vaG = 123
vaB = 134
vaPct = 70
vaShow = 20
deleteVa = 0
vaFillTransp = 90
vaLineTransp = 0
nonVaFillTransp = 95
nonVaLineTransp = 70
//--------------------------------------------------------------------//
// INIT
//--------------------------------------------------------------------//
ONCE gRing = 80 // sessions whose profile is kept
ONCE bRing = 500 // sessions whose box and name are kept
ONCE lRing = 1000 // POC and value area lines kept
IF barindex = 0 THEN
$on[1] = showT1
$on[2] = showT2
$on[3] = showT3
$on[4] = showT4
$on[5] = showT5
$on[6] = showT6
$on[7] = showT7
$on[8] = showT8
$on[9] = showT9
$hS[1] = t1Start
$hE[1] = t1End
$hS[2] = t2Start
$hE[2] = t2End
$hS[3] = t3Start
$hE[3] = t3End
$hS[4] = t4Start
$hE[4] = t4End
$hS[5] = t5Start
$hE[5] = t5End
$hS[6] = t6Start
$hE[6] = t6End
$hS[7] = t7Start
$hE[7] = t7End
$hS[8] = t8Start
$hE[8] = t8End
$hS[9] = t9Start
$hE[9] = t9End
// INPUTS: bull / bear colour of each session (all #14D990 / #F24968 by default)
FOR k = 1 TO 9 DO
$uR[k] = 20
$uG[k] = 217
$uB[k] = 144
$dR[k] = 242
$dG[k] = 73
$dB[k] = 104
NEXT
// processing order of the sessions, and the profile buffer each one writes into
// (sessions 7 and 8 share the buffers of 4 and 3: it only shows if they end on the same bar)
$ord[0] = 1
$ord[1] = 2
$ord[2] = 4
$ord[3] = 3
$ord[4] = 5
$ord[5] = 6
$ord[6] = 7
$ord[7] = 8
$ord[8] = 9
FOR k = 1 TO 9 DO
$slotOf[k] = k
$slotBar[k] = -1
$sStart[k] = 0
$sM[k] = floor($hS[k] / 100) * 60 + ($hS[k] - floor($hS[k] / 100) * 100)
$eM[k] = floor($hE[k] / 100) * 60 + ($hE[k] - floor($hE[k] / 100) * 100)
NEXT
$slotOf[7] = 4
$slotOf[8] = 3
// name colour: halfway between the bull and bear colours in HSV (shortest way round the hue circle)
FOR k = 1 TO 9 DO
FOR q = 0 TO 1 DO
IF q = 0 THEN
hcR = $uR[k] / 255
hcG = $uG[k] / 255
hcB = $uB[k] / 255
ELSE
hcR = $dR[k] / 255
hcG = $dG[k] / 255
hcB = $dB[k] / 255
ENDIF
cV = max(hcR, max(hcG, hcB))
cC = cV - min(hcR, min(hcG, hcB))
IF cV = 0 THEN
cS = 0
ELSE
cS = cC / cV
ENDIF
IF cC = 0 THEN
cH = 0
ELSIF cV = hcR THEN
cH = 60 * ((hcG - hcB) / cC)
ELSIF cV = hcG THEN
cH = 60 * (2 + (hcB - hcR) / cC)
ELSE
cH = 60 * (4 + (hcR - hcG) / cC)
ENDIF
WHILE cH < 0 DO
cH = cH + 360
WEND
IF cH >= 360 THEN
cH = cH - floor(cH / 360) * 360
ENDIF
$hsvH[q] = cH
$hsvS[q] = cS
$hsvV[q] = cV
NEXT
hd = $hsvH[1] - $hsvH[0] + 540
hd = hd - floor(hd / 360) * 360
mH = $hsvH[0] + 360 + 0.5 * (hd - 180)
mS = $hsvS[0] + ($hsvS[1] - $hsvS[0]) * 0.5
mV = $hsvV[0] + ($hsvV[1] - $hsvV[0]) * 0.5
WHILE mH < 0 DO
mH = mH + 360
WEND
IF mH >= 360 THEN
mH = mH - floor(mH / 360) * 360
ENDIF
IF mS <> 0 AND mV <> 0 THEN
mH = mH / 60
ENDIF
mC = mV * mS
hm2 = mH - floor(mH / 2) * 2
mX = mC * (1 - abs(hm2 - 1))
mM = mV - mC
hxR = mC
hxG = mC
hxB = mC
IF mS > 0 THEN
sec = floor(mH)
IF sec = 0 THEN
hxR = mC
hxG = mX
hxB = 0
ELSIF sec = 1 THEN
hxR = mX
hxG = mC
hxB = 0
ELSIF sec = 2 THEN
hxR = 0
hxG = mC
hxB = mX
ELSIF sec = 3 THEN
hxR = 0
hxG = mX
hxB = mC
ELSIF sec = 4 THEN
hxR = mX
hxG = 0
hxB = mC
ELSE
hxR = mC
hxG = 0
hxB = mX
ENDIF
ENDIF
$nmR[k] = round((mM + hxR) * 255)
$nmG[k] = round((mM + hxG) * 255)
$nmB[k] = round((mM + hxB) * 255)
NEXT
$cnt[0] = 0 // sessions built
$cnt[1] = 0 // polylines created by the historical profiles
$cnt[2] = 0 // POC lines created
$cnt[3] = 0 // value area lines created
$g[0] = -1 // last bar processed
ENDIF
aFV = round(255 * (100 - vaFillTransp) / 100)
aLV = round(255 * (100 - vaLineTransp) / 100)
aFN = round(255 * (100 - nonVaFillTransp) / 100)
aLN = round(255 * (100 - nonVaLineTransp) / 100)
aPoc = round(255 * (100 - pocTransp) / 100)
IF pocType = 0 THEN
pocKeep = pocShow + 1
ELSE
pocKeep = pocShow * 2
ENDIF
atrV = averagetruerange[14](close)
//--------------------------------------------------------------------//
// SESSION CLOCK (UTC, from the bar open)
//--------------------------------------------------------------------//
tsNow = opentimestamp
minNow = floor((tsNow - floor(tsNow / 86400) * 86400) / 60)
IF barindex > 0 THEN
tsPrv = opentimestamp[1]
minPrv = floor((tsPrv - floor(tsPrv / 86400) * 86400) / 60)
ELSE
minPrv = -1
ENDIF
FOR k = 1 TO 9 DO
sMk = $sM[k]
eMk = $eM[k]
inN = 0
inP = 0
IF eMk > sMk THEN
IF minNow >= sMk AND minNow < eMk THEN
inN = 1
ENDIF
IF minPrv >= sMk AND minPrv < eMk THEN
inP = 1
ENDIF
ELSE
IF minNow >= sMk OR minNow < eMk THEN
inN = 1
ENDIF
IF minPrv >= 0 AND (minPrv >= sMk OR minPrv < eMk) THEN
inP = 1
ENDIF
ENDIF
$chg[k] = 0
IF inN = 1 AND inP = 0 THEN
$sStart[k] = barindex
ENDIF
IF inN = 0 AND inP = 1 THEN
$chg[k] = 1
ENDIF
NEXT
//--------------------------------------------------------------------//
// START BAR OF THE LIVE PERIOD
//--------------------------------------------------------------------//
mNow = floor(opentime / 10000) * 60 + floor(opentime / 100) - floor(opentime / 10000) * 100
dsm = dayofweek - 1
IF dsm < 0 THEN
dsm = 6
ENDIF
newP = 0
IF barindex = 0 THEN
newP = 1
ELSIF liveTF >= 43200 THEN
IF month <> month[1] THEN
newP = 1
ENDIF
ELSIF liveTF >= 10080 THEN
IF dsm < dsm[1] THEN
newP = 1
ENDIF
ELSIF liveTF >= 1440 THEN
IF date <> date[1] AND dayofweek[1] <> 0 THEN
newP = 1
ENDIF
ELSE
IF date <> date[1] OR floor(mNow / liveTF) <> floor(mNow[1] / liveTF) THEN
newP = 1
ENDIF
ENDIF
IF newP = 1 THEN
$lpS[0] = barindex
ENDIF
//--------------------------------------------------------------------//
// ENGINE: two passes. The previous bar is caught up if it was the live bar
// (only its POC / value area extension: a session is never built on the
// last bar), then the current bar if it is a closed, historical bar.
//--------------------------------------------------------------------//
FOR pass = 1 DOWNTO 0 DO
doIt = 0
IF pass = 1 THEN
IF barindex >= 1 AND $g[0] < barindex - 1 THEN
doIt = 1
ENDIF
ELSE
IF NOT islastbarupdate THEN
doIt = 1
ENDIF
ENDIF
IF doIt = 1 THEN
nB = barindex - pass
//----- build the sessions that ended on this bar (current bar only)
IF pass = 0 THEN
FOR oi = 0 TO 8 DO
k = $ord[oi]
IF $on[k] = 1 AND $chg[k] = 1 THEN
s0 = $sStart[k]
dF = nB - s0
// price range of the session, without its first bar
IF dF >= 2 THEN
topS = high[1]
botS = low[1]
FOR j = 2 TO dF - 1 DO
topS = max(topS, high[j])
botS = min(botS, low[j])
NEXT
ELSE
topS = 0
botS = 0
ENDIF
IF dF >= 2 AND topS > botS THEN
slot = $slotOf[k]
sb = (slot - 1) * nRows
IF $slotBar[slot] <> nB THEN
$slotBar[slot] = nB
FOR i = 0 TO nRows - 1 DO
$mUp[sb + i] = 0
$mDn[sb + i] = 0
NEXT
ENDIF
stepS = (topS - botS) / (nRows - 1)
FOR i = 0 TO nRows - 1 DO
$lv[i] = botS + stepS * i
NEXT
// spread the volume of every bar of the session over the rows it covers
FOR j = 1 TO dF DO
dirJ = sgn(close[j] - open[j])
IF dirJ <> 0 THEN
FOR q = 0 TO 1 DO
IF q = 0 THEN
vS = high[j]
ELSE
vS = low[j]
ENDIF
lo = 0
hi = nRows
WHILE lo < hi DO
md = floor((lo + hi) / 2)
IF $lv[md] < vS THEN
lo = md + 1
ELSE
hi = md
ENDIF
WEND
IF lo < nRows THEN
IF $lv[lo] = vS THEN
res = lo
ELSE
res = lo - 1
ENDIF
ELSE
res = lo - 1
ENDIF
IF res < 0 THEN
res = 0
ENDIF
$bsr[q] = res
NEXT
l1 = $bsr[0]
l2 = $bsr[1]
vPart = volume[j] / (abs(l1 - l2) + 1)
FOR x = l2 TO l1 DO
IF dirJ > 0 THEN
$mUp[sb + x] = $mUp[sb + x] + vPart
ELSE
$mDn[sb + x] = $mDn[sb + x] + vPart
ENDIF
NEXT
ENDIF
NEXT
oldMin = $mUp[sb]
oldMax = $mUp[sb]
upSum = 0
dnSum = 0
bestT = -1
bestI = 0
bestU = -1
bestUI = 0
bestD = -1
bestDI = 0
FOR i = 0 TO nRows - 1 DO
uIv = $mUp[sb + i]
dIv = $mDn[sb + i]
oldMin = min(oldMin, min(uIv, dIv))
oldMax = max(oldMax, max(uIv, dIv))
upSum = upSum + uIv
dnSum = dnSum + dIv
$pre[i] = upSum
IF uIv + dIv > bestT THEN
bestT = uIv + dIv
bestI = i
ENDIF
IF uIv > bestU THEN
bestU = uIv
bestUI = i
ENDIF
IF dIv > bestD THEN
bestD = dIv
bestDI = i
ENDIF
NEXT
IF oldMax > oldMin THEN
// value area: grows around the POC until it holds vaPct of the BULL volume
det0 = -1
det1 = 9000000000
IF upSum > 0 THEN
FOR i = 1 TO nRows - 1 DO
vaLo = max(bestI - i, 0)
vaHi = min(bestI + i + 1, nRows) - 1
IF vaLo > 0 THEN
sumVa = $pre[vaHi] - $pre[vaLo - 1]
ELSE
sumVa = $pre[vaHi]
ENDIF
IF sumVa / upSum >= vaPct / 100 THEN
det0 = vaLo
det1 = min(bestI + i, nRows - 1)
BREAK
ENDIF
NEXT
ENDIF
// geometry slot of this session
gIdx = $cnt[0]
gp = gIdx MOD gRing
gb = gp * nRows
avgX = round((nB + s0) / 2)
IF sameSide = 1 THEN
finX = s0
baseU = s0 + 1
ELSE
finX = avgX
baseU = avgX - 1
ENDIF
newRange = floor((nB - s0) / factor)
FOR i = 0 TO nRows - 2 DO
cU = 1 + (($mUp[sb + i] - oldMin) / (oldMax - oldMin)) * (newRange - 1)
cD = 1 + (($mDn[sb + i] - oldMin) / (oldMax - oldMin)) * (newRange - 1)
IF sameSide = 1 THEN
xU = max(s0 + cU, s0 + 1)
xD = max(s0 + cD, s0 + 1)
adjD = xU + (xD - (s0 + 1))
ELSE
xU = min(avgX - cU, avgX - 1)
adjD = max(avgX + cD, avgX + 1)
ENDIF
$gU[gb + i] = round(xU)
$gD[gb + i] = round(adjD)
NEXT
$gK[gp] = k
$gBot[gp] = botS
$gStp[gp] = stepS
$gFin[gp] = finX
$gBase[gp] = baseU
$gD0[gp] = det0
$gD1[gp] = det1
// outlines of this profile, counted in creation order (only the newest 100 are kept)
hasBelow = 0
IF det0 > 0 THEN
hasBelow = 1
ENDIF
hasAbove = 0
IF det1 < nRows - 2 THEN
hasAbove = 1
ENDIF
$gHB[gp] = hasBelow
$gHA[gp] = hasAbove
$gSeq[gp] = $cnt[1]
$cnt[1] = $cnt[1] + 2 + 2 * hasBelow + 2 * hasAbove
// delta per slice of the session range
nLab = 0
IF boxed = 1 THEN
nLab = 1
ENDIF
IF showDelta = 1 THEN
nLab = nLab + deltaRows + 1
dSl = (topS - botS) / deltaRows
FOR r = 0 TO deltaRows - 1 DO
FOR q = 0 TO 1 DO
IF q = 0 THEN
vS = botS + dSl * (r + 1)
ELSE
vS = botS + dSl * r
ENDIF
lo = 0
hi = nRows
WHILE lo < hi DO
md = floor((lo + hi) / 2)
IF $lv[md] < vS THEN
lo = md + 1
ELSE
hi = md
ENDIF
WEND
IF lo < nRows THEN
IF $lv[lo] = vS THEN
res = lo
ELSE
res = lo - 1
ENDIF
ELSE
res = lo - 1
ENDIF
IF res < 0 THEN
res = 0
ENDIF
$bsr[q] = res
NEXT
dSum = 0
FOR x = $bsr[1] TO $bsr[0] DO
dSum = dSum + $mUp[sb + x] - $mDn[sb + x]
NEXT
$gDel[gp * deltaRows + r] = dSum
NEXT
$gTot[gp] = upSum - dnSum
$gTotY[gp] = topS + atrV * 4
$gMidX[gp] = avgX
ENDIF
$gLab[gp] = nLab
// box and name
bp = gIdx MOD bRing
$bS[bp] = s0
$bE[bp] = nB - 1
$bT[bp] = topS
$bB[bp] = botS
$bK[bp] = k
$bA[bp] = atrV
$bGI[bp] = gIdx
$cnt[0] = gIdx + 1
// value area lines (created before the POC)
IF showVa = 1 THEN
IF sameSide = 1 THEN
vaX1 = s0
ELSE
vaX1 = avgX
ENDIF
IF det0 < 0 THEN
vaY1 = $lv[nRows - 1]
ELSE
vaY1 = $lv[det0]
ENDIF
vaY2 = $lv[min(det1 + 1, nRows - 1)]
FOR q = 0 TO 1 DO
lp = $cnt[3] MOD lRing
IF q = 0 THEN
$vY[lp] = vaY1
ELSE
$vY[lp] = vaY2
ENDIF
$vX1[lp] = vaX1
$vX2[lp] = nB
$vDel[lp] = 0
$cnt[3] = $cnt[3] + 1
NEXT
ENDIF
// POC lines
IF showPoc = 1 THEN
IF sameSide = 1 THEN
pX1 = max(s0, nB - 999)
ELSE
pX1 = avgX
ENDIF
IF pocType = 0 THEN
nPl = 1
ELSE
nPl = 2
ENDIF
FOR q = 1 TO nPl DO
IF pocType = 0 THEN
pI = bestI
pC = 0
ELSIF q = 1 THEN
pI = bestUI
pC = 1
ELSE
pI = bestDI
pC = 2
ENDIF
lp = $cnt[2] MOD lRing
$pY[lp] = ($lv[pI] + $lv[min(pI + 1, nRows - 1)]) / 2
$pX1[lp] = pX1
$pX2[lp] = nB
$pC[lp] = pC
$pK[lp] = k
$pDel[lp] = 0
$cnt[2] = $cnt[2] + 1
NEXT
ENDIF
ENDIF
ENDIF
ENDIF
NEXT
ENDIF
//----- POC and value area lines: extend to this bar while price has not touched them
hiB = high[pass]
loB = low[pass]
IF showPoc = 1 THEN
nL = $cnt[2]
FOR j = max(0, nL - pocKeep) TO nL - 1 DO
lp = j MOD lRing
IF $pDel[lp] = 0 THEN
IF hiB < $pY[lp] OR loB > $pY[lp] THEN
IF $pX2[lp] = nB - 1 THEN
$pX2[lp] = nB
ENDIF
ELSIF deletePoc = 1 THEN
$pDel[lp] = 1
ENDIF
IF deletePoc = 1 AND $pX2[lp] <> nB THEN
$pDel[lp] = 1
ENDIF
ENDIF
NEXT
ENDIF
IF showVa = 1 THEN
nL = $cnt[3]
FOR j = max(0, nL - vaShow) TO nL - 1 DO
lp = j MOD lRing
IF $vDel[lp] = 0 THEN
IF hiB < $vY[lp] OR loB > $vY[lp] THEN
IF $vX2[lp] = nB - 1 THEN
$vX2[lp] = nB
ENDIF
ELSIF deleteVa = 1 THEN
$vDel[lp] = 1
ENDIF
IF deleteVa = 1 AND $vX2[lp] <> nB THEN
$vDel[lp] = 1
ENDIF
ENDIF
NEXT
ENDIF
$g[0] = nB
ENDIF
NEXT
//--------------------------------------------------------------------//
// DRAWING (last bar only)
//--------------------------------------------------------------------//
IF islastbarupdate THEN
nLivePoly = 0
nLiveLab = 0
liveG = gRing
//----- live profile, built into the spare geometry slot
IF showLive = 1 THEN
lS = $lpS[0]
nbL = barindex - lS
topL = high
botL = low
FOR j = 1 TO nbL DO
topL = max(topL, high[j])
botL = min(botL, low[j])
NEXT
IF topL > botL THEN
lsb = 9 * nRows
stepL = (topL - botL) / (nRows - 1)
FOR i = 0 TO nRows - 1 DO
$lv[i] = botL + stepL * i
$mUp[lsb + i] = 0
$mDn[lsb + i] = 0
NEXT
FOR j = 0 TO nbL DO
dirJ = sgn(close[j] - open[j])
IF dirJ <> 0 THEN
FOR q = 0 TO 1 DO
IF q = 0 THEN
vS = high[j]
ELSE
vS = low[j]
ENDIF
lo = 0
hi = nRows
WHILE lo < hi DO
md = floor((lo + hi) / 2)
IF $lv[md] < vS THEN
lo = md + 1
ELSE
hi = md
ENDIF
WEND
IF lo < nRows THEN
IF $lv[lo] = vS THEN
res = lo
ELSE
res = lo - 1
ENDIF
ELSE
res = lo - 1
ENDIF
IF res < 0 THEN
res = 0
ENDIF
$bsr[q] = res
NEXT
l1 = $bsr[0]
l2 = $bsr[1]
vPart = volume[j] / (abs(l1 - l2) + 1)
FOR x = l2 TO l1 DO
IF dirJ > 0 THEN
$mUp[lsb + x] = $mUp[lsb + x] + vPart
ELSE
$mDn[lsb + x] = $mDn[lsb + x] + vPart
ENDIF
NEXT
ENDIF
NEXT
oldMin = $mUp[lsb]
oldMax = $mUp[lsb]
upSum = 0
dnSum = 0
bestT = -1
bestI = 0
bestU = -1
bestUI = 0
bestD = -1
bestDI = 0
FOR i = 0 TO nRows - 1 DO
uIv = $mUp[lsb + i]
dIv = $mDn[lsb + i]
oldMin = min(oldMin, min(uIv, dIv))
oldMax = max(oldMax, max(uIv, dIv))
upSum = upSum + uIv
dnSum = dnSum + dIv
$pre[i] = upSum
IF uIv + dIv > bestT THEN
bestT = uIv + dIv
bestI = i
ENDIF
IF uIv > bestU THEN
bestU = uIv
bestUI = i
ENDIF
IF dIv > bestD THEN
bestD = dIv
bestDI = i
ENDIF
NEXT
IF oldMax > oldMin THEN
det0 = -1
det1 = 9000000000
IF upSum > 0 THEN
FOR i = 1 TO nRows - 1 DO
vaLo = max(bestI - i, 0)
vaHi = min(bestI + i + 1, nRows) - 1
IF vaLo > 0 THEN
sumVa = $pre[vaHi] - $pre[vaLo - 1]
ELSE
sumVa = $pre[vaHi]
ENDIF
IF sumVa / upSum >= vaPct / 100 THEN
det0 = vaLo
det1 = min(bestI + i, nRows - 1)
BREAK
ENDIF
NEXT
ENDIF
// the live profile grows to the LEFT from 200 bars ahead (80 bars wide)
sI = barindex + 200
avgX = barindex + 100
IF sameSide = 1 THEN
finX = sI
baseU = sI
ELSE
finX = avgX
baseU = avgX
ENDIF
gb = liveG * nRows
FOR i = 0 TO nRows - 2 DO
cU = 1 + (($mUp[lsb + i] - oldMin) / (oldMax - oldMin)) * 79
cD = 1 + (($mDn[lsb + i] - oldMin) / (oldMax - oldMin)) * 79
IF sameSide = 1 THEN
xU = min(sI - 1, sI - cU)
xD = min(sI - cD, sI - 1)
adjD = xU + (xD - (sI + 1))
ELSE
xU = min(avgX - cU, avgX - 1)
adjD = max(avgX + cD, avgX + 1)
ENDIF
$gU[gb + i] = round(xU)
$gD[gb + i] = round(adjD)
NEXT
$gK[liveG] = 0
$gBot[liveG] = botL
$gStp[liveG] = stepL
$gFin[liveG] = finX
$gBase[liveG] = baseU
$gD0[liveG] = det0
$gD1[liveG] = det1
hasBelow = 0
IF det0 > 0 THEN
hasBelow = 1
ENDIF
hasAbove = 0
IF det1 < nRows - 2 THEN
hasAbove = 1
ENDIF
$gHB[liveG] = hasBelow
$gHA[liveG] = hasAbove
nLivePoly = 2 + 2 * hasBelow + 2 * hasAbove
// background of the live period
DRAWRECTANGLE(lS, topL + 50 * atrV, barindex, botL - 50 * atrV) COLOURED(105, 41, 242, 0) FILLCOLOR(105, 41, 242, 13)
// live value area lines
IF showVa = 1 THEN
IF det0 < 0 THEN
vaY1 = $lv[nRows - 1]
ELSE
vaY1 = $lv[det0]
ENDIF
vaY2 = $lv[min(det1 + 1, nRows - 1)]
DRAWSEGMENT(finX, vaY1, lS, vaY1) COLOURED(vaR, vaG, vaB, 255)
DRAWSEGMENT(finX, vaY2, lS, vaY2) COLOURED(vaR, vaG, vaB, 255)
ENDIF
// live POC
IF showPoc = 1 THEN
pX1 = max(lS, barindex - 999)
IF pocType = 0 THEN
nPl = 1
ELSE
nPl = 2
ENDIF
FOR q = 1 TO nPl DO
IF pocType = 0 THEN
pI = bestI
cr = pocR
cg = pocG
cb = pocB
ELSIF q = 1 THEN
pI = bestUI
cr = liveUpR
cg = liveUpG
cb = liveUpB
ELSE
pI = bestDI
cr = liveDnR
cg = liveDnG
cb = liveDnB
ENDIF
pYv = ($lv[pI] + $lv[min(pI + 1, nRows - 1)]) / 2
IF pocWidth <= 1 THEN
DRAWSEGMENT(pX1, pYv, barindex + 40, pYv) COLOURED(cr, cg, cb, aPoc) STYLE(line, 1)
ELSIF pocWidth = 2 THEN
DRAWSEGMENT(pX1, pYv, barindex + 40, pYv) COLOURED(cr, cg, cb, aPoc) STYLE(line, 2)
ELSIF pocWidth = 3 THEN
DRAWSEGMENT(pX1, pYv, barindex + 40, pYv) COLOURED(cr, cg, cb, aPoc) STYLE(line, 3)
ELSIF pocWidth = 4 THEN
DRAWSEGMENT(pX1, pYv, barindex + 40, pYv) COLOURED(cr, cg, cb, aPoc) STYLE(line, 4)
ELSE
DRAWSEGMENT(pX1, pYv, barindex + 40, pYv) COLOURED(cr, cg, cb, aPoc) STYLE(line, 5)
ENDIF
NEXT
ENDIF
// live delta
IF showDelta = 1 THEN
nLiveLab = deltaRows + 1
dSl = (topL - botL) / deltaRows
FOR r = 0 TO deltaRows - 1 DO
FOR q = 0 TO 1 DO
IF q = 0 THEN
vS = botL + dSl * (r + 1)
ELSE
vS = botL + dSl * r
ENDIF
lo = 0
hi = nRows
WHILE lo < hi DO
md = floor((lo + hi) / 2)
IF $lv[md] < vS THEN
lo = md + 1
ELSE
hi = md
ENDIF
WEND
IF lo < nRows THEN
IF $lv[lo] = vS THEN
res = lo
ELSE
res = lo - 1
ENDIF
ELSE
res = lo - 1
ENDIF
IF res < 0 THEN
res = 0
ENDIF
$bsr[q] = res
NEXT
dSum = 0
FOR x = $bsr[1] TO $bsr[0] DO
dSum = dSum + $mUp[lsb + x] - $mDn[lsb + x]
NEXT
$gDel[liveG * deltaRows + r] = dSum
NEXT
$gTot[liveG] = upSum - dnSum
$gTotY[liveG] = topL + atrV * 4
$gMidX[liveG] = barindex + 225
ENDIF
ENDIF
ENDIF
ENDIF
//----- profiles: the newest 100 polylines, the live ones included
nHist = $cnt[0]
visFrom = $cnt[1] - (100 - nLivePoly)
FOR pp = 0 TO min(nHist, gRing) DO
IF pp = 0 THEN
gp = liveG
isLive = 1
ELSE
gp = (nHist - pp) MOD gRing
isLive = 0
ENDIF
okP = 1
IF isLive = 1 THEN
IF nLivePoly = 0 THEN
okP = 0
ENDIF
seq0 = 0
ELSE
seq0 = $gSeq[gp]
IF seq0 + 2 + 2 * $gHB[gp] + 2 * $gHA[gp] <= visFrom THEN
okP = 0
ENDIF
ENDIF
IF okP = 1 THEN
IF isLive = 1 THEN
puR = liveUpR
puG = liveUpG
puB = liveUpB
pdR = liveDnR
pdG = liveDnG
pdB = liveDnB
ELSE
kk = $gK[gp]
puR = $uR[kk]
puG = $uG[kk]
puB = $uB[kk]
pdR = $dR[kk]
pdG = $dG[kk]
pdB = $dB[kk]
ENDIF
gb = gp * nRows
bot0 = $gBot[gp]
stp0 = $gStp[gp]
finX = $gFin[gp]
baseU = $gBase[gp]
det0 = $gD0[gp]
det1 = $gD1[gp]
hB0 = $gHB[gp]
hA0 = $gHA[gp]
// groups in creation order: below the value area, above it, the value area
seqG = seq0
FOR grp = 0 TO 2 DO
IF grp = 0 THEN
rA = 0
rB = det0 - 1
hasG = hB0
ELSIF grp = 1 THEN
rA = det1 + 1
rB = nRows - 2
hasG = hA0
ELSE
rA = max(det0, 0)
rB = min(det1, nRows - 2)
hasG = 1
ENDIF
IF hasG = 1 THEN
IF grp = 2 THEN
aF = aFV
aL = aLV
ELSE
aF = aFN
aL = aLN
ENDIF
// bear polyline first, then bull (each one counts as a polyline)
FOR ply = 0 TO 1 DO
visP = 1
IF isLive = 0 AND seqG + ply < visFrom THEN
visP = 0
ENDIF
IF visP = 1 THEN
IF ply = 0 THEN
cr = pdR
cg = pdG
cb = pdB
ELSE
cr = puR
cg = puG
cb = puB
ENDIF
yFirst = bot0 + stp0 * rA
IF ply = 0 THEN
xFirst = $gD[gb + rA]
ELSE
xFirst = $gU[gb + rA]
ENDIF
DRAWSEGMENT(finX, yFirst, xFirst, yFirst) COLOURED(cr, cg, cb, aL)
FOR i = rA TO rB DO
yA = bot0 + stp0 * i
yB = bot0 + stp0 * (i + 1)
xUi = $gU[gb + i]
IF ply = 0 THEN
xEdge = $gD[gb + i]
xMid = xUi
ELSE
xEdge = xUi
xMid = baseU
ENDIF
IF i < rB THEN
IF ply = 0 THEN
xNext = $gD[gb + i + 1]
ELSE
xNext = $gU[gb + i + 1]
ENDIF
ELSE
xNext = finX
ENDIF
DRAWRECTANGLE(finX, yA, xEdge, yB) COLOURED(cr, cg, cb, 0) FILLCOLOR(cr, cg, cb, aF)
DRAWSEGMENT(xEdge, yA, xEdge, yB) COLOURED(cr, cg, cb, aL)
hzA = min(xEdge, min(xMid, xNext))
hzB = max(xEdge, max(xMid, xNext))
DRAWSEGMENT(hzA, yB, hzB, yB) COLOURED(cr, cg, cb, aL)
NEXT
ENDIF
NEXT
seqG = seqG + 2
ENDIF
NEXT
ENDIF
NEXT
//----- boxes, names and delta labels (newest 500 boxes and newest 500 labels)
// pp = 0 is the live profile: its labels are the newest ones
labLeft = 500
FOR pp = 0 TO min(nHist, bRing) DO
IF pp = 0 THEN
isLive = 1
gp = liveG
kk = 0
hasD = 0
IF nLiveLab > 0 THEN
hasD = 1
ENDIF
dTopV = $gTotY[liveG] - 4 * atrV
dBotV = $gBot[liveG]
atrB = atrV
cuR = liveUpR
cuG = liveUpG
cuB = liveUpB
cdR = liveDnR
cdG = liveDnG
cdB = liveDnB
ELSE
isLive = 0
bp = (nHist - pp) MOD bRing
gI = $bGI[bp]
gp = gI MOD gRing
kk = $bK[bp]
hasD = 0
IF nHist - gI <= gRing THEN
hasD = 1
ENDIF
dTopV = $bT[bp]
dBotV = $bB[bp]
atrB = $bA[bp]
cuR = $uR[kk]
cuG = $uG[kk]
cuB = $uB[kk]
cdR = $dR[kk]
cdG = $dG[kk]
cdB = $dB[kk]
ENDIF
// delta labels of this session: created after its name, total last; drawn newest first
IF showDelta = 1 AND hasD = 1 THEN
IF labLeft > 0 THEN
totV = round($gTot[gp])
tY = $gTotY[gp] + 0.5 * atrB
tX = $gMidX[gp]
IF totV > 0 THEN
DRAWTEXT("#totV#", tX, tY, Dialog, Standard, 12) COLOURED(cuR, cuG, cuB, 255)
ELSIF totV < 0 THEN
DRAWTEXT("#totV#", tX, tY, Dialog, Standard, 12) COLOURED(cdR, cdG, cdB, 255)
ELSE
DRAWTEXT("#totV#", tX, tY, Dialog, Standard, 12) COLOURED(120, 123, 134, 255)
ENDIF
ENDIF
labLeft = labLeft - 1
// gradient bounds: the positive set keeps one zero if there is any,
// the negative set drops the value nearest zero when there is no zero
posMin = 0
posMax = 0
nPos = 0
nZero = 0
nNeg = 0
negMin = 0
negTop = 0
FOR r = 0 TO deltaRows - 1 DO
dv = $gDel[gp * deltaRows + r]
IF dv > 0 THEN
IF nPos = 0 THEN
posMin = dv
posMax = dv
ELSE
posMin = min(posMin, dv)
posMax = max(posMax, dv)
ENDIF
nPos = nPos + 1
ELSIF dv = 0 THEN
nZero = nZero + 1
ELSE
IF nNeg = 0 THEN
negMin = dv
negTop = dv
ELSE
negMin = min(negMin, dv)
negTop = max(negTop, dv)
ENDIF
nNeg = nNeg + 1
ENDIF
NEXT
IF nPos > 0 AND nZero > 0 THEN
posMin = 0
ENDIF
negOk = 0
negMax = 0
IF nNeg > 0 AND nZero > 0 THEN
negMax = negTop
negOk = 1
ELSIF nNeg >= 2 THEN
negMax = negMin
FOR r = 0 TO deltaRows - 1 DO
dv = $gDel[gp * deltaRows + r]
IF dv < negTop AND dv > negMax THEN
negMax = dv
ENDIF
NEXT
negOk = 1
ENDIF
dSlc = (dTopV - dBotV) / deltaRows
dXc = $gMidX[gp]
FOR r = deltaRows - 1 DOWNTO 0 DO
IF labLeft > 0 THEN
dv = $gDel[gp * deltaRows + r]
dY = dBotV + dSlc * r + dSlc / 2
dTxt = round(dv)
IF dv > 0 THEN
IF posMax > posMin THEN
fr = min(1, max(0, (dv - posMin) / (posMax - posMin)))
ELSE
fr = 0
ENDIF
tA = round(255 * (0.5 + 0.4 * fr))
txR = cuR
txG = cuG
txB = cuB
ELSIF dv < 0 THEN
tA = 0
IF negOk = 1 THEN
IF negMin < negMax THEN
fr = min(1, max(0, (dv - negMax) / (negMin - negMax)))
ELSE
fr = 0
ENDIF
tA = round(255 * (0.9 - 0.4 * fr))
ENDIF
txR = cdR
txG = cdG
txB = cdB
ELSE
tA = 64
txR = 120
txG = 123
txB = 134
ENDIF
IF deltaSize <= 1 THEN
DRAWTEXT("#dTxt#", dXc, dY, Dialog, Standard, 8) COLOURED(txR, txG, txB, tA)
ELSIF deltaSize = 2 THEN
DRAWTEXT("#dTxt#", dXc, dY, Dialog, Standard, 10) COLOURED(txR, txG, txB, tA)
ELSIF deltaSize = 3 THEN
DRAWTEXT("#dTxt#", dXc, dY, Dialog, Standard, 12) COLOURED(txR, txG, txB, tA)
ELSIF deltaSize = 4 THEN
DRAWTEXT("#dTxt#", dXc, dY, Dialog, Standard, 16) COLOURED(txR, txG, txB, tA)
ELSE
DRAWTEXT("#dTxt#", dXc, dY, Dialog, Standard, 22) COLOURED(txR, txG, txB, tA)
ENDIF
ENDIF
labLeft = labLeft - 1
NEXT
ENDIF
// session name (label above the box) and box
IF boxed = 1 AND isLive = 0 THEN
IF labLeft > 0 THEN
nmX = round(($bS[bp] + $bE[bp]) / 2)
nmY = $bT[bp] + 0.5 * $bA[bp]
nr = $nmR[kk]
ng = $nmG[kk]
nmb = $nmB[kk]
IF kk = 1 THEN
DRAWTEXT("Range 1", nmX, nmY, Dialog, Standard, 10) COLOURED(nr, ng, nmb, 255)
ELSIF kk = 2 THEN
DRAWTEXT("Range 2", nmX, nmY, Dialog, Standard, 10) COLOURED(nr, ng, nmb, 255)
ELSIF kk = 3 THEN
DRAWTEXT("Range 3", nmX, nmY, Dialog, Standard, 10) COLOURED(nr, ng, nmb, 255)
ELSIF kk = 4 THEN
DRAWTEXT("Range 4", nmX, nmY, Dialog, Standard, 10) COLOURED(nr, ng, nmb, 255)
ELSIF kk = 5 THEN
DRAWTEXT("Range 5", nmX, nmY, Dialog, Standard, 10) COLOURED(nr, ng, nmb, 255)
ELSIF kk = 6 THEN
DRAWTEXT("Range 6", nmX, nmY, Dialog, Standard, 10) COLOURED(nr, ng, nmb, 255)
ELSIF kk = 7 THEN
DRAWTEXT("Range 7", nmX, nmY, Dialog, Standard, 10) COLOURED(nr, ng, nmb, 255)
ELSIF kk = 8 THEN
DRAWTEXT("Range 8", nmX, nmY, Dialog, Standard, 10) COLOURED(nr, ng, nmb, 255)
ELSE
DRAWTEXT("Range 9", nmX, nmY, Dialog, Standard, 10) COLOURED(nr, ng, nmb, 255)
ENDIF
ENDIF
labLeft = labLeft - 1
// box border: grey dashed
DRAWRECTANGLE($bS[bp], $bT[bp], $bE[bp], $bB[bp]) COLOURED(120, 123, 134, 255) STYLE(dottedline2, 1) FILLCOLOR(33, 150, 243, 13)
ENDIF
NEXT
//----- POC lines: the newest ones, extended on the live bar as well
IF showPoc = 1 THEN
nL = $cnt[2]
FOR j = max(0, nL - pocKeep) TO nL - 1 DO
lp = j MOD lRing
delP = $pDel[lp]
x2P = $pX2[lp]
IF delP = 0 THEN
IF high < $pY[lp] OR low > $pY[lp] THEN
IF x2P = barindex - 1 THEN
x2P = barindex
ENDIF
ELSIF deletePoc = 1 THEN
delP = 1
ENDIF
IF deletePoc = 1 AND x2P <> barindex THEN
delP = 1
ENDIF
ENDIF
IF delP = 0 THEN
pYv = $pY[lp]
kk = $pK[lp]
IF $pC[lp] = 0 THEN
cr = pocR
cg = pocG
cb = pocB
ELSIF $pC[lp] = 1 THEN
cr = $uR[kk]
cg = $uG[kk]
cb = $uB[kk]
ELSE
cr = $dR[kk]
cg = $dG[kk]
cb = $dB[kk]
ENDIF
IF pocWidth <= 1 THEN
DRAWSEGMENT($pX1[lp], pYv, x2P, pYv) COLOURED(cr, cg, cb, aPoc) STYLE(line, 1)
ELSIF pocWidth = 2 THEN
DRAWSEGMENT($pX1[lp], pYv, x2P, pYv) COLOURED(cr, cg, cb, aPoc) STYLE(line, 2)
ELSIF pocWidth = 3 THEN
DRAWSEGMENT($pX1[lp], pYv, x2P, pYv) COLOURED(cr, cg, cb, aPoc) STYLE(line, 3)
ELSIF pocWidth = 4 THEN
DRAWSEGMENT($pX1[lp], pYv, x2P, pYv) COLOURED(cr, cg, cb, aPoc) STYLE(line, 4)
ELSE
DRAWSEGMENT($pX1[lp], pYv, x2P, pYv) COLOURED(cr, cg, cb, aPoc) STYLE(line, 5)
ENDIF
ENDIF
NEXT
ENDIF
//----- value area lines
IF showVa = 1 THEN
nL = $cnt[3]
FOR j = max(0, nL - vaShow) TO nL - 1 DO
lp = j MOD lRing
delP = $vDel[lp]
x2P = $vX2[lp]
IF delP = 0 THEN
IF high < $vY[lp] OR low > $vY[lp] THEN
IF x2P = barindex - 1 THEN
x2P = barindex
ENDIF
ELSIF deleteVa = 1 THEN
delP = 1
ENDIF
IF deleteVa = 1 AND x2P <> barindex THEN
delP = 1
ENDIF
ENDIF
IF delP = 0 THEN
DRAWSEGMENT($vX1[lp], $vY[lp], x2P, $vY[lp]) COLOURED(vaR, vaG, vaB, 255)
ENDIF
NEXT
ENDIF
ENDIF
RETURN