





Buyers & Sellers Profile + Dynamic S/R
Introduction
Swing highs and lows are the usual starting point for support and resistance, but the exact price of a swing is often a poor level: the wick that made the pivot is where price was rejected, not where the business was done. The volume that defines a level usually sits a little away from the extreme, at the price where buyers or sellers traded the most.
The Buyers & Sellers Profile + Dynamic S/R indicator by Zeiierman combines both ideas. It draws a large rolling volume profile on the right of the chart, with every row split into estimated buying and selling volume, and it uses that profile to judge every new swing. A pivot only becomes a level when the profile around it supports it, and the level is pulled from the raw pivot towards the nearby volume node. Each level gets a score from 0 to 100 that drives its thickness, its opacity and the size of its marker.
Theory Behind the Indicator
Rolling profile. The last 600 bars are split into 72 price rows. Each bar spreads its volume over the rows it covers, in proportion to the overlap. The buying share of that volume is estimated from where the bar closed inside its range: a close at the high counts as all buying, a close at the low as all selling, and a close in the middle as half and half. The row with the most volume is the point of control (POC).
Judging a pivot with the profile of its time. When a swing high or low is confirmed (5 bars on each side by default), the indicator rebuilds the profile as it was at the pivot bar, so old pivots are judged only with information that existed then. Inside a radius of 1.2 ATR around the raw pivot it looks for the best volume node, scoring every row on four things: its volume compared with the POC (50 %), how much it stands out from the rows next to it (20 %), whether the dominant side matches the level, buyers for a support and sellers for a resistance (20 %), and its proximity to the pivot (10 %). That is the profile evidence.
Relocating the level. If the node is strong enough (at least 8 % of the POC) and the evidence reaches the minimum (0.22), the level is pulled from the raw pivot towards the node, up to 85 % of the way, more when the evidence is stronger.
Score. The final score adds the profile evidence (50 %), absorption around the pivot (20 %: bars with small bodies and above-average volume), the relative volume of the pivot bar (15 %) and the wick rejection of the pivot bar (15 %). Pivots below 30 points are discarded.
Level life. A new level within 0.16 ATR of an existing level of the same side replaces it only if it scores higher. A level is removed when a bar closes beyond it by more than 0.1 ATR. With more than 20 active levels, the weakest one goes first.
Key Features at a Glance
- Large rolling volume profile with buy and sell volume per row and a highlighted POC.
- Support and resistance levels confirmed by the volume profile, not just by price.
- Levels relocated from the raw pivot towards the nearest strong volume node.
- Score from 0 to 100 combining profile evidence, absorption, relative volume and wick rejection.
- Line thickness, opacity and marker size that grow with the score.
- Merging of nearby levels, removal on a confirmed break and a cap on the number of active levels.
- Profile rows that contain an active level are outlined in the colour of that level.
How to Read the Indicator
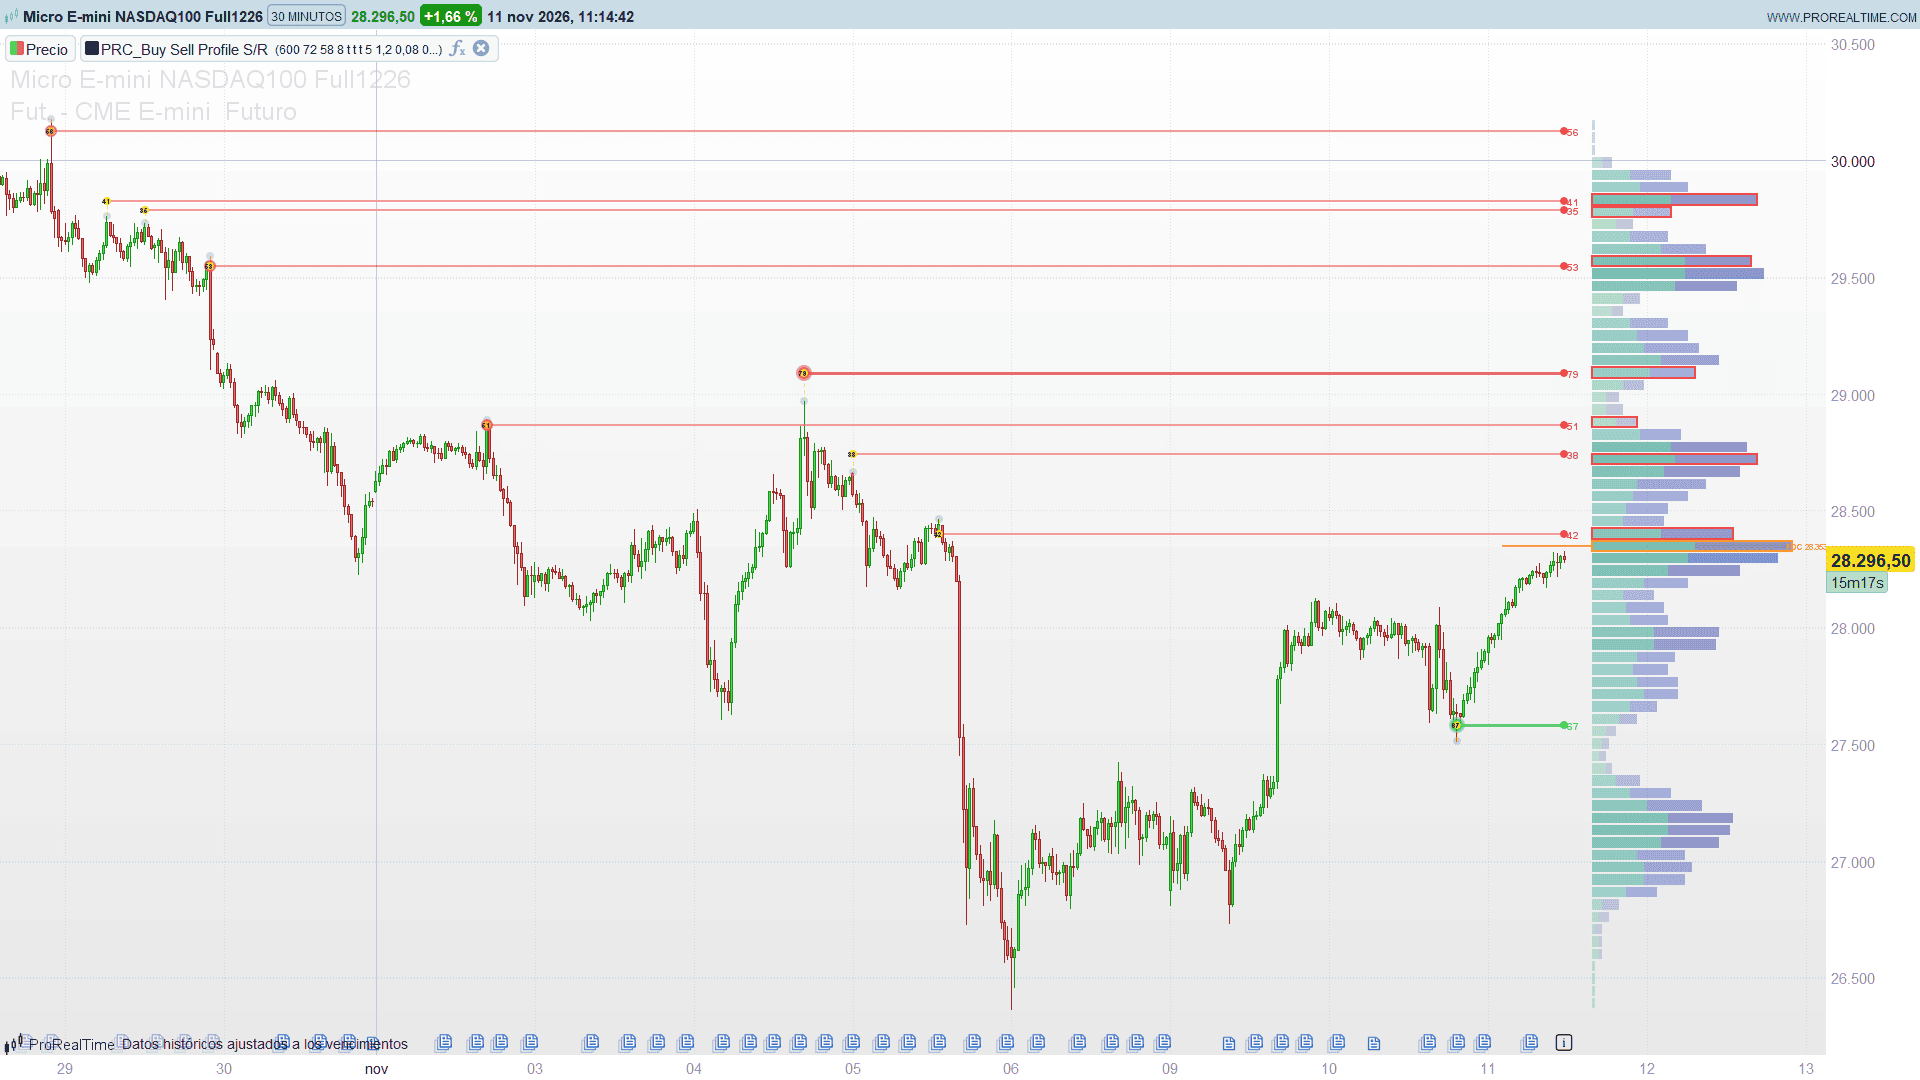
- Profile on the right: teal is estimated buying volume, blue is estimated selling volume. The wider the row, the more volume traded at that price. The orange row is the POC.
- Green lines: supports. Red lines: resistances. Thicker and more opaque lines have higher scores; the number at the right edge is the score.
- Pivot marker: the rings at the start of each level. More rings mean a higher score; a solid yellow core means strong profile evidence (45 % or more). The grey dot is the raw pivot, and the dotted yellow guide shows how far the level was pulled towards the volume node.
- Outlined profile rows: rows that contain an active level, a quick way to see which volume nodes are being defended.
- Line disappears: a bar closed through the level with the ATR buffer.
Practical Applications
- Better level placement: use the relocated level rather than the wick for entries and stops; it sits where the volume was traded.
- Filtering levels: focus on scores above 60, which combine a strong node with absorption or a clear rejection.
- Confluence with the POC: a support or resistance close to the POC or to a wide profile row is backed by a lot of traded volume.
- Instrument choice: the profile and the evidence need volume. On instruments without volume data the profile is empty and almost no pivot passes the filters.
Indicator Configuration
- profLb (default 600): bars of the rolling profile (100 to 1500).
- profRows (default 72): price rows of the profile (24 to 100).
- profW (default 58): width of the POC row in bars; the other rows scale to it.
- profOff (default 8): gap in bars between the last candle and the profile.
- showProf (default 1): show the rolling profile.
- showPoc (default 1): highlight the POC row, its guide line and its price.
- showLvlRows (default 1): outline the profile rows that contain an active level.
- swingLen (default 5): pivot length, bars on each side.
- srchAtr (default 1.20): search radius around the raw pivot, in ATR.
- nodeMin (default 0.08): minimum node volume relative to the POC.
- evidMin (default 0.22): minimum profile evidence.
- pullMax (default 0.85): maximum pull from the raw pivot towards the node.
- scoreMin (default 30): minimum score of a level.
- maxLvl (default 20): maximum active levels.
- mergeAtr (default 0.16): same-side levels closer than this, in ATR, are merged.
- breakAtr (default 0.10): buffer beyond the level a close needs to break it, in ATR.
- lvlStyle (default 1): line style, 1 solid, 2 dotted, 3 dashed.
- showDots, showRaw, showDotScore, showEdge (default 1): pivot markers, raw pivot and guide, score in the marker, and end dot with score on the right edge.
- Colours of supports, resistances, pivot core, raw pivot, profile buy and sell volume and POC at the top of the code.
The Code
//---------------------------------------------------------------
// PRC_Buy Sell Profile S/R
// version = 0
// 11.11.2026
// Iván González @ www.prorealcode.com
// Author: Zeiierman
// Sharing ProRealTime knowledge
//--------------------------------------------------------------------//
DEFPARAM DRAWONLASTBARONLY = true
//----- Large rolling profile
profLb = 600 // lookback of the rolling profile (100 to 1500 bars)
profRows = 72 // price rows of the profile (24 to 100)
profW = 58 // max width of the profile in bars (the POC row)
profOff = 8 // gap between the last bar and the profile
showProf = 1 // 1 = show the rolling profile
showPoc = 1 // 1 = highlight the POC row, its guide line and price label
showLvlRows = 1 // 1 = outline the rows that contain an active level
//----- Profile-guided pivot engine
swingLen = 5 // pivot confirmation length (bars on each side)
srchAtr = 1.20 // ATR radius around the raw pivot where a stronger volume node is searched
nodeMin = 0.08 // min node volume relative to the POC
evidMin = 0.22 // min profile evidence to accept a pivot
pullMax = 0.85 // max fraction of the way from the raw pivot to the node
scoreMin = 30.0 // min final score (0-100)
maxLvl = 20 // max active levels (the weakest is removed first)
mergeAtr = 0.16 // same-side levels closer than this (in ATR) are merged
breakAtr = 0.10 // ATR buffer a close must clear to break a level
//----- Visual style
lvlStyle = 1 // level line style: 1 = solid, 2 = dotted, 3 = dashed
showDots = 1 // 1 = layered pivot marker at the final level price
showRaw = 1 // 1 = faint raw pivot marker and dotted guide to the final level
showDotScore = 1 // 1 = score inside the pivot marker
showEdge = 1 // 1 = end dot and score at the right edge of each level
//----- Colours
supR = 31
supG = 199
supB = 116
resR = 239
resG = 75
resB = 75
coreR = 255
coreG = 205
coreB = 64
rawR = 160
rawG = 166
rawB = 178
buyR = 43
buyG = 158
buyB = 143
sellR = 74
sellG = 88
sellB = 182
pocR = 255
pocG = 145
pocB = 32
//----- Fixed constants of the engine
volLen = 40
absRad = min(3, swingLen)
pivVolX = 2.2
absBodyMax = 0.40
absVolX = 1.5
mTick = ticksize
//----- Bar data stored by bar number (read by index inside the loops)
$bO[barindex] = open
$bH[barindex] = high
$bL[barindex] = low
$bC[barindex] = close
$bV[barindex] = max(volume, 0)
atrV = AverageTrueRange[14](close)
IF barindex >= 13 THEN
$bA[barindex] = atrV
$bAok[barindex] = 1
ELSE
$bA[barindex] = 0
$bAok[barindex] = 0
ENDIF
IF barindex >= volLen - 1 THEN
$bAv[barindex] = average[volLen](volume)
$bAvOk[barindex] = 1
ELSE
$bAv[barindex] = 0
$bAvOk[barindex] = 0
ENDIF
//----- State reset on (re)load; every persistent value lives in an array
IF barindex = 0 THEN
$gs[0] = 0 - 1 // last processed bar
$gs[1] = 0 // number of active levels
ENDIF
//----- Engine: once per CLOSED bar (historical bars on themselves, the live bar once it closes)
FOR pss = 1 DOWNTO 0 DO
ofs = pss
doIt = 0
IF ofs = 1 AND barindex >= 1 AND $gs[0] < barindex - 1 THEN
doIt = 1
ENDIF
IF ofs = 0 AND NOT islastbarupdate AND $gs[0] < barindex THEN
doIt = 1
ENDIF
IF doIt = 1 THEN
bb = barindex - ofs
$gs[0] = bb
pv = bb - swingLen
IF bb > volLen + swingLen * 2 + 5 THEN
// confirmed swing high / low at bar pv (strict on the right, >= on the left)
isPH = 1
isPL = 1
FOR k = pv + 1 TO bb DO
IF $bH[k] >= $bH[pv] THEN
isPH = 0
ENDIF
IF $bL[k] <= $bL[pv] THEN
isPL = 0
ENDIF
NEXT
FOR k = pv - swingLen TO pv - 1 DO
IF $bH[k] > $bH[pv] THEN
isPH = 0
ENDIF
IF $bL[k] < $bL[pv] THEN
isPL = 0
ENDIF
NEXT
// support first (pivot low), then resistance (pivot high)
FOR side = 0 TO 1 DO
doPiv = 0
IF side = 0 AND isPL = 1 THEN
doPiv = 1
supp = 1
raw = $bL[pv]
ENDIF
IF side = 1 AND isPH = 1 THEN
doPiv = 1
supp = 0
raw = $bH[pv]
ENDIF
IF doPiv = 1 THEN
//--- rolling profile known at that time: bars pv - nb + 1 .. pv
avail = bb - swingLen + 1
nb = max(1, min(profLb, avail))
j0 = pv - nb + 1
lo = $bL[pv]
hi = $bH[pv]
FOR j = j0 TO pv DO
lo = min(lo, $bL[j])
hi = max(hi, $bH[j])
NEXT
span = max(hi - lo, mTick * profRows)
pBot = lo - (span - (hi - lo)) * 0.5
stp = span / profRows
FOR r = 0 TO profRows - 1 DO
$pT[r] = 0
$pBy[r] = 0
NEXT
FOR j = j0 TO pv DO
lj = $bL[j]
hj = $bH[j]
rj = hj - lj
vj = $bV[j]
IF rj > 0 THEN
bf = min(1, max(0, ($bC[j] - lj) / rj))
ELSE
bf = 0.5
ENDIF
r0 = max(0, min(profRows - 1, floor((lj - pBot) / stp)))
r1 = max(0, min(profRows - 1, floor((hj - pBot) / stp)))
FOR r = r0 TO r1 DO
rl = pBot + r * stp
IF rj > 0 THEN
ov = max(0, min(hj, rl + stp) - max(lj, rl))
frac = ov / rj
ELSE
frac = 1
ENDIF
IF frac > 0 THEN
av = vj * frac
$pT[r] = $pT[r] + av
$pBy[r] = $pBy[r] + av * bf
ENDIF
NEXT
NEXT
//--- strongest nearby volume node
IF $bAok[pv] = 1 THEN
atrP = max($bA[pv], mTick)
ELSE
atrP = mTick
ENDIF
mx = 0
FOR r = 0 TO profRows - 1 DO
mx = max(mx, $pT[r])
NEXT
mx = max(mx, 0.0000001)
rad = max(atrP * srchAtr, stp * 2)
bestP = raw
bestE = -1
bestS = 0
FOR r = 0 TO profRows - 1 DO
pr = pBot + (r + 0.5) * stp
dd = abs(pr - raw)
IF dd <= rad THEN
rv = $pT[r]
strN = rv / mx
IF r > 0 THEN
lvN = $pT[r - 1]
ELSE
lvN = rv
ENDIF
IF r < profRows - 1 THEN
rvN = $pT[r + 1]
ELSE
rvN = rv
ENDIF
nAvg = max((lvN + rvN) * 0.5, mx * 0.01)
pk = min(1, max(0, (rv / nAvg - 0.85) / 0.65))
IF rv > 0 THEN
bSh = min(1, max(0, $pBy[r] / rv))
ELSE
bSh = 0.5
ENDIF
IF supp = 1 THEN
dirS = bSh
ELSE
dirS = 1 - bSh
ENDIF
prox = 1 - dd / rad
ee = 0.50 * strN + 0.20 * pk + 0.20 * dirS + 0.10 * prox
IF ee > bestE THEN
bestE = ee
bestP = pr
bestS = strN
ENDIF
ENDIF
NEXT
node = bestP
evid = max(bestE, 0)
nStr = bestS
//--- pivot features: relative volume, wick rejection and absorption around the pivot
IF $bAvOk[pv] = 1 THEN
vb = $bAv[pv]
ELSE
vb = $bV[pv]
ENDIF
IF vb > 0 THEN
vr = $bV[pv] / vb
ELSE
vr = 1
ENDIF
vSc = min(1, max(0, (vr - 0.8) / (pivVolX - 0.8)))
prg = max($bH[pv] - $bL[pv], mTick)
IF supp = 1 THEN
wick = min($bO[pv], $bC[pv]) - $bL[pv]
ELSE
wick = $bH[pv] - max($bO[pv], $bC[pv])
ENDIF
wSc = min(1, max(0, (wick / prg) / 0.50))
aSc = 0
FOR n = 0 TO absRad * 2 DO
jo = bb - (swingLen - absRad + n)
cr = max($bH[jo] - $bL[jo], mTick)
vo = $bV[jo]
IF $bAvOk[jo] = 1 THEN
bse = $bAv[jo]
ELSE
bse = vo
ENDIF
IF bse > 0 THEN
vRat = vo / bse
ELSE
vRat = 1
ENDIF
bRat = abs($bC[jo] - $bO[jo]) / cr
smallB = min(1, max(0, (absBodyMax - bRat) / absBodyMax))
avB = min(1, max(0, (vRat - 1) / (absVolX - 1)))
aSc = max(aSc, sqrt(smallB * avB))
NEXT
//--- final level and score
okP = 0
IF nStr >= nodeMin AND evid >= evidMin THEN
okP = 1
ENDIF
IF okP = 1 THEN
pull = pullMax * min(1, max(0, evid / 0.65))
ELSE
pull = 0
ENDIF
lvP = raw + (node - raw) * pull
sc = 100 * (0.50 * evid + 0.20 * aSc + 0.15 * vSc + 0.15 * wSc)
IF okP = 1 AND sc >= scoreMin THEN
// store: replace a weaker same-side level nearby, or add a new one
tol = max(atrP * mergeAtr, mTick)
nL = $gs[1]
idN = -1
bestD = tol + mTick // starts above tol, so the first candidate within tol always wins
IF nL > 0 THEN
FOR i = 0 TO nL - 1 DO
IF $lSup[i] = supp THEN
dl = abs($lP[i] - lvP)
IF dl <= tol AND dl < bestD THEN
bestD = dl
idN = i
ENDIF
ENDIF
NEXT
ENDIF
IF idN >= 0 THEN
IF sc > $lSc[idN] THEN
$lP[idN] = lvP
$lSc[idN] = sc
$lRaw[idN] = raw
$lEv[idN] = evid
$lBorn[idN] = pv
ENDIF
ELSE
$lP[nL] = lvP
$lSc[nL] = sc
$lRaw[nL] = raw
$lEv[nL] = evid
$lSup[nL] = supp
$lBorn[nL] = pv
$gs[1] = nL + 1
ENDIF
ENDIF
ENDIF
NEXT
ENDIF
//--- Breaks on the close of this bar, then keep at most maxLvl levels
nL = $gs[1]
IF $bAok[bb] = 1 THEN
buf = max($bA[bb] * breakAtr, 0)
ELSE
buf = 0
ENDIF
clB = $bC[bb]
IF nL > 0 THEN
FOR i = nL - 1 DOWNTO 0 DO
broken = 0
IF $lSup[i] = 1 AND clB < $lP[i] - buf THEN
broken = 1
ENDIF
IF $lSup[i] = 0 AND clB > $lP[i] + buf THEN
broken = 1
ENDIF
IF broken = 1 THEN
IF i <= nL - 2 THEN
FOR k = i TO nL - 2 DO
$lP[k] = $lP[k + 1]
$lSc[k] = $lSc[k + 1]
$lRaw[k] = $lRaw[k + 1]
$lEv[k] = $lEv[k + 1]
$lSup[k] = $lSup[k + 1]
$lBorn[k] = $lBorn[k + 1]
NEXT
ENDIF
nL = nL - 1
ENDIF
NEXT
ENDIF
WHILE nL > maxLvl DO
weak = 0
wSc0 = $lSc[0]
FOR i = 1 TO nL - 1 DO
IF $lSc[i] < wSc0 THEN
wSc0 = $lSc[i]
weak = i
ENDIF
NEXT
IF weak <= nL - 2 THEN
FOR k = weak TO nL - 2 DO
$lP[k] = $lP[k + 1]
$lSc[k] = $lSc[k + 1]
$lRaw[k] = $lRaw[k + 1]
$lEv[k] = $lEv[k + 1]
$lSup[k] = $lSup[k + 1]
$lBorn[k] = $lBorn[k + 1]
NEXT
ENDIF
nL = nL - 1
WEND
$gs[1] = nL
ENDIF
NEXT
//----- Drawing on the last bar
IF islastbarupdate THEN
nL = $gs[1]
//--- Active levels
IF nL > 0 THEN
FOR i = 0 TO nL - 1 DO
IF $lSup[i] = 1 THEN
cR = supR
cG = supG
cB = supB
ELSE
cR = resR
cG = resG
cB = resB
ENDIF
sc = $lSc[i]
IF sc >= 82 THEN
lA = 235
lW = 4
ELSIF sc >= 62 THEN
lA = 199
lW = 3
ELSIF sc >= 45 THEN
lA = 158
lW = 2
ELSE
lA = 122
lW = 2
ENDIF
xB = $lBorn[i]
yP = $lP[i]
IF lvlStyle = 2 THEN
IF lW = 4 THEN
DRAWSEGMENT(xB, yP, barindex, yP) COLOURED(cR, cG, cB, lA) STYLE(dottedline, 4)
ELSIF lW = 3 THEN
DRAWSEGMENT(xB, yP, barindex, yP) COLOURED(cR, cG, cB, lA) STYLE(dottedline, 3)
ELSE
DRAWSEGMENT(xB, yP, barindex, yP) COLOURED(cR, cG, cB, lA) STYLE(dottedline, 2)
ENDIF
ELSIF lvlStyle = 3 THEN
IF lW = 4 THEN
DRAWSEGMENT(xB, yP, barindex, yP) COLOURED(cR, cG, cB, lA) STYLE(dottedline2, 4)
ELSIF lW = 3 THEN
DRAWSEGMENT(xB, yP, barindex, yP) COLOURED(cR, cG, cB, lA) STYLE(dottedline2, 3)
ELSE
DRAWSEGMENT(xB, yP, barindex, yP) COLOURED(cR, cG, cB, lA) STYLE(dottedline2, 2)
ENDIF
ELSE
IF lW = 4 THEN
DRAWSEGMENT(xB, yP, barindex, yP) COLOURED(cR, cG, cB, lA) STYLE(line, 4)
ELSIF lW = 3 THEN
DRAWSEGMENT(xB, yP, barindex, yP) COLOURED(cR, cG, cB, lA) STYLE(line, 3)
ELSE
DRAWSEGMENT(xB, yP, barindex, yP) COLOURED(cR, cG, cB, lA) STYLE(line, 2)
ENDIF
ENDIF
//--- pivot markers: raw pivot, guide and layered rings at the final level
IF showDots = 1 THEN
IF showRaw = 1 THEN
DRAWPOINT(xB, $lRaw[i], 2) COLOURED(rawR, rawG, rawB, 102)
DRAWSEGMENT(xB, $lRaw[i], xB, yP) COLOURED(coreR, coreG, coreB, 140) STYLE(dottedline, 1)
ENDIF
IF sc >= 82 THEN
rc = 4
ELSIF sc >= 66 THEN
rc = 3
ELSIF sc >= 50 THEN
rc = 2
ELSE
rc = 1
ENDIF
IF rc >= 4 THEN
DRAWPOINT(xB, yP, 5) COLOURED(cR, cG, cB, 82)
ENDIF
IF rc >= 3 THEN
DRAWPOINT(xB, yP, 4) COLOURED(cR, cG, cB, 122)
ENDIF
IF rc >= 2 THEN
DRAWPOINT(xB, yP, 3) COLOURED(cR, cG, cB, 179)
ENDIF
IF $lEv[i] >= 0.45 THEN
DRAWPOINT(xB, yP, 2) COLOURED(coreR, coreG, coreB, 255)
ELSE
DRAWPOINT(xB, yP, 2) COLOURED(coreR, coreG, coreB, 199)
ENDIF
IF showDotScore = 1 THEN
scI = round(sc)
DRAWTEXT("#scI#", xB, yP, SansSerif, Bold, 7) COLOURED(40, 40, 40, 255)
ENDIF
ENDIF
//--- right edge: end dot and score
IF showEdge = 1 THEN
scI = round(sc)
DRAWPOINT(barindex, yP, 2) COLOURED(cR, cG, cB, 255)
DRAWTEXT("#scI#", barindex + 3, yP, SansSerif, Bold, 10) COLOURED(cR, cG, cB, 255)
ENDIF
NEXT
ENDIF
//--- Large rolling profile of the last profLb bars (live bar included)
IF showProf = 1 THEN
nb = max(1, min(profLb, barindex + 1))
j0 = barindex - nb + 1
lo = $bL[barindex]
hi = $bH[barindex]
FOR j = j0 TO barindex DO
lo = min(lo, $bL[j])
hi = max(hi, $bH[j])
NEXT
span = max(hi - lo, mTick * profRows)
pBot = lo - (span - (hi - lo)) * 0.5
stp = span / profRows
FOR r = 0 TO profRows - 1 DO
$pT[r] = 0
$pBy[r] = 0
NEXT
FOR j = j0 TO barindex DO
lj = $bL[j]
hj = $bH[j]
rj = hj - lj
vj = $bV[j]
IF rj > 0 THEN
bf = min(1, max(0, ($bC[j] - lj) / rj))
ELSE
bf = 0.5
ENDIF
r0 = max(0, min(profRows - 1, floor((lj - pBot) / stp)))
r1 = max(0, min(profRows - 1, floor((hj - pBot) / stp)))
FOR r = r0 TO r1 DO
rl = pBot + r * stp
IF rj > 0 THEN
ov = max(0, min(hj, rl + stp) - max(lj, rl))
frac = ov / rj
ELSE
frac = 1
ENDIF
IF frac > 0 THEN
av = vj * frac
$pT[r] = $pT[r] + av
$pBy[r] = $pBy[r] + av * bf
ENDIF
NEXT
NEXT
mx = 0
poc = 0
FOR r = 0 TO profRows - 1 DO
IF $pT[r] > mx THEN
mx = $pT[r]
poc = r
ENDIF
NEXT
IF mx > 0 THEN
x0 = barindex + profOff
FOR r = 0 TO profRows - 1 DO
rv = $pT[r]
IF rv > 0 THEN
strN = rv / mx
bSh = min(1, max(0, $pBy[r] / rv))
tw = max(1, round(profW * strN))
bw = round(tw * bSh)
sw = tw - bw
y0 = pBot + (r + 0.08) * stp
y1 = pBot + (r + 0.92) * stp
fade = round(76 - 46 * strN)
fA = round(2.55 * (100 - fade))
IF bw > 0 THEN
DRAWRECTANGLE(x0, y1, x0 + bw, y0) COLOURED(buyR, buyG, buyB, 0) FILLCOLOR(buyR, buyG, buyB, fA)
ENDIF
IF sw > 0 THEN
DRAWRECTANGLE(x0 + bw, y1, x0 + tw, y0) COLOURED(sellR, sellG, sellB, 0) FILLCOLOR(sellR, sellG, sellB, fA)
ENDIF
IF showPoc = 1 AND r = poc THEN
DRAWRECTANGLE(x0, y1, x0 + tw, y0) COLOURED(pocR, pocG, pocB, 255) STYLE(line, 2) FILLCOLOR(pocR, pocG, pocB, 31)
ENDIF
IF showLvlRows = 1 AND nL > 0 THEN
sideR = 0
FOR i = 0 TO nL - 1 DO
IF sideR = 0 AND $lP[i] >= y0 AND $lP[i] <= y1 THEN
IF $lSup[i] = 1 THEN
sideR = 1
ELSE
sideR = -1
ENDIF
ENDIF
NEXT
IF sideR = 1 THEN
DRAWRECTANGLE(x0, y1, x0 + tw, y0) COLOURED(supR, supG, supB, 255) STYLE(line, 2) FILLCOLOR(coreR, coreG, coreB, 18)
ELSIF sideR = -1 THEN
DRAWRECTANGLE(x0, y1, x0 + tw, y0) COLOURED(resR, resG, resB, 255) STYLE(line, 2) FILLCOLOR(coreR, coreG, coreB, 18)
ENDIF
ENDIF
ENDIF
NEXT
IF showPoc = 1 THEN
pocP = pBot + (poc + 0.5) * stp
DRAWSEGMENT(max(0, barindex - 18), pocP, x0, pocP) COLOURED(pocR, pocG, pocB, 191) STYLE(line, 2)
DRAWTEXT("POC #pocP#", x0 + profW + 8, pocP, SansSerif, Standard, 8) COLOURED(pocR, pocG, pocB, 255)
ENDIF
ENDIF
ENDIF
ENDIF
RETURN