





Higher Timeframe Trend Frontier: Trapped Buyers / Sellers Profile
Introduction
Most intraday traders keep one eye on a higher timeframe: where the hourly or daily bar opened, how far it has already stretched and which side is winning it. The Higher Timeframe Trend Frontier by Zeiierman puts that picture on the chart you trade.
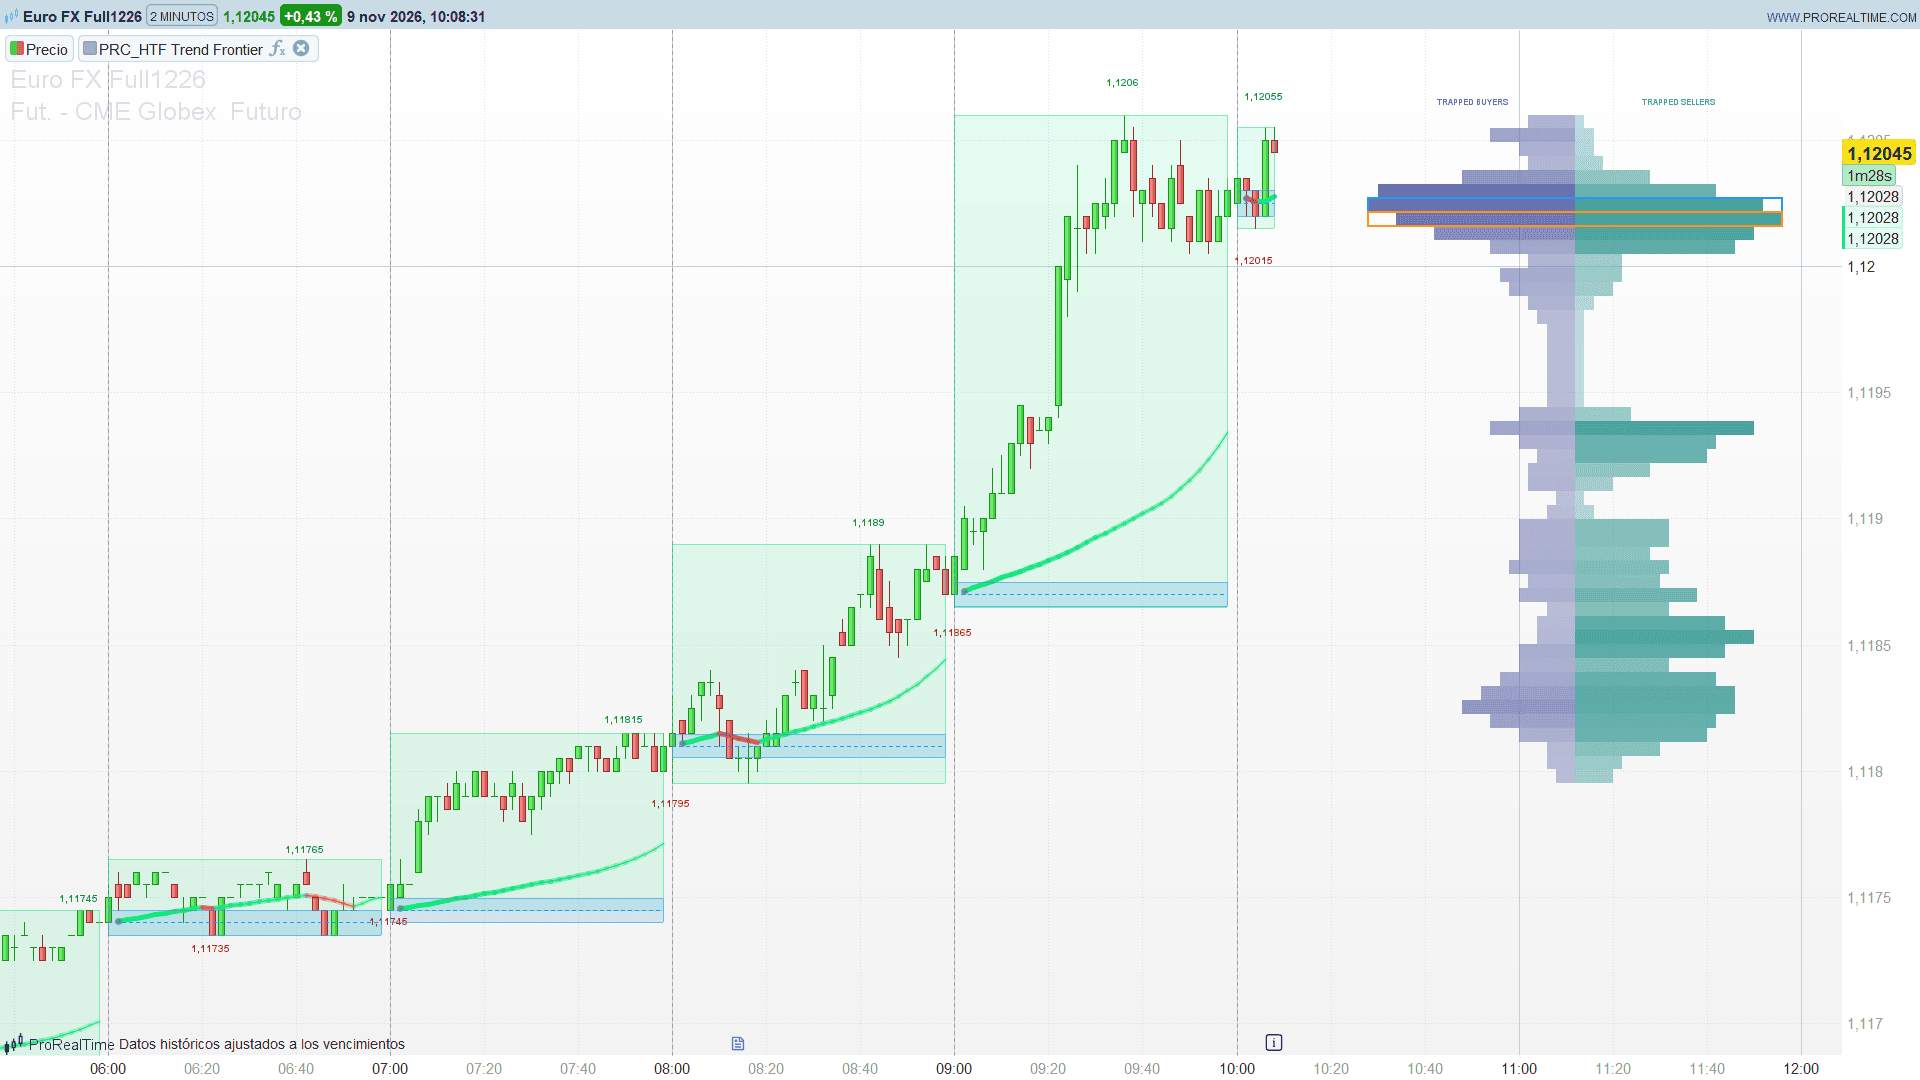
Each higher-timeframe period is drawn as a box with its high and low. Inside it, the Echo Frontier is a line that starts at the period open and chases price at a controlled speed, faster in the direction where price has historically followed through from the same area, and faster again as the period runs out. On the right, a two-sided profile estimates where buyers and sellers of the last three periods are now trapped.
Theory Behind the Indicator
Higher-timeframe periods. The chart is cut into periods of the higher timeframe (60 minutes by default), counted from the first bar of each session. Each period gets a box from its high to its low, green when price is above the period open and red when it is below, and the high and low prices are written on the bars that made them. A blue band of ±0.05 times the ATR(14) of the previous period marks the opening area, with a dotted line on the open, and a dotted divider marks the start of each period.
Echo memory. The range of the previous period, widened by 25 % on each side, is split into 9 zones. On every bar the indicator looks at the zone where price was 3 bars earlier and credits that zone with what happened next: the move since then measured in ATR, capped at ±2, as an up or a down response. Old responses fade with a half-life of 240 bars. The current zone (weight 0.6) and its two neighbours (0.2 each) give an echo bias between -1 and 1, and how often those zones have been visited sets how much the bias is trusted.
Echo Frontier. At the start of each period the frontier jumps to the open. Then, on every closed bar, it moves towards the close by at most 0.15 ATR. That speed is shared between up and down moves by the echo bias: with a bullish echo the frontier follows rises faster than falls, and the reverse with a bearish echo. From 70 % of the period onwards the speed increases up to 3 times at the close of the period, with a curve of 1.5. The frontier is green while it rises and red while it falls. A thick trail behind it becomes more opaque as the period ages, and a small dot marks where the line restarts.
Trapped buyers and sellers. The highs and lows of the last three periods (including the one in progress) are split into 48 price rows. Every bar spreads its volume over the rows it covered and shares it between buyers and sellers by its body and the position of its close. Buyers weigh more under an upper rejection wick and in red periods; sellers under a lower wick and in green periods. Both are weighted by how far underwater they are at the last price, and by age (1, 0.85 and 0.70 for the current, previous and oldest period). The buyers profile is drawn to the left of a centre line and the sellers profile to the right, with a frame on the strongest row of each side. It is an estimate from price and volume, not real order flow.
Key Features at a Glance
- Higher-timeframe boxes coloured by the position of price against the period open, with high and low price labels.
- Echo Frontier: an intraperiod trend line whose speed adapts to the history of the price zone and to the time left in the period.
- Fading trail that shows how mature the current period is.
- ATR opening zone around each period open and dotted period dividers.
- Two-sided trapped buyers / trapped sellers profile of the last three periods with the peak rows framed.
How to Read the Indicator
- Frontier below price and rising (green): buyers are pushing the period; the echo of this area supports the move.
- Frontier above price and falling (red): sellers control the period.
- Price far from the frontier: the move has outrun the controlled pace of the line; the gap tends to close late in the period, when the frontier accelerates.
- Thick, opaque trail: the period is mature; a thin, faint trail means it has just started.
- Box colour: where price stands against the period open right now.
- Profile: a wide left row above price is a pocket of trapped buyers, a likely supply area if price comes back; a wide right row below price is a pocket of trapped sellers, a likely demand area. The framed rows are the strongest of each side.
Practical Applications
- Intraday bias: trade in the direction of the frontier and of the box colour; stand aside when they disagree.
- Mean reversion inside the period: large gaps between price and the frontier late in the period are candidates for a pullback towards the line.
- Levels: the opening zone, the period high and low and the peak rows of the profile give natural references for entries, stops and targets.
- Timeframes: a 1 to 5-minute chart with the hourly period, or a 15 to 60-minute chart with the daily period (htfMin = 1440).
Indicator Configuration
- htfMin (default 60): higher timeframe in minutes; it must be higher than the chart timeframe (1440 = daily).
- sessAlign (default 1): 1 = periods counted from the first bar of each session, 0 = from midnight.
- showBoxes (default 1): coloured higher-timeframe boxes.
- showPrices (default 1): high and low price labels.
- lblSize (default 10): font size of the price labels.
- showOpen (default 1): ATR opening zone.
- openATRMult (default 0.05): half-width of the opening zone in ATR of the previous period.
- showLines (default 1): dotted dividers at each new period.
- frontSpeed (default 0.15): frontier speed in chart ATR per bar.
- lateAccel (default 1): acceleration near the end of the period.
- lateStart (default 70): period progress (%) where the acceleration starts.
- lateFactor (default 3): speed multiplier at the end of the period.
- lateCurve (default 1.5): shape of the acceleration (1 = linear, higher = later).
- showTrap (default 1): trapped buyers / sellers profile.
- trapRows (default 48): price rows of the profile.
- trapOffset (default 10): gap in bars between the last bar and the profile.
- trapWidth (default 22): maximum width of each side in bars.
- trapSeparate (default 1): 1 = each side scaled to its own peak, 0 = both on one scale.
- showTrapLabels (default 1): TRAPPED BUYERS / TRAPPED SELLERS headers.
The Code
//---------------------------------------------------------------
// PRC_HTF Trend Frontier
// version = 0
// 09.11.2026
// Iván González @ www.prorealcode.com
// Author: Zeiierman
// Sharing ProRealTime knowledge
//--------------------------------------------------------------------//
// Higher Timeframe Trend Frontier.
// - HTF boxes: the high-low range of every higher-timeframe period,
//   green or red by the close against the period open, with price
//   labels on the candles that made the extremes.
// - Echo Frontier: a line that restarts at each period open and walks
//   towards price at a speed in chart ATR units. Its speed is skewed by
//   an "echo memory" of how price responded in the past from each of 9
//   zones around the previous period range, and it accelerates late in
//   the period.
// - HTF ATR opening zone, dotted period dividers and a two-sided
//   trapped buyers / trapped sellers profile of the last three periods
//   (estimated from OHLCV, not real bid/ask delta).
//--------------------------------------------------------------------//
defparam drawonlastbaronly = true

// ===================== INPUTS =====================
// --- Trend map ---
htfMin = 60          // higher timeframe in minutes (must be higher than the chart; 1440 = daily)
sessAlign = 1        // 1 = periods counted from the first bar of each day (session), 0 = from midnight
// --- Appearance ---
showBoxes = 1        // 1 = coloured HTF boxes
showPrices = 1       // 1 = high / low price labels
lblSize = 10         // price label font size (8 tiny, 10 small, 12 normal, 14 large, 18 huge)
showOpen = 1         // 1 = HTF ATR opening zone
openATRMult = 0.05   // half-width of the opening zone in previous-HTF ATR (0.01..1)
showLines = 1        // 1 = dotted vertical dividers at new periods
// --- Echo memory ---
frontSpeed = 0.15    // frontier speed in chart ATR per bar (0.01..1.5)
// --- Frontier acceleration ---
lateAccel = 1        // 1 = speed up as the HTF period approaches its close
lateStart = 70       // HTF progress (%) where the acceleration begins (10..95)
lateFactor = 3       // speed multiplier reached at the end of the period (1..10)
lateCurve = 1.5      // acceleration shape (1 = linear, higher = later)
// --- Trap profile ---
showTrap = 1         // 1 = trapped buyers / sellers profile
trapRows = 48        // price rows (12..60)
trapOffset = 10      // gap in bars between the last bar and the profile
trapWidth = 22       // max width of each side in bars (5..80)
trapSeparate = 1     // 1 = normalise each side on its own peak, 0 = shared scale
showTrapLabels = 1   // 1 = TRAPPED BUYERS / TRAPPED SELLERS headers

// ===================== CONSTANTS =====================
zoneCnt = 9
horizonB = 3
halfLife = 240
trapCap = 6000
objKeep = 95
decayF = pow(0.5, 1 / halfLife)

// ===================== TIME AND PERIODS =====================
ONCE chartMin = 0
ONCE dayStart = 0
ONCE daySpanPrev = 0
oTm = opentime
mNow = floor(oTm / 10000) * 60 + floor(oTm / 100) - floor(oTm / 10000) * 100

newDay = 0
IF barindex = 0 THEN
   newDay = 1
ELSIF opendate <> opendate[1] THEN
   newDay = 1
ENDIF
IF newDay = 0 THEN
   dMin = mNow - mNow[1]
   IF dMin > 0 AND (chartMin = 0 OR dMin < chartMin) THEN
      chartMin = dMin
   ENDIF
ENDIF
IF newDay = 1 THEN
   IF barindex > 0 THEN
      daySpanPrev = mNow[1] + chartMin - dayStart
   ENDIF
   dayStart = mNow
ENDIF

IF sessAlign = 1 THEN
   baseM = dayStart
ELSE
   baseM = 0
ENDIF
IF htfMin >= 1440 THEN
   perK = 0
   pStartM = dayStart
   IF daySpanPrev > 0 THEN
      htfDur = daySpanPrev
   ELSE
      htfDur = 1440
   ENDIF
ELSE
   perK = floor((mNow - baseM) / htfMin)
   pStartM = baseM + perK * htfMin
   htfDur = htfMin
ENDIF

newP = 0
IF newDay = 1 THEN
   newP = 1
ELSIF perK <> perK[1] THEN
   newP = 1
ENDIF

// HTF session progress and late acceleration
htfProg = (mNow + chartMin - pStartM) / htfDur
htfProg = max(0, min(1, htfProg))
startFr = lateStart / 100
latePh = max(0, min(1, (htfProg - startFr) / (1 - startFr)))
IF lateAccel = 1 THEN
   speedF = 1 + (lateFactor - 1) * pow(latePh, lateCurve)
ELSE
   speedF = 1
ENDIF

// Chart ATR(14), with the bar range during its warm-up
IF barindex >= 13 THEN
   atrC = AverageTrueRange[14](close)
ELSE
   atrC = high - low
ENDIF
atrC = max(atrC, ticksize)

// Every bar stores what the engine needs (pure assignment: the same value on every tick)
$bO[barindex] = open
$bH[barindex] = high
$bL[barindex] = low
$bC[barindex] = close
$bV[barindex] = volume
$bAtr[barindex] = atrC
$bNP[barindex] = newP
$bSpd[barindex] = speedF

// ===================== ENGINE (closed bars only) =====================
// $gS: [0] last processed bar, [1] closed HTF bars, [2] HTF open, [3] HTF high, [4] HTF low,
// [5] HTF first bar, [6] HTF ATR, [7] HTF TR sum (seed), [8] echo bias, [9] echo visits,
// [10] frontier, [11] period high, [12] period low, [13] high bar, [14] low bar,
// [15] period start, [16] period age, [17] periods recorded
IF barindex = 0 THEN
   $gS[0] = 0 - 1
   $gS[1] = 0
   $gS[6] = 0
   $gS[7] = 0
   $gS[8] = 0
   $gS[9] = 0
   $gS[10] = 0
   $gS[15] = 0 - 1
   $gS[16] = 0
   $gS[17] = 0
   FOR zi = 0 TO zoneCnt - 1 DO
      $eU[zi] = 0
      $eD[zi] = 0
      $eV[zi] = 0
   NEXT
ENDIF

// Two passes: the previous bar if it was the live one and has just closed, then the current bar
// if it is a historical (closed) bar. All the state lives in arrays, so no bar is processed twice.
FOR pss = 1 DOWNTO 0 DO
   ofs = pss
   doIt = 0
   IF ofs = 1 AND barindex >= 1 THEN
      IF $gS[0] < barindex - 1 THEN
         doIt = 1
      ENDIF
   ENDIF
   IF ofs = 0 AND NOT islastbarupdate THEN
      IF $gS[0] < barindex THEN
         doIt = 1
      ENDIF
   ENDIF
   IF doIt = 1 THEN
      bi = barindex - ofs
      $gS[0] = bi
      cO = $bO[bi]
      cH = $bH[bi]
      cL = $bL[bi]
      cC = $bC[bi]
      aC = $bAtr[bi]
      isNP = $bNP[bi]

      // ---- Higher-timeframe bars: close the previous one, open the new one ----
      IF isNP = 1 AND bi > 0 THEN
         jx = $gS[1]
         $xO[jx] = $gS[2]
         $xH[jx] = $gS[3]
         $xL[jx] = $gS[4]
         $xC[jx] = $bC[bi - 1]
         $xS[jx] = $gS[5]
         IF jx = 0 THEN
            trJ = $xH[jx] - $xL[jx]
         ELSE
            pcJ = $xC[jx - 1]
            trJ = max($xH[jx] - $xL[jx], max(abs($xH[jx] - pcJ), abs($xL[jx] - pcJ)))
         ENDIF
         // Wilder ATR(14) of the HTF bars, seeded with the mean of the first 14 true ranges
         IF jx < 13 THEN
            $gS[7] = $gS[7] + trJ
            $xAtr[jx] = 0 - 1
         ELSIF jx = 13 THEN
            $gS[6] = ($gS[7] + trJ) / 14
            $xAtr[jx] = $gS[6]
         ELSE
            $gS[6] = ($gS[6] * 13 + trJ) / 14
            $xAtr[jx] = $gS[6]
         ENDIF
         $gS[1] = jx + 1
      ENDIF
      IF isNP = 1 THEN
         $gS[2] = cO
         $gS[3] = cH
         $gS[4] = cL
         $gS[5] = bi
      ELSE
         $gS[3] = max($gS[3], cH)
         $gS[4] = min($gS[4], cL)
      ENDIF
      nXc = $gS[1]
      htfO = $gS[2]

      // ---- Echo zone of this bar: 9 zones over the previous HTF range +/- 25% ----
      zoneNow = 0 - 1
      IF nXc >= 1 THEN
         pvH = $xH[nXc - 1]
         pvL = $xL[nXc - 1]
         refSpan = max(pvH - pvL, ticksize * 10)
         refBot = pvL - refSpan * 0.25
         refW = refSpan * 1.5 / zoneCnt
         zoneNow = max(0, min(zoneCnt - 1, floor((cC - refBot) / refW)))
      ENDIF
      $bZone[bi] = zoneNow

      // ---- Echo memory: decay, then credit the zone price was in HORIZON bars ago ----
      FOR zi = 0 TO zoneCnt - 1 DO
         $eU[zi] = $eU[zi] * decayF
         $eD[zi] = $eD[zi] * decayF
         $eV[zi] = $eV[zi] * decayF
      NEXT
      IF bi >= horizonB THEN
         oldZ = $bZone[bi - horizonB]
         IF oldZ >= 0 THEN
            respV = max(0 - 2, min(2, (cC - $bC[bi - horizonB]) / $bAtr[bi - horizonB]))
            $eU[oldZ] = $eU[oldZ] + max(respV, 0)
            $eD[oldZ] = $eD[oldZ] + max(0 - respV, 0)
            $eV[oldZ] = $eV[oldZ] + 1
         ENDIF
      ENDIF
      IF zoneNow >= 0 THEN
         zA = max(0, zoneNow - 1)
         zB = min(zoneCnt - 1, zoneNow + 1)
         biasC = ($eU[zoneNow] - $eD[zoneNow]) / (2 + $eU[zoneNow] + $eD[zoneNow])
         biasA = ($eU[zA] - $eD[zA]) / (2 + $eU[zA] + $eD[zA])
         biasB = ($eU[zB] - $eD[zB]) / (2 + $eU[zB] + $eD[zB])
         $gS[8] = 0.6 * biasC + 0.2 * biasA + 0.2 * biasB
         $gS[9] = 0.6 * $eV[zoneNow] + 0.2 * $eV[zA] + 0.2 * $eV[zB]
      ELSE
         $gS[8] = 0
         $gS[9] = 0
      ENDIF

      // ---- Period update and Echo Frontier ----
      IF isNP = 1 OR $gS[15] < 0 THEN
         $gS[15] = bi
         $gS[16] = 0
         $gS[11] = cH
         $gS[12] = cL
         $gS[13] = bi
         $gS[14] = bi
         $gS[10] = htfO
         np = $gS[17]
         $pS[np] = bi
         $pOpen[np] = htfO
         $pBand[np] = 0 - 1
         IF nXc >= 1 THEN
            IF $xAtr[nXc - 1] > 0 THEN
               $pBand[np] = $xAtr[nXc - 1] * openATRMult
            ENDIF
         ENDIF
         $pDiv[np] = 0
         IF bi > 0 THEN
            $pDiv[np] = 1
         ENDIF
         $gS[17] = np + 1
      ELSE
         $gS[16] = $gS[16] + 1
         IF cH > $gS[11] THEN
            $gS[11] = cH
            $gS[13] = bi
         ENDIF
         IF cL < $gS[12] THEN
            $gS[12] = cL
            $gS[14] = bi
         ENDIF
         echoR = min(1, $gS[9] / 4)
         echoQ = max(0.15, min(0.85, 0.5 + 0.3 * $gS[8] * echoR))
         gapF = cC - $gS[10]
         IF gapF >= 0 THEN
            baseVel = aC * frontSpeed * echoQ
         ELSE
            baseVel = aC * frontSpeed * (1 - echoQ)
         ENDIF
         velF = baseVel * $bSpd[bi]
         IF gapF > 0 THEN
            $gS[10] = $gS[10] + min(gapF, velF)
         ELSIF gapF < 0 THEN
            $gS[10] = $gS[10] - min(0 - gapF, velF)
         ENDIF
      ENDIF
      np = $gS[17] - 1
      $pE[np] = bi
      $pH[np] = $gS[11]
      $pL[np] = $gS[12]
      $pHB[np] = $gS[13]
      $pLB[np] = $gS[14]
      IF cC >= htfO THEN
         $pBull[np] = 1
      ELSE
         $pBull[np] = 0
      ENDIF
      $bFr[bi] = $gS[10]
      $bAge[bi] = $gS[16]
   ENDIF
NEXT

// ===================== ECHO FRONTIER SERIES =====================
// A bar that has not been processed yet is the live one: it shows the frontier of the last closed bar
IF $gS[0] = barindex THEN
   frV = $bFr[barindex]
   ageV = $bAge[barindex]
ELSE
   frV = $gS[10]
   ageV = $gS[16]
ENDIF
prevFr = frV
IF barindex >= 1 THEN
   prevFr = $bFr[barindex - 1]
ENDIF
IF frV >= prevFr THEN
   fR = 0
   fG = 230
   fB = 118
ELSE
   fR = 242
   fG = 54
   fB = 69
ENDIF
expB = 1
IF chartMin > 0 THEN
   expB = max(1, htfMin / chartMin)
ENDIF
opac = floor(min(88, ageV / expB * 88))
mainA = 255
fadeA = round(255 * (100 - opac) / 100)
dotA = 0
// Break the line at each new period (the restart bar and the segment that joins it)
IF newP = 1 THEN
   mainA = 0
   fadeA = 0
ENDIF
IF barindex >= 1 THEN
   IF $bNP[barindex - 1] = 1 THEN
      mainA = 0
      fadeA = 0
      dotA = 191
   ENDIF
ENDIF

// ===================== DRAWING =====================
IF islastbarupdate THEN
   IF chartMin > 0 AND htfMin <= chartMin THEN
      DRAWTEXT("Higher Timeframe must be greater than the chart timeframe.", 220, 0 - 30, SansSerif, Bold, 12) ANCHOR(TOPLEFT, XSHIFT, YSHIFT) COLOURED(242, 54, 69, 255)
   ENDIF

   nPc = $gS[17]
   // ---- Period objects: the last objKeep of each kind ----
   IF nPc > 0 THEN
      cntBox = 0
      cntLab = 0
      cntOpn = 0
      cntDiv = 0
      pp = nPc - 1
      WHILE pp >= 0 AND (cntBox < objKeep OR cntLab < objKeep OR cntOpn < objKeep OR cntDiv < objKeep) DO
         ps = $pS[pp]
         eR = $pE[pp]
         eH = $pH[pp]
         eL = $pL[pp]
         eHB = $pHB[pp]
         eLB = $pLB[pp]
         eBull = $pBull[pp]
         // developing period: the live bar extends the current one
         IF pp = nPc - 1 AND newP = 0 THEN
            eR = barindex
            IF high > eH THEN
               eH = high
               eHB = barindex
            ENDIF
            IF low < eL THEN
               eL = low
               eLB = barindex
            ENDIF
            IF close >= $pOpen[pp] THEN
               eBull = 1
            ELSE
               eBull = 0
            ENDIF
         ENDIF
         IF showBoxes = 1 AND cntBox < objKeep THEN
            IF eBull = 1 THEN
               DRAWRECTANGLE(ps, eH, eR, eL) COLOURED(0, 230, 118, 122) FILLCOLOR(0, 230, 118, 26)
            ELSE
               DRAWRECTANGLE(ps, eH, eR, eL) COLOURED(242, 54, 69, 122) FILLCOLOR(242, 54, 69, 26)
            ENDIF
            cntBox = cntBox + 1
         ENDIF
         IF showPrices = 1 AND cntLab < objKeep THEN
            hTxt = round(eH / ticksize) * ticksize
            lTxt = round(eL / ticksize) * ticksize
            hOff = $bAtr[eHB] * 0.6
            lOff = $bAtr[eLB] * 0.6
            DRAWTEXT("#hTxt#", eHB, eH + hOff, SansSerif, Bold, lblSize) COLOURED(0, 150, 80, 255)
            DRAWTEXT("#lTxt#", eLB, eL - lOff, SansSerif, Bold, lblSize) COLOURED(210, 40, 55, 255)
            cntLab = cntLab + 1
         ENDIF
         IF showOpen = 1 AND cntOpn < objKeep AND $pBand[pp] > 0 THEN
            oMid = $pOpen[pp]
            oBand = $pBand[pp]
            DRAWRECTANGLE(ps, oMid + oBand, eR, oMid - oBand) COLOURED(30, 142, 234, 140) FILLCOLOR(30, 142, 234, 43)
            DRAWSEGMENT(ps, oMid, eR, oMid) COLOURED(30, 142, 234, 230) STYLE(dottedline, 1)
            cntOpn = cntOpn + 1
         ENDIF
         IF showLines = 1 AND cntDiv < objKeep AND $pDiv[pp] = 1 THEN
            DRAWVLINE(ps) COLOURED(120, 120, 120, 140) STYLE(dottedline, 1)
            cntDiv = cntDiv + 1
         ENDIF
         pp = pp - 1
      WEND
   ENDIF

   // ---- Two-sided trap profile over the last three HTF periods ----
   nXc = $gS[1]
   trapOk = 0
   IF showTrap = 1 THEN
      IF newP = 1 AND nXc >= 1 AND barindex >= 1 THEN
         // the live bar opens a new period: the one in progress has just become the previous one
         trapOk = 1
         p1O = $gS[2]
         p1C = $bC[barindex - 1]
         p1H = $gS[3]
         p1L = $gS[4]
         p1S = $gS[5]
         p2O = $xO[nXc - 1]
         p2C = $xC[nXc - 1]
         p2H = $xH[nXc - 1]
         p2L = $xL[nXc - 1]
         p2S = $xS[nXc - 1]
         curS = barindex
         liveO = open
         liveH = high
         liveL = low
      ELSIF newP = 0 AND nXc >= 2 THEN
         trapOk = 1
         p1O = $xO[nXc - 1]
         p1C = $xC[nXc - 1]
         p1H = $xH[nXc - 1]
         p1L = $xL[nXc - 1]
         p1S = $xS[nXc - 1]
         p2O = $xO[nXc - 2]
         p2C = $xC[nXc - 2]
         p2H = $xH[nXc - 2]
         p2L = $xL[nXc - 2]
         p2S = $xS[nXc - 2]
         curS = $gS[5]
         liveO = $gS[2]
         liveH = max($gS[3], high)
         liveL = min($gS[4], low)
      ENDIF
   ENDIF

   IF trapOk = 1 THEN
      trapHi = max(max(p2H, p1H), liveH)
      trapLo = min(min(p2L, p1L), liveL)
      trapSpan = max(trapHi - trapLo, ticksize * trapRows)
      trapStep = trapSpan / trapRows
      liveGreen = 0
      IF close >= liveO THEN
         liveGreen = 1
      ENDIF
      p1Green = 0
      IF p1C >= p1O THEN
         p1Green = 1
      ENDIF
      p2Green = 0
      IF p2C >= p2O THEN
         p2Green = 1
      ENDIF
      FOR rw = 0 TO trapRows - 1 DO
         $tBuy[rw] = 0
         $tSell[rw] = 0
      NEXT
      lastPx = close
      kStart = max(p2S, barindex - trapCap)
      FOR kb = kStart TO barindex DO
         kO = $bO[kb]
         kH = $bH[kb]
         kL = $bL[kb]
         kC = $bC[kb]
         kV = $bV[kb]
         IF kb >= curS THEN
            kGreen = liveGreen
            kW = 1
         ELSIF kb >= p1S THEN
            kGreen = p1Green
            kW = 0.85
         ELSE
            kGreen = p2Green
            kW = 0.7
         ENDIF
         cRng = max(kH - kL, ticksize)
         kBody = max(0 - 1, min(1, (kC - kO) / cRng))
         kLoc = max(0 - 1, min(1, (2 * kC - kH - kL) / cRng))
         buyShr = max(0.05, min(0.95, 0.5 + 0.35 * kBody + 0.15 * kLoc))
         sellShr = 1 - buyShr
         upWk = max(0, kH - max(kO, kC)) / cRng
         dnWk = max(0, min(kO, kC) - kL) / cRng
         buyRej = 0.7 + 1.3 * upWk
         sellRej = 0.7 + 1.3 * dnWk
         IF kGreen = 1 THEN
            buyReg = 0.3
            sellReg = 1.5
         ELSE
            buyReg = 1.5
            sellReg = 0.3
         ENDIF
         // instruments without volume report 0: treated as 1 (the original's "no volume" case)
         IF kV > 0 THEN
            actV = kV
         ELSE
            actV = 1
         ENDIF
         firstRw = max(0, min(trapRows - 1, floor((kL - trapLo) / trapStep)))
         lastRw = max(0, min(trapRows - 1, floor((kH - trapLo) / trapStep)))
         FOR rw = firstRw TO lastRw DO
            rBot = trapLo + rw * trapStep
            rTop = rBot + trapStep
            ovl = 0
            IF kH > kL THEN
               ovl = max(0, min(kH, rTop) - max(kL, rBot)) / (kH - kL)
            ELSIF kC >= rBot AND kC <= rTop THEN
               ovl = 1
            ENDIF
            IF ovl > 0 THEN
               rPx = (rBot + rTop) * 0.5
               buyLoss = max(0, rPx - lastPx)
               sellLoss = max(0, lastPx - rPx)
               buyExp = 0.15 + 0.85 * min(1, buyLoss / (trapSpan * 0.25))
               sellExp = 0.15 + 0.85 * min(1, sellLoss / (trapSpan * 0.25))
               baseW = actV * ovl * kW
               $tBuy[rw] = $tBuy[rw] + baseW * buyShr * buyReg * buyRej * buyExp
               $tSell[rw] = $tSell[rw] + baseW * sellShr * sellReg * sellRej * sellExp
            ENDIF
         NEXT
      NEXT

      buyPk = 0
      sellPk = 0
      buyPkRow = 0
      sellPkRow = 0
      FOR rw = 0 TO trapRows - 1 DO
         IF $tBuy[rw] > buyPk THEN
            buyPk = $tBuy[rw]
            buyPkRow = rw
         ENDIF
         IF $tSell[rw] > sellPk THEN
            sellPk = $tSell[rw]
            sellPkRow = rw
         ENDIF
      NEXT
      IF trapSeparate = 1 THEN
         buyScl = buyPk
         sellScl = sellPk
      ELSE
         buyScl = max(buyPk, sellPk)
         sellScl = buyScl
      ENDIF
      xCtr = barindex + trapOffset + trapWidth
      xLft = xCtr - trapWidth
      xRgt = xCtr + trapWidth
      FOR rw = 0 TO trapRows - 1 DO
         rBot = trapLo + rw * trapStep
         rTop = rBot + trapStep
         bSc = $tBuy[rw]
         sSc = $tSell[rw]
         bRel = 0
         IF buyScl > 0 THEN
            bRel = bSc / buyScl
         ENDIF
         sRel = 0
         IF sellScl > 0 THEN
            sRel = sSc / sellScl
         ENDIF
         IF bSc > 0 THEN
            bWd = max(1, round(trapWidth * bRel))
            bTr = floor(72 - 57 * bRel)
         ELSE
            bWd = 1
            bTr = 96
         ENDIF
         IF sSc > 0 THEN
            sWd = max(1, round(trapWidth * sRel))
            sTr = floor(72 - 57 * sRel)
         ELSE
            sWd = 1
            sTr = 96
         ENDIF
         bAl = round(255 * (100 - bTr) / 100)
         sAl = round(255 * (100 - sTr) / 100)
         DRAWRECTANGLE(xCtr - bWd, rTop, xCtr, rBot) COLOURED(74, 84, 157, 0) FILLCOLOR(74, 84, 157, bAl)
         DRAWRECTANGLE(xCtr, rTop, xCtr + sWd, rBot) COLOURED(31, 141, 137, 0) FILLCOLOR(31, 141, 137, sAl)
      NEXT
      IF buyPk > 0 THEN
         DRAWRECTANGLE(xLft, trapLo + (buyPkRow + 1) * trapStep, xRgt, trapLo + buyPkRow * trapStep) COLOURED(29, 151, 255, 255) STYLE(line, 2)
      ENDIF
      IF sellPk > 0 THEN
         DRAWRECTANGLE(xLft, trapLo + (sellPkRow + 1) * trapStep, xRgt, trapLo + sellPkRow * trapStep) COLOURED(255, 145, 27, 255) STYLE(line, 2)
      ENDIF
      IF showTrapLabels = 1 THEN
         hdrY = trapHi + trapStep
         DRAWTEXT("TRAPPED BUYERS", xCtr - round(trapWidth * 0.5), hdrY, SansSerif, Standard, 8) COLOURED(74, 84, 157, 255)
         DRAWTEXT("TRAPPED SELLERS", xCtr + round(trapWidth * 0.5), hdrY, SansSerif, Standard, 8) COLOURED(31, 141, 137, 255)
      ENDIF
   ENDIF
ENDIF

RETURN frV COLOURED(fR, fG, fB, mainA) STYLE(line, 1) AS "Echo Frontier", frV COLOURED(fR, fG, fB, fadeA) STYLE(line, 5) AS "Echo Frontier Fade", frV COLOURED(120, 120, 120, dotA) STYLE(point, 3) AS "Period Dot"