

Donchian Volatility Indicator – Adaptive Channel Width
1. Introduction
Volatility is one of the most important market properties a trader can monitor. While many traders rely on standard indicators like Bollinger Bands or ATR alone, the Donchian Volatility Indicator offers a different perspective by combining the Donchian Channel concept with ATR-adaptive boundaries.
This indicator was originally developed for TradingView and has been adapted to ProBuilder for ProRealTime. Instead of plotting the channel on the price chart, it measures the channel width as a standalone oscillator, providing a clean visual representation of volatility expansion and contraction cycles.
2. How It Works
The indicator builds on two well-established tools:
- Donchian Channel: Defined by the highest high and lowest low over a lookback period, capturing the full price range.
- ATR (Average True Range): Added as an adaptive buffer to extend the channel boundaries beyond the raw highs and lows.
The core calculation is straightforward:
Upper Channel = Highest High (N periods) + ATR × Multiplier Lower Channel = Lowest Low (N periods) − ATR × Multiplier Channel Width = Upper Channel − Lower Channel
A signal line (simple moving average of the channel width) is then overlaid to help identify shifts between volatility regimes.
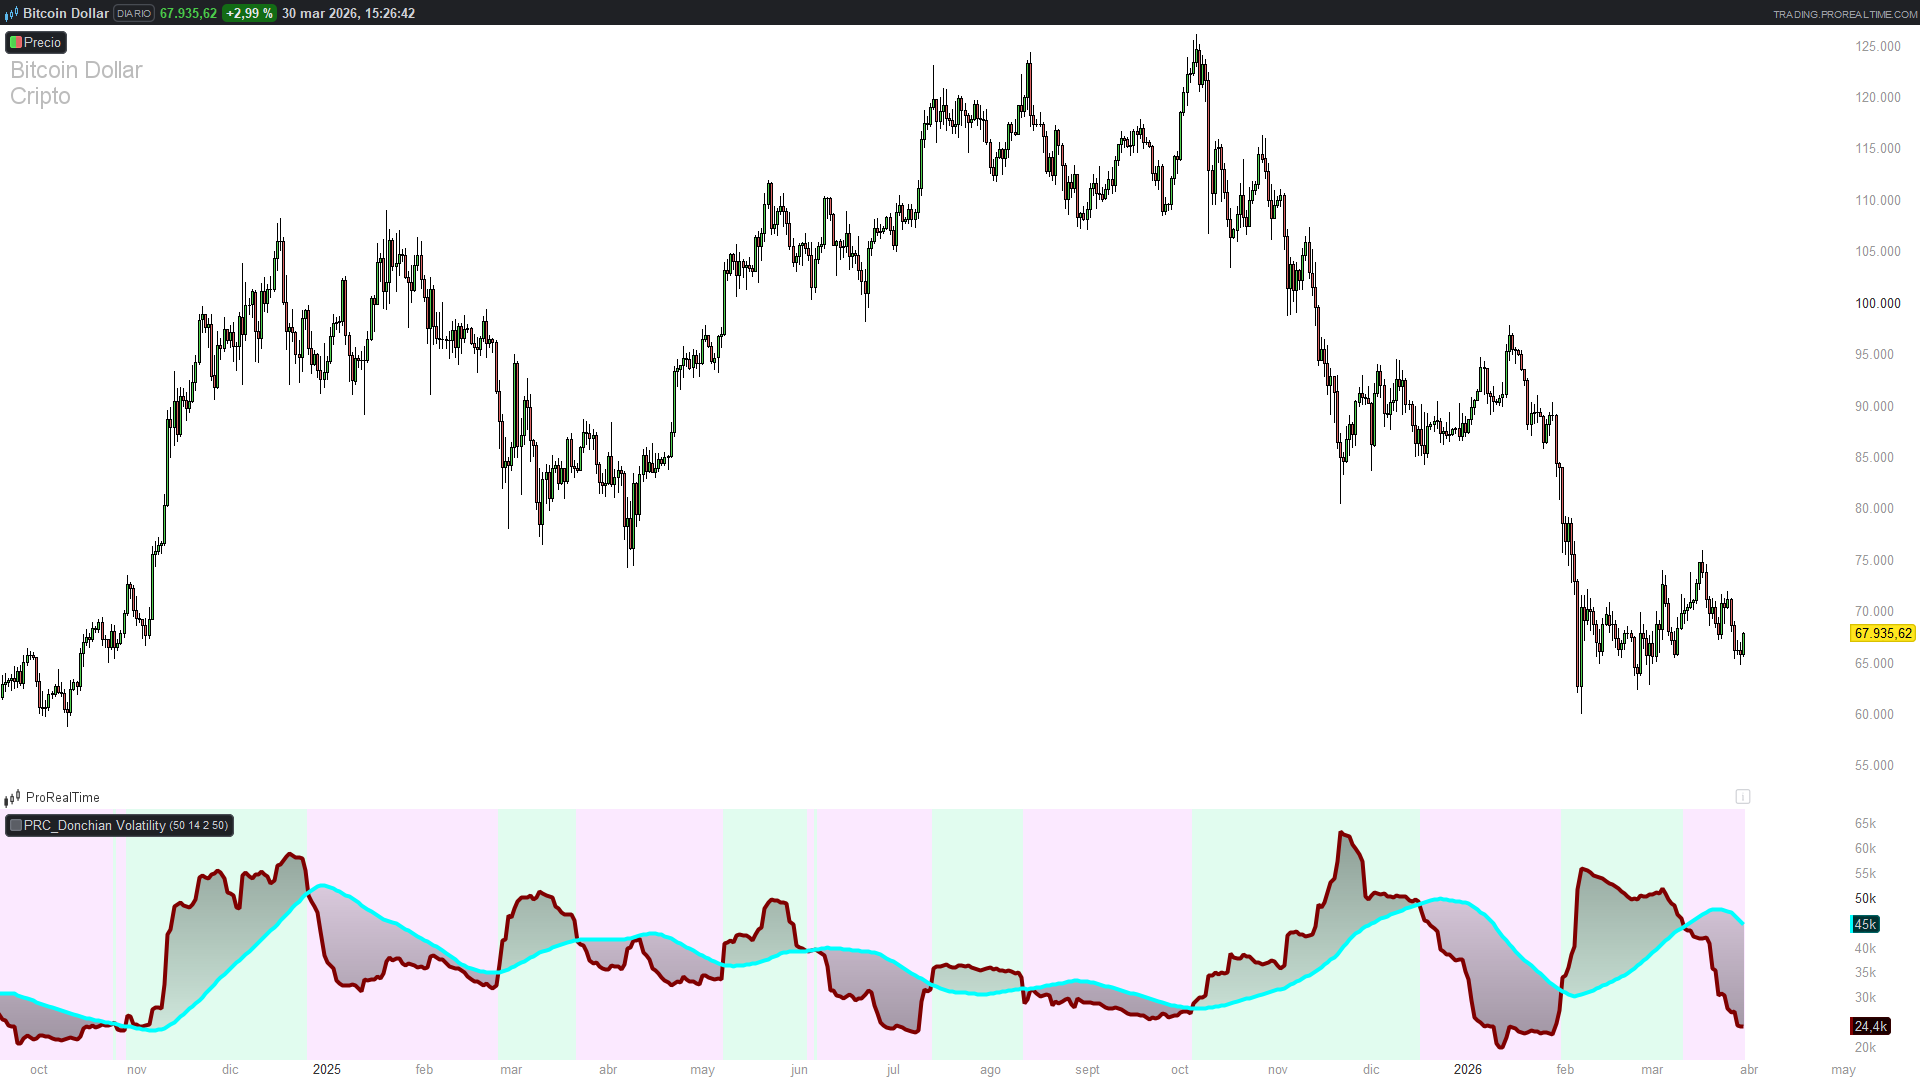
3. Reading the Indicator
The indicator plots two lines in a separate panel below the price chart:
- Channel Width (maroon, thick): The raw adaptive Donchian width. Rising values indicate expanding volatility; falling values indicate contraction.
- Signal Line (aqua, thick): A smoothed average of the channel width that acts as a trend filter.
Background color provides an additional visual cue:
- Green background: Channel Width is above the Signal Line → volatility is expanding
- Pink background: Channel Width is below the Signal Line → volatility is contracting
4. Trading Applications
- Breakout confirmation: Rising channel width crossing above the signal line often coincides with the start of a strong directional move.
- Range detection: When the channel width compresses below the signal line, the market is likely consolidating — useful for avoiding false breakouts.
- Volatility cycles: The indicator visually maps the natural expansion-contraction rhythm of markets, helping traders anticipate regime changes.
- Position sizing: Higher channel width implies higher risk — traders can adjust position size accordingly.
5. Parameters
- length (default: 50): Lookback period for the Donchian Channel. Higher values capture broader price ranges and produce smoother readings.
- atrPeriod (default: 14): Period for the ATR calculation. Standard setting works well for most timeframes.
- atrMultiplier (default: 2.0): Controls how much the ATR extends the channel beyond raw highs/lows. Higher values produce wider channel measurements.
- signalPeriod (default: 50): Smoothing period for the signal line. Lower values make it more reactive; higher values produce a steadier reference.
6. Donchian Volatility Indicator Code
//-----------------------------------------------------------//
//PRC_Donchian Volatility Indicator
//version = 0
//15.05.24
//Iván González @ www.prorealcode.com
//Sharing ProRealTime knowledge
//-----------------------------------------------------------//
//-----Inputs------------------------------------------------//
length=50//Lookback Period for Donchian Channel
atrPeriod=14//ATR Period
atrMultiplier=2.0//ATR Multiplier
signalPeriod=50//Length of Signal Line
//-----------------------------------------------------------//
//-----Calculate ATR-----------------------------------------//
atr=averagetruerange[atrPeriod](close)
//-----------------------------------------------------------//
//-----Calculate Upper and Lower Channels--------------------//
upperChannel=highest[length](high)+atr*atrMultiplier
lowerChannel=lowest[length](low)-atr*atrMultiplier
//-----------------------------------------------------------//
//-----Calculate Channel Width-------------------------------//
channelWidth=upperChannel-lowerChannel
//-----------------------------------------------------------//
//-----Signal Line-------------------------------------------//
signalLine=average[signalPeriod](channelWidth)
//-----------------------------------------------------------//
//-----Bar Color---------------------------------------------//
if channelWidth>signalLine then
   r=0
   g=230
   b=118
else
   r=224
   g=64
   b=251
endif
//This piece of code works in price chart
//DRAWCANDLE(open, high, low, close) coloured(r,g,b)
//-----------------------------------------------------------//
//-----Background Color--------------------------------------//
BACKGROUNDCOLOR (r,g,b,30)
//-----------------------------------------------------------//
//-----Plotting----------------------------------------------//
return channelWidth as "Channel Width"coloured("maroon")style(line,4),signalLine as "Signal Line"coloured("aqua")style(line,4)
7. Conclusion
The Donchian Volatility Indicator provides a clean, intuitive way to track volatility cycles by measuring the adaptive width of a Donchian Channel. The combination of the raw channel width with a signal line crossover system makes it easy to identify periods of expanding or contracting volatility at a glance.
The green/pink background coloring adds an extra layer of visual clarity, making regime shifts immediately obvious without needing to study the lines in detail.
