

MSL Trend Follow
MSL Trend Follow is a market structure trend-following indicator that combines pivot-based structure break detection with an ATR adaptive trailing stop. Rather than generating frequent signals on every price move, it focuses on identifying confirmed directional shifts in structure and then tracking that trend phase with a dynamic stop line for as long as the move remains valid.
Core Logic
The indicator monitors confirmed swing highs and swing lows using a pivot model. A bullish trend signal is generated when price closes above the most recent confirmed swing high. A bearish trend signal is generated when price closes below the most recent confirmed swing low.
Once a signal is active, an ATR trailing stop begins plotting and follows price using a one-directional ratchet:
During an uptrend, the stop only moves upward and never retraces downward. During a downtrend, the stop only moves downward and never retraces upward.
This prevents the stop line from oscillating with minor price noise, keeping the output clean and readable.
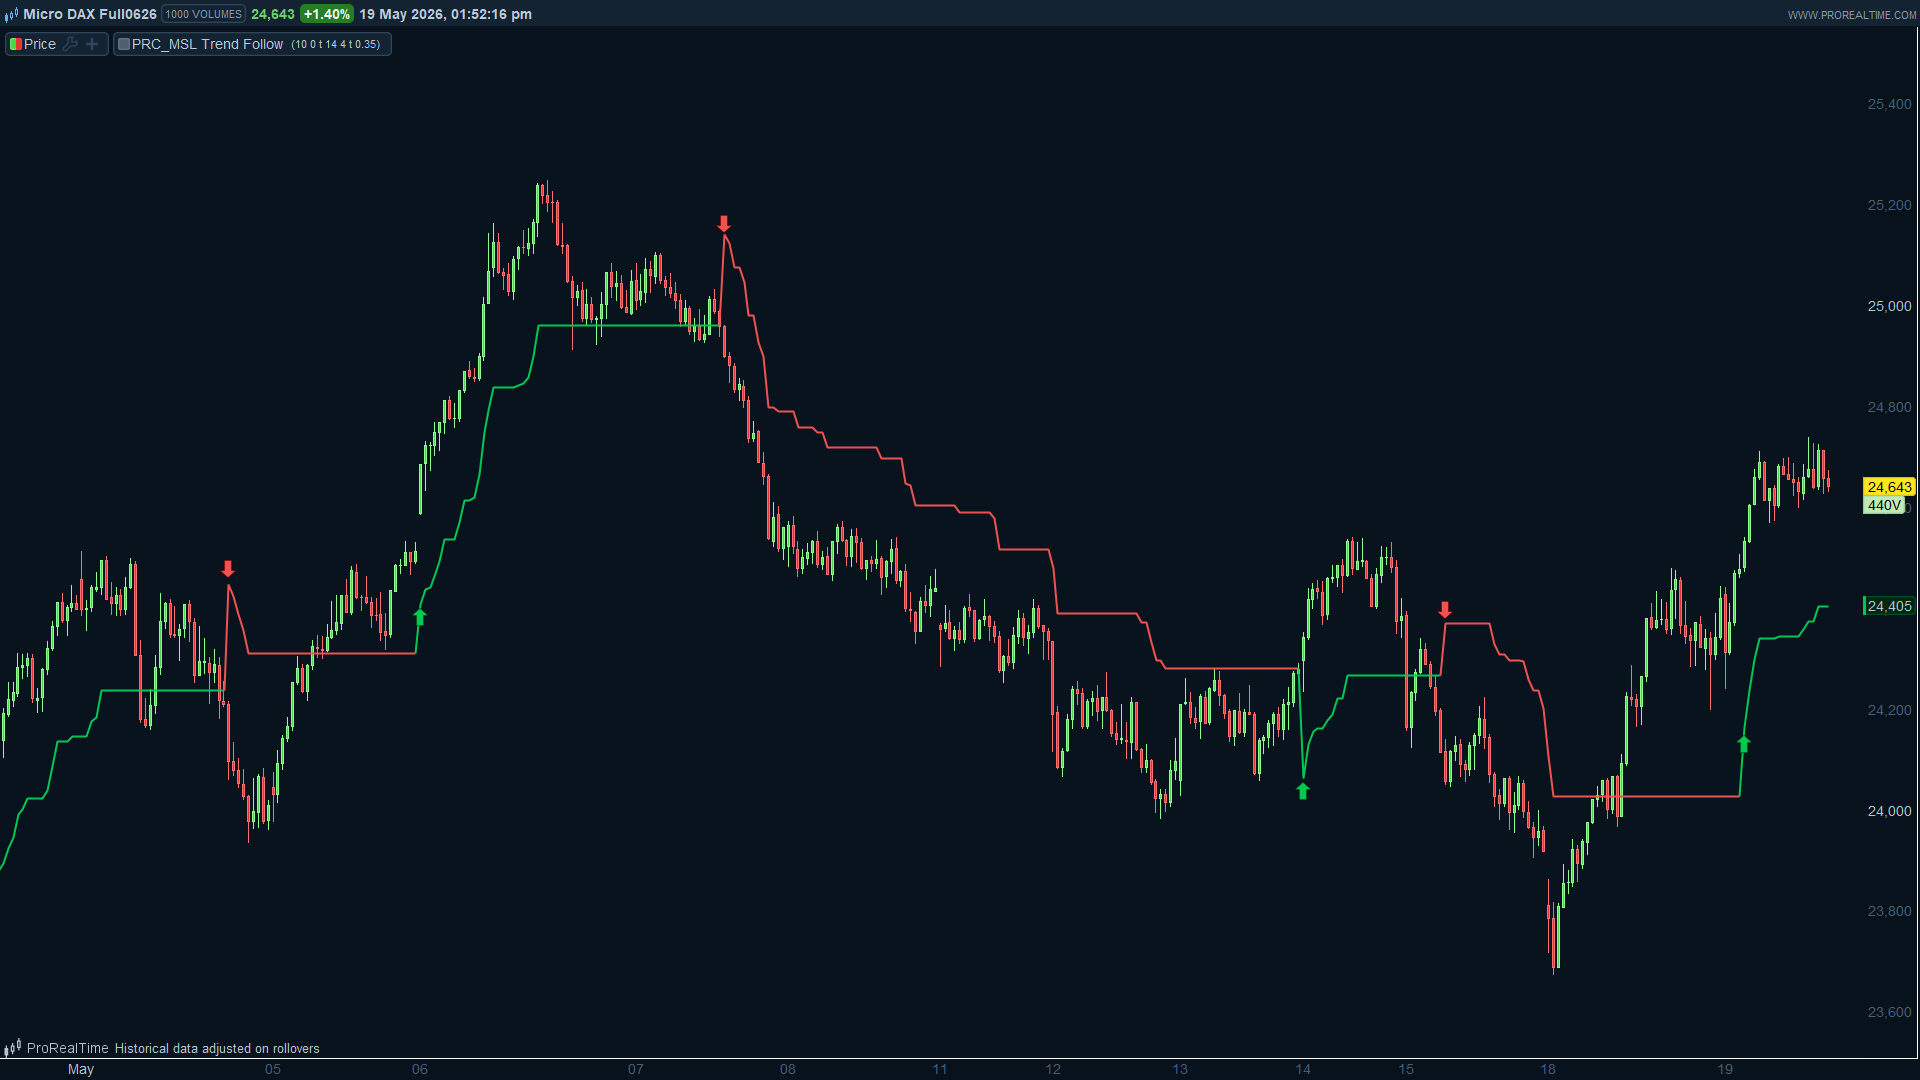
Chart Elements
- Green label — bullish structure break detected
- Red label — bearish structure break detected
- Green line — ATR trailing stop plotted below price during an uptrend
- Red line — ATR trailing stop plotted above price during a downtrend
Reading the Signals
A bullish setup is considered stronger when the trend state is UP, price is holding above the green trailing stop, the stop line itself is continuing to rise, signal age is relatively low, and the broader market context is supportive of upside continuation.
A bearish setup is considered stronger when the trend state is DOWN, price is holding below the red trailing stop, the stop line itself is continuing to fall, signal age is relatively low, and the broader market context is supportive of downside continuation.
Apply more caution when price is sitting very close to the trailing stop, when the signal age is high, when price is chopping back and forth around structural levels, or when the higher timeframe trend conflicts with the current signal direction.
Settings
- Pivot Length — controls the sensitivity of swing point detection. Lower values react faster and generate more signals. Higher values filter for larger structural swings and produce fewer, more selective signals.
- Min Bars Between Signals — sets a minimum bar gap between consecutive trend signals. Useful for reducing rapid flipping in choppy or low-volatility conditions.
- ATR Length — defines the ATR calculation period used for the trailing stop.
- ATR Multiplier — controls how far the trailing stop sits from price. A higher value gives the stop more breathing room and reduces early stop-outs. A lower value produces a tighter, faster-reacting stop.
- Signal Offset ATR — visual setting only. Controls how far signal labels are offset from the trailing stop line. Does not affect signal logic.
Suggested Timeframes
H1 for more active, faster-paced trading H4 for intraday and short swing context D1 for broader swing trend structure
The indicator can be applied to stocks, indices, forex, crypto, and commodities. Settings should be adapted to the asset and timeframe being used.
// MSL Trend Follow - ProRealTime / ProBuilder
// Converted from Pine Script v6
// original author: MarketStructureLab
// https://www.prorealcode.com
// Nicolas @ ProRealCode
// -------------------------------------------------------
// ---- INPUTS ----
msLen           = 10    // Pivot Length (bars each side)
minBarsBetween  = 0     // Min Bars Between Signals (0=off)
showStop        = 1     // Show Trailing Stop (1=yes, 0=no)
atrLen          = 14    // ATR Length
atrMult         = 4.0   // ATR Multiplier
showLabels      = 1     // Trend Labels (1=yes, 0=no)
labelOffset     = 0.35  // Signal label offset in ATR units

// ---- VOLATILITY ----
atrVal = AverageTrueRange[atrLen](close)

// ---- PIVOT DETECTION ----
// A confirmed pivot high at bar[msLen] requires it to be the highest
// in the full (2*msLen+1) window, mirroring Pine's pivothigh(msLen,msLen).
winSize = 2 * msLen + 1

isPH = (High[msLen] = Highest[winSize](High)) AND (High[msLen] > High[msLen + 1])
isPL = (Low[msLen]  = Lowest[winSize](Low))   AND (Low[msLen]  < Low[msLen + 1])

// Capture pivot values when confirmed (msLen bars ago)
once lastPH = 0
once lastPL = 999999999

if isPH then
   lastPH = High[msLen]
endif

if isPL then
   lastPL = Low[msLen]
endif

// ---- STATE ----
once trendState = 0   //  1 = bull,  -1 = bear,  0 = no signal yet
once lastSigBar = -999999
once trailStop  = 0

// ---- SIGNAL ENGINE ----
barsElapsed  = BarIndex - lastSigBar
filterOK     = (minBarsBetween = 0) OR (barsElapsed >= minBarsBetween)

bullCross    = (Close crosses over lastPH)  AND (trendState <> 1)  AND filterOK
bearCross    = (Close crosses under lastPL) AND (trendState <> -1) AND filterOK

if bullCross then
   trendState = 1
   trailStop  = Close - atrVal * atrMult
   lastSigBar = BarIndex
   if showLabels = 1 then
      DrawArrowUp(BarIndex, trailStop - atrVal * labelOffset) coloured(0, 200, 83)
   endif
endif

if bearCross then
   trendState = -1
   trailStop  = Close + atrVal * atrMult
   lastSigBar = BarIndex
   if showLabels = 1 then
      DrawArrowDown(BarIndex, trailStop + atrVal * labelOffset) coloured(239, 83, 80)
   endif
endif

// ---- RATCHET: trail stop follows price ----
if trendState = 1 AND NOT bullCross then
   newStp    = Close - atrVal * atrMult
   trailStop = Max(trailStop, newStp)
endif

if trendState = -1 AND NOT bearCross then
   newStp    = Close + atrVal * atrMult
   trailStop = Min(trailStop, newStp)
endif

// ---- PLOT TRAILING STOP ----
// DrawSegment gives full conditional control bar-by-bar
alpha=0
if showStop = 1 then
   alpha=255
   if trendState = 1 then
      r=0
      g=200
      b=83
   endif
   if trendState = -1 then
      r=239
      g=83
      b=80
   endif
endif

return trailstop coloured(r,g,b,alpha) style(line,2)