

ATR Fibonacci Trend Envelopes
Introduction
The ATR Fibonacci Trend Envelopes, designed by BigBeluga, wraps a configurable moving average in an ATR-scaled envelope and turns it into a directional trend tool. A simple state machine flips the trend the moment price closes beyond the outer band, and keeps that state until the opposite band is breached. What makes the indicator distinctive is not the envelope itself but the three internal Fibonacci retracements (0.5, 0.618, 0.786) that are projected inside the band and re-anchored depending on the trend direction — so the shaded “Golden Pocket” always sits on the side where a healthy pullback is expected.
It is a tool for traders who want a trend filter and a pullback map in a single overlay: the thick line tells you the regime, the pocket tells you where to look for continuation entries.
Theory Behind the Indicator
The Envelope and the State Machine
The baseline is a moving average of the close (Wilder/RMA by default, but any of SMA, EMA, WMA, HMA, RMA can be selected). The envelope is symmetric around that baseline:
basis      = MA(close, maLength, maType)
upperBand  = basis + ATR(atrLength) * atrMult
lowerBand  = basis - ATR(atrLength) * atrMult
The trend is a persistent state, not a per-bar comparison:
close crosses over upperBand -> trend = +1  (bullish)
close crosses under lowerBand -> trend = -1  (bearish)
otherwise           -> trend stays unchanged
This is the classic Supertrend-style latch: once the trend is set, noise inside the envelope does not flip it. Only a decisive close beyond the opposite band changes the regime.
The Direction-Aware Fibonacci Levels
This is the non-trivial part. The three internal levels are not retracements of a price swing — they are retracements of the envelope itself, and they switch their anchor with the trend:
range = upperBand - lowerBand
trend bullish: fib = lowerBand + range * (1 - ratio)
trend bearish: fib = upperBand - range * (1 - ratio)
With the three ratios this collapses to clean factors of the band range:
| Level | Factor of range | Bullish anchor | Bearish anchor |
|---|---|---|---|
| `1.0` (trail) | — | lowerBand | upperBand |
| `0.5` | 0.500 | from lowerBand up | from upperBand down |
| `0.618` | 0.382 | from lowerBand up | from upperBand down |
| `0.786` | 0.214 | from lowerBand up | from upperBand down |
In an uptrend the levels hang just above the lower band — exactly the area where a pullback in a healthy trend tends to find support. In a downtrend they drop from the upper band, mapping the resistance side of a bearish pullback. The trailing line (`1.0`) shows the lower band while bullish and the upper band while bearish, behaving like a Supertrend stop.
The Dynamic Golden Pocket
The band between `0.618` and `0.786` is shaded as the **Golden Pocket** — the high-probability reaction zone borrowed from classical Fibonacci trading. Because the whole structure is re-anchored by trend, the pocket is always positioned where continuation entries are statistically more attractive: near support in an uptrend, near resistance in a downtrend.
Key Features at a Glance
| Feature | Behaviour |
|---|---|
| Baseline | Configurable MA (SMA/EMA/WMA/HMA/RMA), default RMA(100) |
| Envelope width | ATR(100) × 3.0 |
| Trend | Latching state machine (close crossing outer bands) |
| Trailing line | Lower band (bullish) / upper band (bearish) |
| Internal levels | 0.5 / 0.618 / 0.786 of the band range, trend-anchored |
| Golden Pocket | Shaded 0.618–0.786 zone |
| Trend-change marker | Reversal price printed at the flip |
How to Read the Indicator
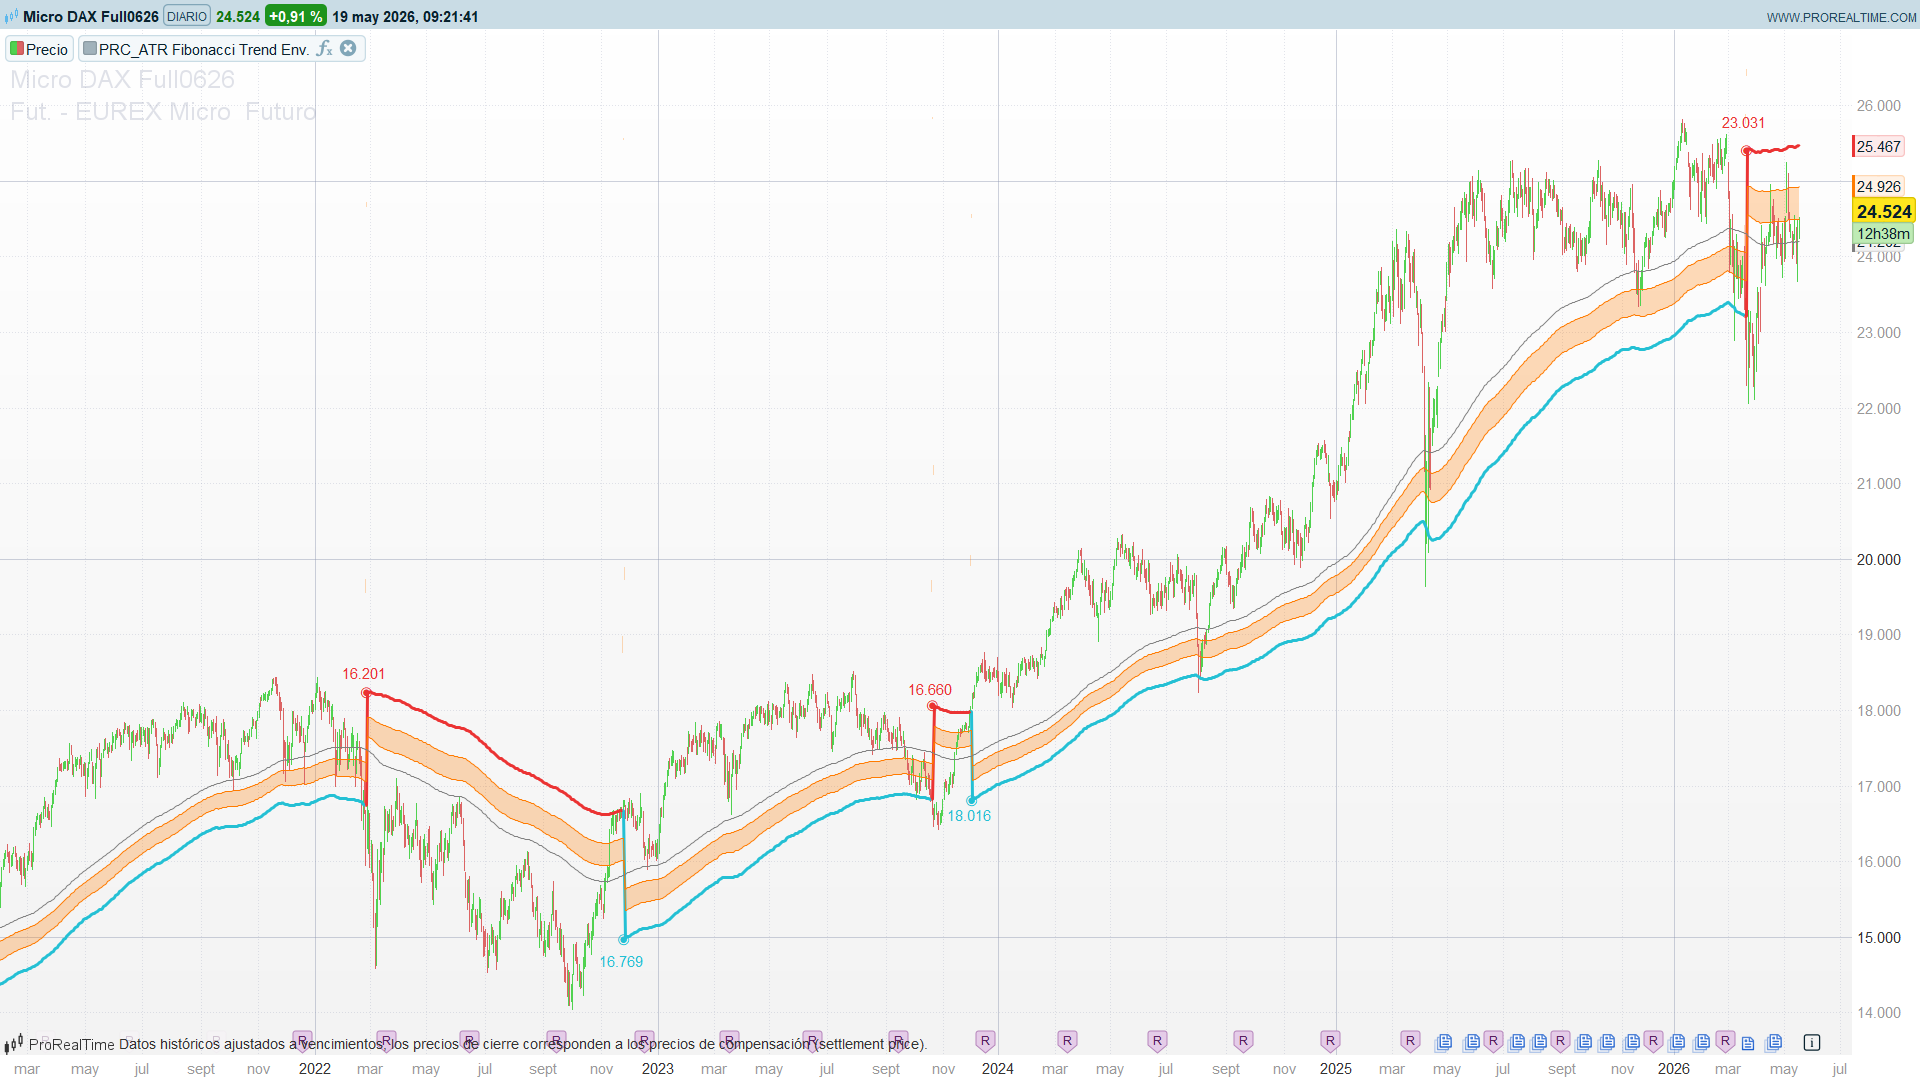
1. Regime first. A cyan thick line under price (bullish) or a red one above price (bearish) tells you the dominant trend. It only flips on a decisive close beyond the opposite band.
2. The trailing line is a stop reference. While bullish, the `1.0` line is the lower band — a logical place for a protective stop. The reverse holds while bearish.
3. Trade the Golden Pocket in the trend direction. In an uptrend, a pullback into the orange 0.618–0.786 zone is a continuation-long area. In a downtrend, the same zone is a continuation-short area.
4. The 0.5 line is the shallow-pullback marker. Reactions that hold above 0.5 (bullish) signal strength; a slide through the pocket toward `1.0` warns the trend is being tested.
5. The reversal label is the regime timestamp. The price printed at each flip is where the structure re-anchored — useful for measuring how far the new trend has travelled.
Practical Applications
1. Trend filter for any system. Allow longs only while bullish, shorts only while bearish. The latch avoids whipsaw on intrabar noise.
2. Pullback-continuation playbook. Wait for price to tag the Golden Pocket *with the trend*, then enter on the first reclaim toward the baseline, stop beyond the `1.0` trailing line.
3. Volatility-scaled stops. Because the bands are ATR-driven, the trailing line widens in volatile regimes and tightens in calm ones — a self-adjusting stop.
4. Mean-reversion fade (counter-trend, advanced). A deep pierce through `1.0` against the trend, immediately rejected, is an early reversal tell ahead of the official flip.
5. Multi-timeframe alignment. Run the envelope on the higher timeframe for regime, drop to the lower timeframe and take Golden-Pocket entries only in the higher-timeframe direction.
Indicator Configuration
| Parameter | Default | Description |
|---|---|---|
| `maType` | 3 | MA type: 0 SMA, 1 EMA, 2 WMA, 3 RMA/Wilder, 7 HMA |
| `maLength` | 100 | Baseline MA period |
| `atrLength` | 100 | ATR lookback for envelope width |
| `atrMult` | 3.0 | ATR multiplier (envelope half-width) |
The original Pine multi-timeframe dashboard and the future projection lines are intentionally omitted: ProBuilder has no table primitive and does not draw indicator curves into the future. The core trend/pocket logic — the actual value of the indicator — is reproduced exactly. The dynamic transparency of the pocket is simplified to a fixed semi-transparent orange.
Code
//--------------------------------------------------------//
//PRC_ATR Fibonacci Trend Envelopes [BigBeluga]
//version = 0
//18.05.26
//Iván González @ www.prorealcode.com
//Sharing ProRealTime knowledge
//--------------------------------------------------------//
//-----Inputs---------------------------------------------//
maType = 3
maLength = 100
atrLength = 100
atrMult = 3.0
//--------------------------------------------------------//
//-----Calculations---------------------------------------//
basis = average[maLength, maType](close)
atrValue = averagetruerange[atrLength]
upperBand = basis + atrValue * atrMult
lowerBand = basis - atrValue * atrMult

warmup = max(maLength, atrLength)

if barindex <= warmup then
   trend = 0
elsif close crosses over upperBand then
   trend = 1
elsif close crosses under lowerBand then
   trend = -1
else
   trend = trend[1]
endif

bandRange = upperBand - lowerBand

if trend = 1 then
   level100 = lowerBand
   fib50 = lowerBand + bandRange * 0.5
   fib618 = lowerBand + bandRange * 0.382
   fib786 = lowerBand + bandRange * 0.214
   r = 36
   g = 192
   b = 212
   p = -1
else
   level100 = upperBand
   fib50 = upperBand - bandRange * 0.5
   fib618 = upperBand - bandRange * 0.382
   fib786 = upperBand - bandRange * 0.214
   r = 235
   g = 51
   b = 51
   p = 1
endif
//--------------------------------------------------------//
//-----Trend change: linebr equivalent--------------------//
trendChange = trend <> trend[1]

if trend <> 0 and trendChange = 0 then
   pLevel = level100
   pFib50 = fib50
   pFib618 = fib618
   pFib786 = fib786
else
   pLevel = undefined
   pFib50 = undefined
   pFib618 = undefined
   pFib786 = undefined
endif
//--------------------------------------------------------//
//-----Golden pocket fill + trend-change marker-----------//
colorbetween(pFib618, pFib786, 255, 123, 0, 70)

if trendChange and trend <> 0 then
   src = close
   drawtext("◉", barindex, level100) coloured(r, g, b)
   drawtext("#src#", barindex, level100+atrValue*p) coloured(r, g, b)
endif
//--------------------------------------------------------//
RETURN pLevel COLOURED(r, g, b) STYLE(line, 3) AS "Trend MA",pFib618 COLOURED(255, 123, 0) STYLE(line, 1) AS "Fib 0.618",  pFib786 COLOURED(255, 123, 0) STYLE(line, 1) AS "Fib 0.786",pFib50 COLOURED(128, 128, 128) STYLE(line, 1) AS "Fib 0.5"
