STANDARD ERROR COMPOSITE BANDS
Transcript Code by @XeL_arjona
Ver. 1.00.a
Original implementation idea of bands by: Traders issue: Stocks & Commodities V. 14:9 (375-379):
Standard Error Bands by Jon Andersen
Introduction and Implementation:
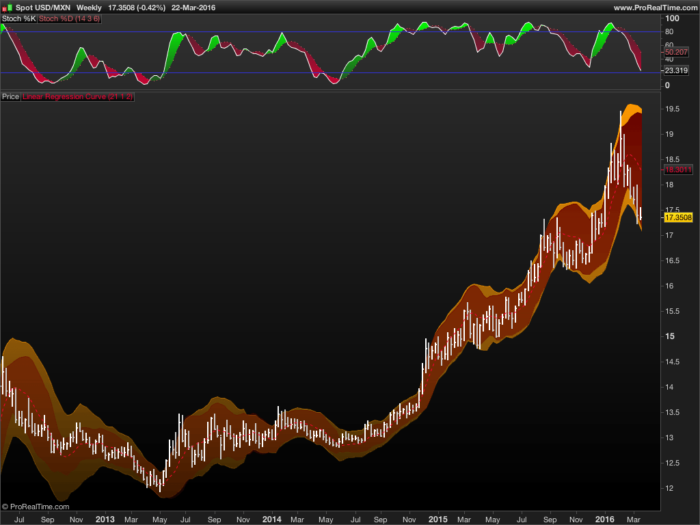
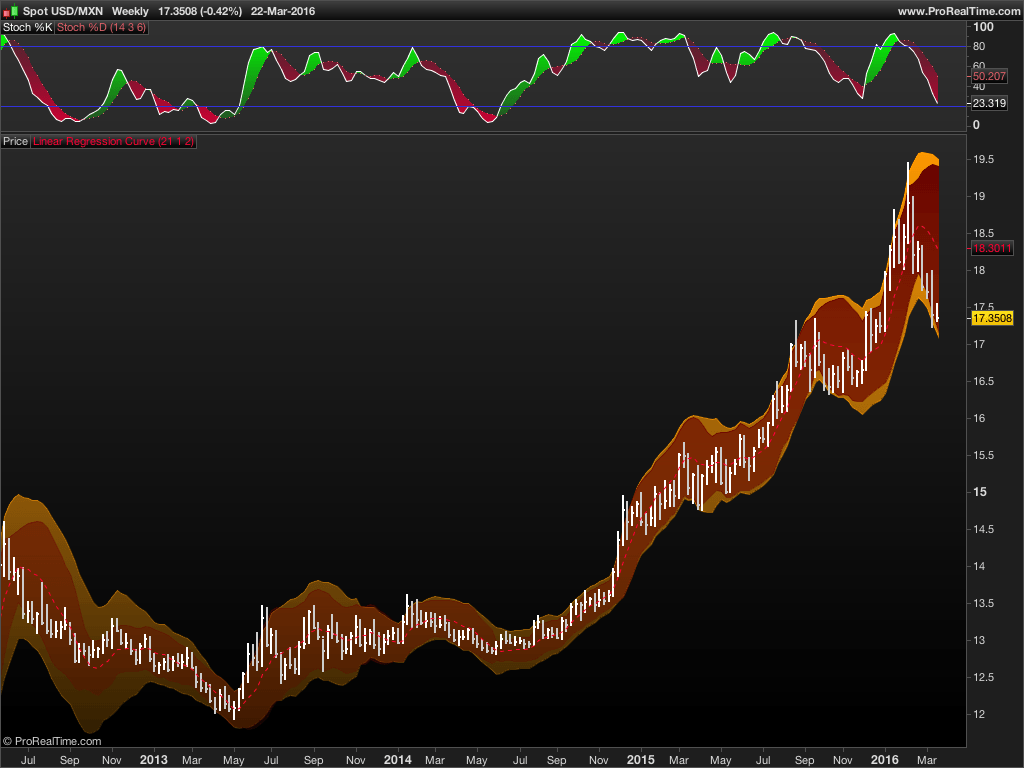
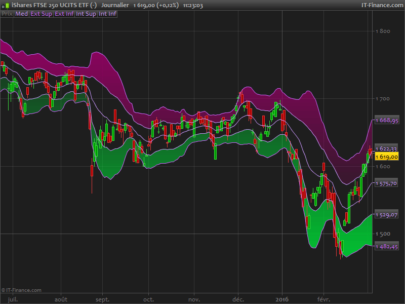
STANDARD ERROR BANDS are quite different than Bollinger’s. First, they are bands constructed around a linear regression curve. Second, the bands are based on standard errors with a factor multiplier above and below this regression line. The error bands measure the STANDARD ERROR OF THE ESTIMATE around the linear regression line. Therefore, as a price series follows the course of the regression line the bands will narrow, showing little error in the estimate. As the market gets noisy and random, the error will be greater resulting in wider bands.
An Additional “alpha-beta (y-y’) algorithm” of Standard Error is implemented as additional -Resistance/Support- on bands. The algorithm was originally made for TradingView’s pine version by user @glaz.
Links for further reference:
Standard Error Bands by Jon Andersen Implementation
What is a STANDARD ERROR ? (Wikipedia)
Resumed explanation of what is an STANDARD ERROR OF THE ESTIMATE.
The CODE:
P = 21, SDEG = 1, MF=2
|
1 2 3 4 5 6 7 8 9 10 11 12 13 14 15 16 17 18 19 20 21 22 23 24 25 26 27 |
// Standard Error of the Estimate (Composite Bands) AR = close N = barindex LR = Average[SDEG](linearregression[P](AR)) // BETA bv1 = summation[P](N*AR) - (P*Average[P](N)*Average[P](AR)) bv2 = summation[P](square(N)) - (P*square(Average[P](N))) CalcB = bv1/bv2 // ALPHA CalcA = Average[P](AR) - (CalcB*Average[P](N)) // STANDARD ERROR OF THE ESTIMATE sev1 = Summation[P](square(AR)) - (CalcA*Summation[P](AR)) - (CalcB*Summation[P](N*AR)) sev2 = Summation[P](square(LR-AR)) sev3 = P - 2 SEnarrow = sqrt(sev1/sev3) SEwide = sqrt(sev2/sev3) // BANDS NarrowUB = LR + (SEnarrow*MF) NarrowBB = LR - (SEnarrow*MF) WideUB = LR + (SEwide*MF) WideBB = LR - (SEwide*MF) // OUTPUT RETURN LR AS "Linear Regression Curve", NarrowUB AS "StandardError Narrow UpperBand", NarrowBB AS "StandardError Narrow BottmBand", WideUB AS "StandardError Wide UpperBand", WideBB AS "StandardError Wide BottomBand" |
Share this
No information on this site is investment advice or a solicitation to buy or sell any financial instrument. Past performance is not indicative of future results. Trading may expose you to risk of loss greater than your deposits and is only suitable for experienced investors who have sufficient financial means to bear such risk.
ProRealTime ITF files and other attachments :
Find other exclusive trading pro-tools on ![]()
PRC is also on YouTube, subscribe to our channel for exclusive content and tutorials


Very nice and qualitative contribution to the Library, well done xel! I’m looking forward for any other post by you.
Thanks a lot Nicolas!
This is a very helpful indicator to catch “Fastest Moves” if you use it alongside with Bollinger’s for the same RollingBack window period.
Can’t attach images, but you can as an example of what Im saying, apply both Bollinger alongside with StandardErrorBands to any mayor US Index weekly with a 52 looking back period to see what I mean! 😉
Thanks for this one, I was hoping PRT would add this.