Simple Moving Average Crossing Areas

v10.3
Simple Moving Average Crossing Areas

Hi all,

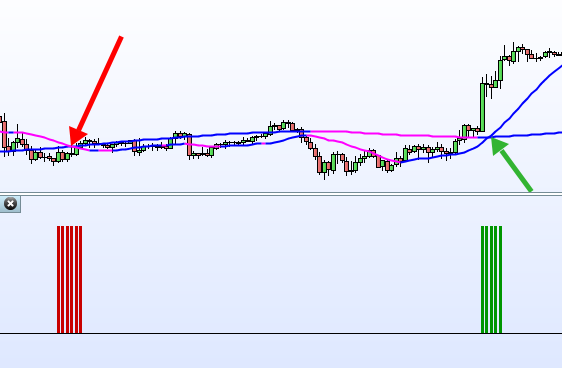
I create and indicator that highlighted the moment previous to a crossing SMA and the moment afterwards. What is called “Golden Cross” and “Death Cross”

The indicator is very simple but an be very usefully for an automatic strategy. Because it shows in real time the moment where is inevitable the crossing of two Simple Moving Average and the moment afterwards.

How it can be used? well I can imagine an strategy using it as a filter for Higher Time Frame or multi crossing of SMA in different time frame.

Hope you like it.

Share this

Risk disclosure:

No information on this site is investment advice or a solicitation to buy or sell any financial instrument. Past performance is not indicative of future results. Trading may expose you to risk of loss greater than your deposits and is only suitable for experienced investors who have sufficient financial means to bear such risk.

ProRealTime ITF files and other attachments : How to import ITF files into ProRealTime platform?

PRC is also on YouTube, subscribe to our channel for exclusive content and tutorials

  1. Kris75 • 12/03/2018 #

    Hi Leo

    Line 2 period = 100 // => period002 right ?

  2. Leo • 12/03/2018 #

    Yeah. Inputs are period001 and period002. Strange… I think the post were edited. Anyway

  3. Carlos Garcia • 12/03/2018 #

    i think must check the code

  4. Leo • 12/03/2018 #

    Period001 and period002 are the inputs of the variables. When I update the code the fisrt two lines where not there. so you can delete them or directly import the ITF file.

  5. Leo • 12/03/2018 #

    By the way I create a very interesting strategy that look very nice even in walkforward test ( just tested in AUD/USD in 5min timeframe)

    DEFPARAM PRELOADBARS=1000

    //Period001= //from 10 to 40 step 10
    //Period002= //from 120 to 300 step 30
    //Period003= //from 10 to 40 step 10
    //Period004= //from 120 to 300 step 30
    //Pentry= // from 7 to 28 step 7
    //Kp= //from 1 to 2 step 0.5

    WMA001=weightedaverage[period001](close)
    WwMA001=weightedaverage[period001](WMA001)
    SMA002=average[period002](close)

    //Crossing areas definiton
    CrossingBULL1=0
    IF WMA001 > SMA002 and WwMA001 < SMA002 then
    CrossingBULL1=1
    ENDIF
    CrossingBEAR1=0
    IF WMA001 SMA002 then
    CrossingBEAR1=1
    ENDIF

    timeframe(1 hour, default)
    //Crossing areas definiton
    WMA003=weightedaverage[period003](close)
    WwMA003=weightedaverage[period003](WMA003)
    SMA004=average[period004](close)
    CrossingBULL2=0
    IF WMA003 > SMA004 and WwMA003 < SMA004 then
    CrossingBULL2=1
    ENDIF
    CrossingBEAR2=0
    IF WMA003 SMA004 then
    CrossingBEAR2=1
    ENDIF

    timeframe(default)

    ONCE PXentry=round(0.6*Pentry)
    highest1=highest[Pentry](high)
    IF highest1 = highest1[PXentry] then
    Re1=highest1
    ENDIF
    IF high > Re1 then
    Re1=high
    ENDIF
    lowest1=lowest[Pentry](low)
    IF lowest1 = lowest1[PXentry] then
    S1=lowest1
    ENDIF
    If low 3 and hour<22 and DayOfWeek<=5 then
    // Bedingungen zum Einstieg in Long-Positionen
    IF NOT LongOnMarket AND CrossingBULL1=1 and CrossingBULL2=1 THEN
    stoploss=(close – S1)/pipsize +2*pipsize
    BUY 1 CONTRACTS AT MARKET
    SET STOP PLOSS stoploss
    SET TARGET PPROFIT Kp*stoploss
    ENDIF

    // Bedingungen zum Ausstieg von Long-Positionen
    If LongOnMarket AND CrossingBEAR1=1 THEN
    SELL AT MARKET
    ENDIF

    // Bedingungen zum Einstieg in Short-Positionen
    IF NOT ShortOnMarket AND CrossingBEAR1=1 and CrossingBEAR2=1 THEN
    stoploss=(Re1-close)/pipsize + 2*pipsize
    SELLSHORT 1 CONTRACTS AT MARKET
    SET STOP PLOSS stoploss
    SET TARGET PPROFIT Kp*stoploss
    ENDIF

    // Bedingungen zum Ausstieg aus Short-Positionen
    IF ShortOnMarket AND CrossingBULL1=1 THEN
    EXITSHORT AT MARKET
    ENDIF

    ENDIF

  6. Stenozar • 12/03/2018 #

    Hi Leo, can you explain how the strategy works? I don’t know how to program and so it’s not easy for me to understand it by reading the code. THANKS!

  7. Leo • 12/03/2018 #

    Two SMA are crossing in a time frame (5min) while another 2 SMA are crossing in a higher Time Frame (1hour) stop loss is set to next support resistace.

  8. Stenozar • 12/03/2018 #

    Thanks Leo!

  9. Madrosat • 12/03/2018 #

    Hi Leo
    something is missing in the strategy above because it does not work at all as it is

  10. Leo • 12/03/2018 #

    I don’t know, I just copy paste the strategy. The optimisation of the values I wrote them in the code: line 3 to 8

    • bertrandpinoy • 12/03/2018 #

      hello Leo I’m spending time on your strategy code. do you agree to try to include this code (see ITF file) and try to make it work. I don’t know how to do it alone yet. thank you. it is surely necessary to remove MMperiode from my code too …

  11. bertrandpinoy • 12/03/2018 #

    //version a: ajout filtre MM

    defparam cumulateorders=false

    // — paramètres
    taille = 1 //taille de contrat pour les prises de position
    active3Bougies = 1 //active ou non une suite de 3 bougies consécutives cul plate ou non (1 = OUI / 0 = NON)
    culPlat = 100 //cul plat en pourcentage (taille de la meche en % de taille global)
    MMperiode = 20 //période de la moyenne mobile (filtre pour prises de position)
    // — fin des paramètres

    avg = average[MMperiode](close)
    xClose = (open+high+low+close)/4
    IF BarIndex=0 THEN
    xOpen = open
    xHigh = high
    xLow = low
    ELSe
    xOpen = (xOpen[1] + xClose[1])/2
    xHigh = Max(Max(high, xOpen), xClose)
    xLow = Min(Min(low, xOpen), xClose)
    ENDIF
    irange = xhigh-xlow

    red = xclose<xopen and ((xhigh-xopen)/irange)xopen and ((xopen-xlow)/irange)<=(100-culplat)/100

    if active3Bougies then
    redcons = summation[3](red)=3
    greencons = summation[3](green)=3
    else
    redcons = red
    greencons = green
    endif

    if not onmarket and redcons and xcloseavg then
    buy taille contract at market
    endif

    //graph (xhigh-xopen)/irange
    //graph greencons coloured(0,255,0)

avatar
Register or

Likes

avatar avatar avatar avatar
Related users ' posts
ak5hay2 Works like crazy on bitcoin. Use different timeframes. Thanks a lot Doc!!!
richyowen Hi, great code thanks. Very new to this forum. Is there a way to add a 100point target on an...
lisamitch50 Morning all, Just backtested on quite a few instruments, worked well on backtesting, but tel...
swapping merci gabri, on va le mettre à l'essai ;)
Leo Hi all, I posted a new version of this indicator ( I just add arrows to spot the local maxi...
Trading_En_El_Ibex35 Muchas Gracias por compartir este interesante indicador. Un saludo
xavieralava hola gracias leo
Khaled Thanks, but if I may ask what's EMA Period? The price which reverses the EMA[20] is not the ...
Francesco78 EMA is not a moving average, it is just the name we called the quantity defined above
Khaled My bad. Thank you so much!
rejo007 hello david, i'll try it could you tell me wich strategy do you use in real? thanks
David Somogyi Hello, I have a couple of DAX strategies of breakout and mean reversion. I'll try to post...
Roberto Blázquez Hi David, I just saw your strategy and it's good!!! I'm going to try it from today in real a...
Thomas007 Is there any way to build something similar for FX? I wonder what would be the replacement f...
Kris75 Hi Bolsatrilera, I love this indicator! Thanks; => did you develop a strategy around...
KarlBenjamin This "indicator" alone has completely changed my algorithms for the better! Id even go as fa...
ashee CAN YOU SHARE MT4 FILE
coyP Big thanks ! Can you explain me how can I put this ON my graph and not under the graph please ?
Wing There's a few threads on the forum about backtest and live trades being different at times. ...
ET I agree with verdi55. As it is now, the code will only test for a breakout on the upside (li...
Philipjonasson are u still active Wing?
Nicolas We do not offer free assistance for TOS. However, you can send demand for private paid codin...
phanz Hi community. May I know how you use this indicator please? Is it on the zero cross over? ...
sydney43025 Hello, I'm digging up this topic because I uploaded the code on a PRT v11.1 but the indicato...
David Balance thanks for sharing this excellent indicator.  Here are some thoughts.  please ad...
supertiti Il manque 2 slash devant len dans le code dur car la variable ne marche pas bonne journée
bearbull As per PhilipSchultz question above, has anybody managed to add code for when it turns blue,...
Ybr35 Bonjour Nicolas, lorsque je lance l'indicateur, il m'est indiqué que je dois définir les var...
Nicolas L'idéal est de télécharger le fichier itf joint sur cette page et de l'importer dans la plat...
Nicolas Merci dans ce cas d'ouvrir un sujet dans le forum ProScreener svp.
Andrea Hi Nicolas, thx for your code. Please i need your help to understand this part of your code:...
Nicolas the MA200 is ascending since 20 periods.
Leo Hi Gabri, have you ever try this in a trading system?
gabri Leo, I used to crosscheck this indicator a long time ago. For the trading I was doing at tha...
Nolubok Bonjour Gabri, merci pour l'ensemble de vos publications, serait il possible d'avoir le scr...
David Somogyi Hello, This is merely a filter indicator for measuring high fractality, which helps to av...
bertrandpinoy bonjour ce code fonctionne toujours?
Nicolas Faites un backtest, vous aurez des réponses.
Krallenmann Hallo Nicolas, kannst du mir die Regeln für den Halftrend Indikator sagen? Aus dem Code kann...
davefransman Dear Nicolas, i want set a alert on the "HalfTrend "custom moving average" met Heikin Ashi w...
Nicolas Please post the question in a new forum topic, that would need custom coding I believe.
Lyam Pareil ne marche pas dommage
ahmedbouaziz89 Bonjour, quand j'ajoute le code ou le fichier dans l'outils screeners de Prorealtime je ne v...
tyvix Bonjour le code marche bien c est juste qu'il n y a pas d opportunité au moment ou vous le...
Sofitech Ce code n'est valable que sur la V10.3 ? sur le 10.2 il y a une erreur de syntaxe dans le fi...
Nicolas Oui en effet, c'est un indicateur "10.3" à cause uniquement de la mise en forme des courbes ...

Top