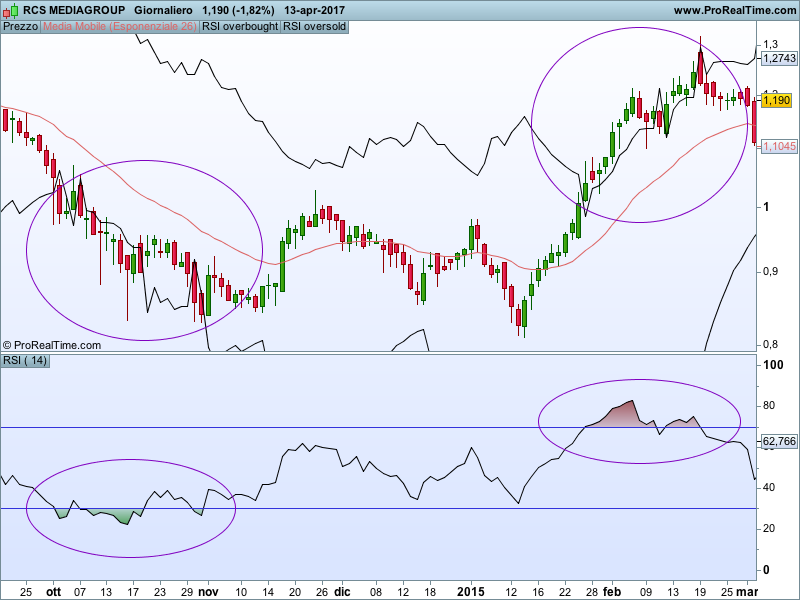
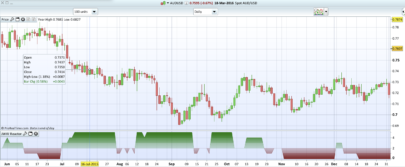
This code draws the overbought/oversold lines on the price. You can change the default values (70 and 30) with the one you like the most and you can also add a EMA[26](close) that represent perfectly the RSI-50 line.
Blue skies
|
1 2 3 4 5 6 7 8 9 10 11 12 13 14 15 16 17 18 19 20 21 22 23 24 25 26 27 28 29 30 31 32 33 34 35 36 37 38 39 40 41 42 43 44 45 46 47 48 49 50 51 |
// oversold-overbought RSI band on price RSIsuplimit=70 RSIinflimit=30 a=rsi[14](close) up=max(close-close[1],0) down=max(0,close[1]-close) avgUPieri=wilderaverage[14](up[1]) avgDOWNieri=wilderaverage[14](down[1]) //calcolo fasci superiore if a[1]<=RSIsuplimit then RAPPsuplimit=RSIsuplimit/(100-RSIsuplimit) avgUPoggiRSIsuplimit=avgDOWNieri*RAPPsuplimit upSUPlimit=(avgUPoggiRSIsuplimit*14)-(avgUPieri*13) else RAPPsuplimit=RSIsuplimit/(100-RSIsuplimit) avgDOWNoggiRSIsuplimit=avgUPieri/RAPPsuplimit downSUPlimit=(avgDOWNoggiRSIsuplimit*14)-(avgDOWNieri*13) endif if a<=RSIsuplimit then sup=close[1]+upSUPlimit else sup=close[1]-downSUPlimit endif //calcolo fascia inferiore if a[1]<=RSIinflimit then RAPPinflimit=RSIinflimit/(100-RSIinflimit) avgUPoggiRSIinflimit=avgDOWNieri*RAPPinflimit upINFlimit=(avgUPoggiRSIinflimit*14)-(avgUPieri*13) else RAPPinflimit=RSIinflimit/(100-RSIinflimit) avgDOWNoggiRSIinflimit=avgUPieri/RAPPinflimit downINFlimit=(avgDOWNoggiRSIinflimit*14)-(avgDOWNieri*13) endif if a<=RSIsuplimit then sup=close[1]+upSUPlimit else sup=close[1]-downSUPlimit endif if a<=RSIinflimit then inf=close[1]+upINFlimit else inf=close[1]-downINFlimit endif return sup as "RSI overbought", inf as "RSI oversold" |
Share this
No information on this site is investment advice or a solicitation to buy or sell any financial instrument. Past performance is not indicative of future results. Trading may expose you to risk of loss greater than your deposits and is only suitable for experienced investors who have sufficient financial means to bear such risk.
ProRealTime ITF files and other attachments :
Find other exclusive trading pro-tools on ![]()
PRC is also on YouTube, subscribe to our channel for exclusive content and tutorials


Another fine piece of code gabri! Excellent work again. Thanks a lot for your precious contribution.
Thanks Nicolas!!
bravo, molto intelligente.
this did not add to price window, but was added to seperate indicator window at bottom.
how to add it to price directly as shown in the above picture ?
Add it on the price, by using the wrench on the left upper side of the price chart.
Hi, nice indicator, it´s possible to include a middle line with 50 value? ty!
Hi, EMA26 approximate almost exactly the 50% line
Wilder MA is exactly the 50% line