





Random Walk Edge
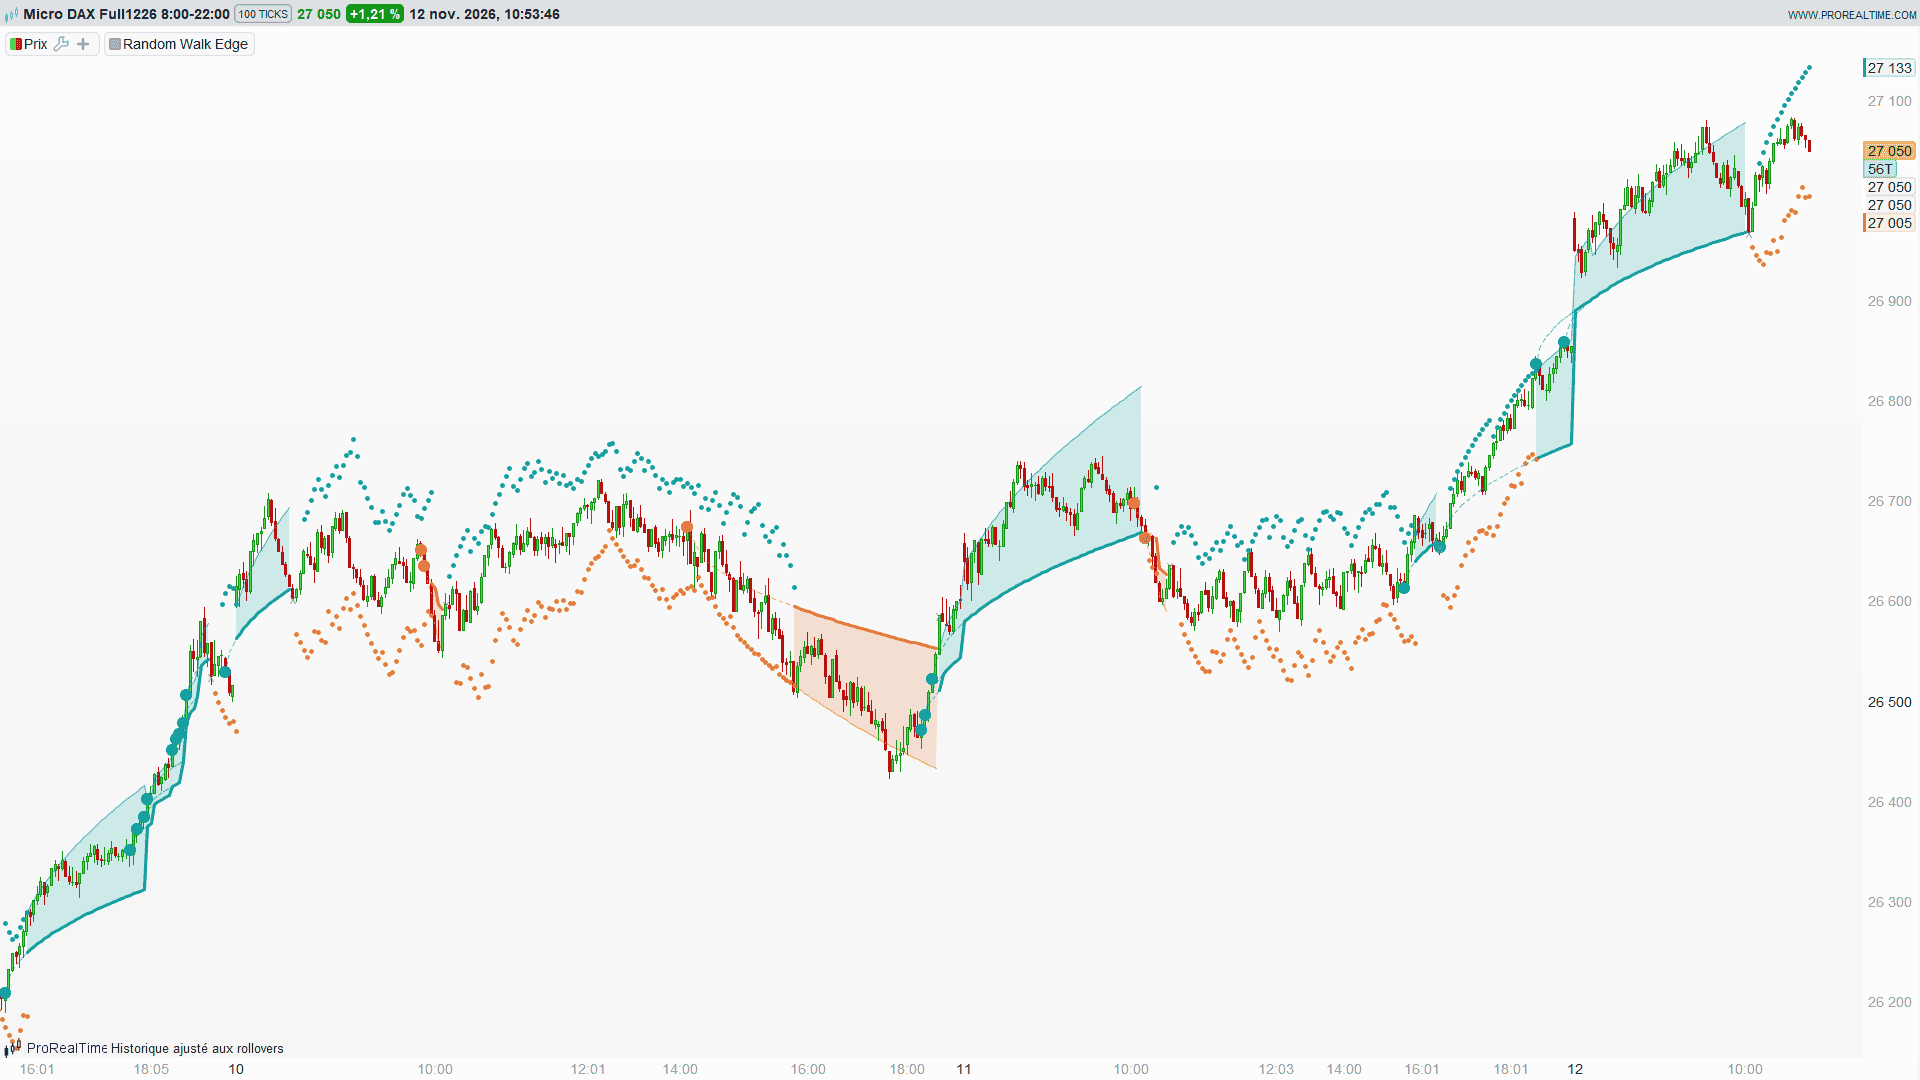
Without a trend, price drifts away from its starting point like the square root of time: twice as far takes four times as long. This indicator uses that law as a boundary. A trend is declared only when the move from a recent origin exceeds what randomness explains: threshold x volatility x square root of the number of bars. The origin of the move is then found afterwards, and the stop is a curve of the same family instead of a fixed distance.
A shock of three volatilities in one bar and a drift of three volatilities over twenty bars are therefore not judged the same way. There is no breakout period to choose: the indicator tests every origin of the last bars and picks the most significant one.
How to read it
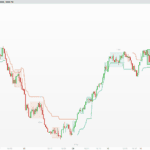
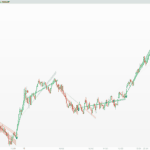
- Band: from the floor (thick line, or ceiling in a downtrend) to the edge of randomness (thin line). Above the edge the trend is clear; inside the band it is losing strength.
- Dot: the retained origin of the move. Dotted curve: the floor between that origin and the bar that validated it.
- Two dotted levels outside a trend: the thresholds the next close must cross to declare a rising or falling trend.
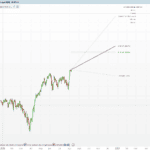
- Dotted curves on the right: floor and edge of the next bars, already known.
- x: end of trend, the close crossed back the floor.
Settings
- threshold (2.4): the edge of randomness, in volatilities x square root of bars. Lower it towards 2.0 for earlier signals and more noise.
- stopRatio (0.5): the floor uses threshold x stopRatio.
- volPeriod (20): volatility is the Wilder average of the absolute close change, converted to a standard deviation.
- lookback (60): maximum age of a candidate origin.
- minAge / migrAge (3 / 4): minimum age of an origin to declare a trend, and to move the floor to a more recent origin.
Limits
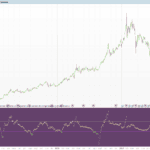
A steady trend without thrusts is detected late: on the CAC 40 daily it stayed neutral through a regular rise at the default threshold. A slow drift against the trend is tolerated for a long time. It is also the heaviest of my three trend experiments, with a loop of up to 60 bars on each bar. The square-root law comes from the statistics of random walks; I do not know of a trend indicator built on it. This is a visual tool and has not been tested as a trading system.
//----------------------------------------------------------------
// PRC_Random Walk Edge | indicator
// Author: Nicolas
// Date: 12.11.2026
// https://www.prorealcode.com
// License: CC BY-NC 4.0 - free to use, share and modify for
// non-commercial purposes, provided the author and the source
// above are credited.
// https://creativecommons.org/licenses/by-nc/4.0/
//----------------------------------------------------------------
// RANDOM WALK EDGE - the boundary of randomness
// Without a trend, price drifts away from its origin like the square root of time.
// A trend is declared when the move exceeds threshold x volatility x sqrt(duration)
// from a recent origin. The floor (ceiling in a downtrend) is the same curve with
// a smaller coefficient; it moves to a more recent origin as soon as a new
// significant thrust starts from there.
DEFPARAM DrawOnLastBarOnly = true

// ---------- Settings
threshold = 2.4 // boundary of randomness, in volatilities x sqrt(duration)
stopRatio = 0.5 // floor = threshold x stopRatio
volPeriod = 20
lookback = 60 // maximum age of a candidate origin, in bars
minAge = 3 // minimum age of an origin to declare a trend
migrAge = 4 // minimum age of an origin to move the floor
projection = 12 // number of bars projected to the right
maxOrigins = 40 // number of past origins redrawn

// volatility per bar: mean absolute close change, converted to a standard deviation
sigma = WilderAverage[volPeriod](ABS(close - close[1])) * 1.2533
kStop = threshold * stopRatio

ONCE ready = 0
ONCE regime = 0
ONCE nO = 0
ONCE nF = 0

// outside a trend, the curves stick to the price and are made invisible
stopLine = close
edgeLine = close
okUp = 0
okDn = 0

IF ready = 0 THEN
IF barindex > volPeriod + 2 AND sigma > 0 THEN
minUp = barindex
minDn = barindex
peakBar = barindex
peakPrice = close
troughBar = barindex
troughPrice = close
orgBar = barindex
orgPrice = close
orgSig = sigma
ready = 1
ENDIF
ELSE
IF regime <> 0 THEN
age = barindex - orgBar
lvl = orgPrice + regime * kStop * orgSig * SQRT(age)
IF regime * (close - lvl) < 0 THEN
// the close crosses back the floor: end of trend
$fX[nF] = barindex
$fY[nF] = close
nF = nF + 1
IF regime = 1 THEN
minUp = barindex
minDn = peakBar
ELSE
minDn = barindex
minUp = troughBar
ENDIF
regime = 0
ELSE
IF regime = 1 AND close >= peakPrice THEN
peakPrice = close
peakBar = barindex
ENDIF
IF regime = -1 AND close <= troughPrice THEN
troughPrice = close
troughBar = barindex
ENDIF
// migration: more recent origin from which a significant thrust starts
bestV = lvl
jBest = 0
jMax = MIN(lookback, age - 1)
IF jMax >= migrAge THEN
FOR j = migrAge TO jMax DO
gap = sigma[j] * SQRT(j)
IF gap > 0 THEN
z = regime * (close - close[j]) / gap
IF z >= threshold THEN
v = close[j] + regime * kStop * gap
IF regime * (v - bestV) > 0 THEN
bestV = v
jBest = j
ENDIF
ENDIF
ENDIF
NEXT
ENDIF
IF jBest > 0 THEN
orgBar = barindex - jBest
orgPrice = close[jBest]
orgSig = sigma[jBest]
$oX[nO] = orgBar
$oY[nO] = orgPrice
$oS[nO] = orgSig
$oV[nO] = barindex
$oD[nO] = regime
nO = nO + 1
ENDIF
ENDIF
ENDIF
IF regime = 0 THEN
// outside a trend: test recent origins, in both directions
zUp = threshold
jUp = 0
zDn = -threshold
jDn = 0
jMax = MIN(lookback, barindex - MIN(minUp, minDn))
IF jMax >= minAge THEN
FOR j = minAge TO jMax DO
gap = sigma[j] * SQRT(j)
IF gap > 0 THEN
z = (close - close[j]) / gap
IF barindex - j >= minUp AND z >= zUp THEN
zUp = z
jUp = j
ENDIF
IF barindex - j >= minDn AND z <= zDn THEN
zDn = z
jDn = j
ENDIF
ENDIF
NEXT
ENDIF
IF jUp > 0 OR jDn > 0 THEN
jOrg = jDn
regime = -1
IF jUp > 0 AND (jDn = 0 OR zUp >= -zDn) THEN
jOrg = jUp
regime = 1
ENDIF
orgBar = barindex - jOrg
orgPrice = close[jOrg]
orgSig = sigma[jOrg]
peakBar = barindex
peakPrice = close
troughBar = barindex
troughPrice = close
$oX[nO] = orgBar
$oY[nO] = orgPrice
$oS[nO] = orgSig
$oV[nO] = barindex
$oD[nO] = regime
nO = nO + 1
ENDIF
ENDIF
IF regime <> 0 THEN
age = barindex - orgBar
stopLine = orgPrice + regime * kStop * orgSig * SQRT(age)
edgeLine = orgPrice + regime * threshold * orgSig * SQRT(age)
ELSE
// thresholds the next close must cross to declare a trend
jMax = MIN(lookback - 1, barindex - MIN(minUp, minDn))
IF jMax >= minAge - 1 THEN
FOR j = minAge - 1 TO jMax DO
gap = sigma[j] * SQRT(j + 1)
IF barindex - j >= minUp THEN
v = close[j] + threshold * gap
IF okUp = 0 OR v < trigUp THEN
trigUp = v
okUp = 1
ENDIF
ENDIF
IF barindex - j >= minDn THEN
v = close[j] - threshold * gap
IF okDn = 0 OR v > trigDn THEN
trigDn = v
okDn = 1
ENDIF
ENDIF
NEXT
ENDIF
ENDIF
ENDIF

// ---------- colour by regime
rT = 130
gT = 140
bT = 150
IF regime = 1 THEN
rT = 0
gT = 153
bT = 153
ELSIF regime = -1 THEN
rT = 226
gT = 106
bT = 44
ENDIF

// curves and band are drawn from the second bar of a trend onwards
aBand = 0
aStop = 0
aEdge = 0
IF regime <> 0 AND regime = regime[1] THEN
aBand = 45
aStop = 255
aEdge = 170
ENDIF
COLORBETWEEN(stopLine, edgeLine, rT, gT, bT, aBand)

// trigger thresholds: those computed on the previous bar apply to this close
tUp = close
tDn = close
aTU = 0
aTD = 0
IF okUp[1] = 1 THEN
tUp = trigUp[1]
aTU = 220
ENDIF
IF okDn[1] = 1 THEN
tDn = trigDn[1]
aTD = 220
ENDIF

// ---------- drawings, rebuilt on the last bar
IF IsLastBarUpdate AND ready = 1 THEN
// retained origins, and dotted curve between the origin and its validation
IF nO > 0 THEN
FOR k = MAX(0, nO - maxOrigins) TO nO - 1 DO
cr = 226
cg = 106
cb = 44
IF $oD[k] = 1 THEN
cr = 0
cg = 153
cb = 153
ENDIF
nSeg = $oV[k] - $oX[k]
segLen = MAX(1, ROUND(nSeg / 8))
cur = 0
WHILE cur < nSeg DO
nxt = MIN(nSeg, cur + segLen)
DRAWSEGMENT($oX[k] + cur, $oY[k] + $oD[k] * kStop * $oS[k] * SQRT(cur), $oX[k] + nxt, $oY[k] + $oD[k] * kStop * $oS[k] * SQRT(nxt)) COLOURED(cr, cg, cb, 170) STYLE(dottedline, 1)
cur = nxt
WEND
DRAWPOINT($oX[k], $oY[k], 3) COLOURED(cr, cg, cb, 255)
NEXT
ENDIF
// x: end of trend
IF nF > 0 THEN
FOR k = MAX(0, nF - maxOrigins) TO nF - 1 DO
DRAWTEXT("x", $fX[k], $fY[k]) COLOURED(130, 140, 150)
NEXT
ENDIF
// the two curves of the next bars, already known
IF regime <> 0 THEN
ageP = barindex - orgBar
FOR i = 0 TO projection - 1 DO
DRAWSEGMENT(barindex + i, orgPrice + regime * kStop * orgSig * SQRT(ageP + i), barindex + i + 1, orgPrice + regime * kStop * orgSig * SQRT(ageP + i + 1)) COLOURED(rT, gT, bT, 255) STYLE(dottedline, 2)
DRAWSEGMENT(barindex + i, orgPrice + regime * threshold * orgSig * SQRT(ageP + i), barindex + i + 1, orgPrice + regime * threshold * orgSig * SQRT(ageP + i + 1)) COLOURED(rT, gT, bT, 170) STYLE(dottedline, 1)
NEXT
xT = barindex + 2
yP = orgPrice + regime * kStop * orgSig * SQRT(ageP + 2) - regime * 0.9 * sigma
yF = orgPrice + regime * threshold * orgSig * SQRT(ageP + 2) + regime * 0.9 * sigma
IF regime = 1 THEN
DRAWTEXT("floor", xT, yP) COLOURED(rT, gT, bT)
ELSE
DRAWTEXT("ceiling", xT, yP) COLOURED(rT, gT, bT)
ENDIF
DRAWTEXT("edge", xT, yF) COLOURED(rT, gT, bT)
ENDIF
ENDIF

RETURN stopLine COLOURED(rT, gT, bT, aStop) STYLE(line, 3) AS "Floor or ceiling", edgeLine COLOURED(rT, gT, bT, aEdge) STYLE(line, 1) AS "Random walk edge", tUp COLOURED(0, 153, 153, aTU) STYLE(point, 2) AS "Bullish trigger", tDn COLOURED(226, 106, 44, aTD) STYLE(point, 2) AS "Bearish trigger"