





Slope Cone
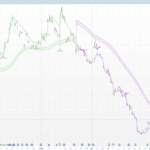
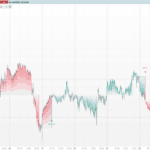
Classic trailing stops put the ratchet on price: a level that can only move in the direction of the trend. This indicator puts the ratchet on the slope. From an anchor close, it keeps every straight line that stays within a tolerance (in ATR) of each following close. Each new bar can only remove lines, so the set of possible slopes, the cone, can only narrow.
As long as the horizontal line is still among the possible ones, no trend is established. When every remaining line rises, or every remaining line falls, the trend is established. When no line fits anymore, the cone is frozen and a new anchor is set on the last compatible close. Exits are no longer horizontal levels but sloped lines, known several bars in advance, and an exit through the top of an up cone reads as an acceleration rather than a reversal.
How to read it
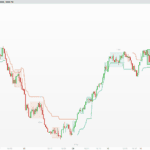
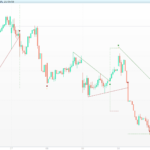
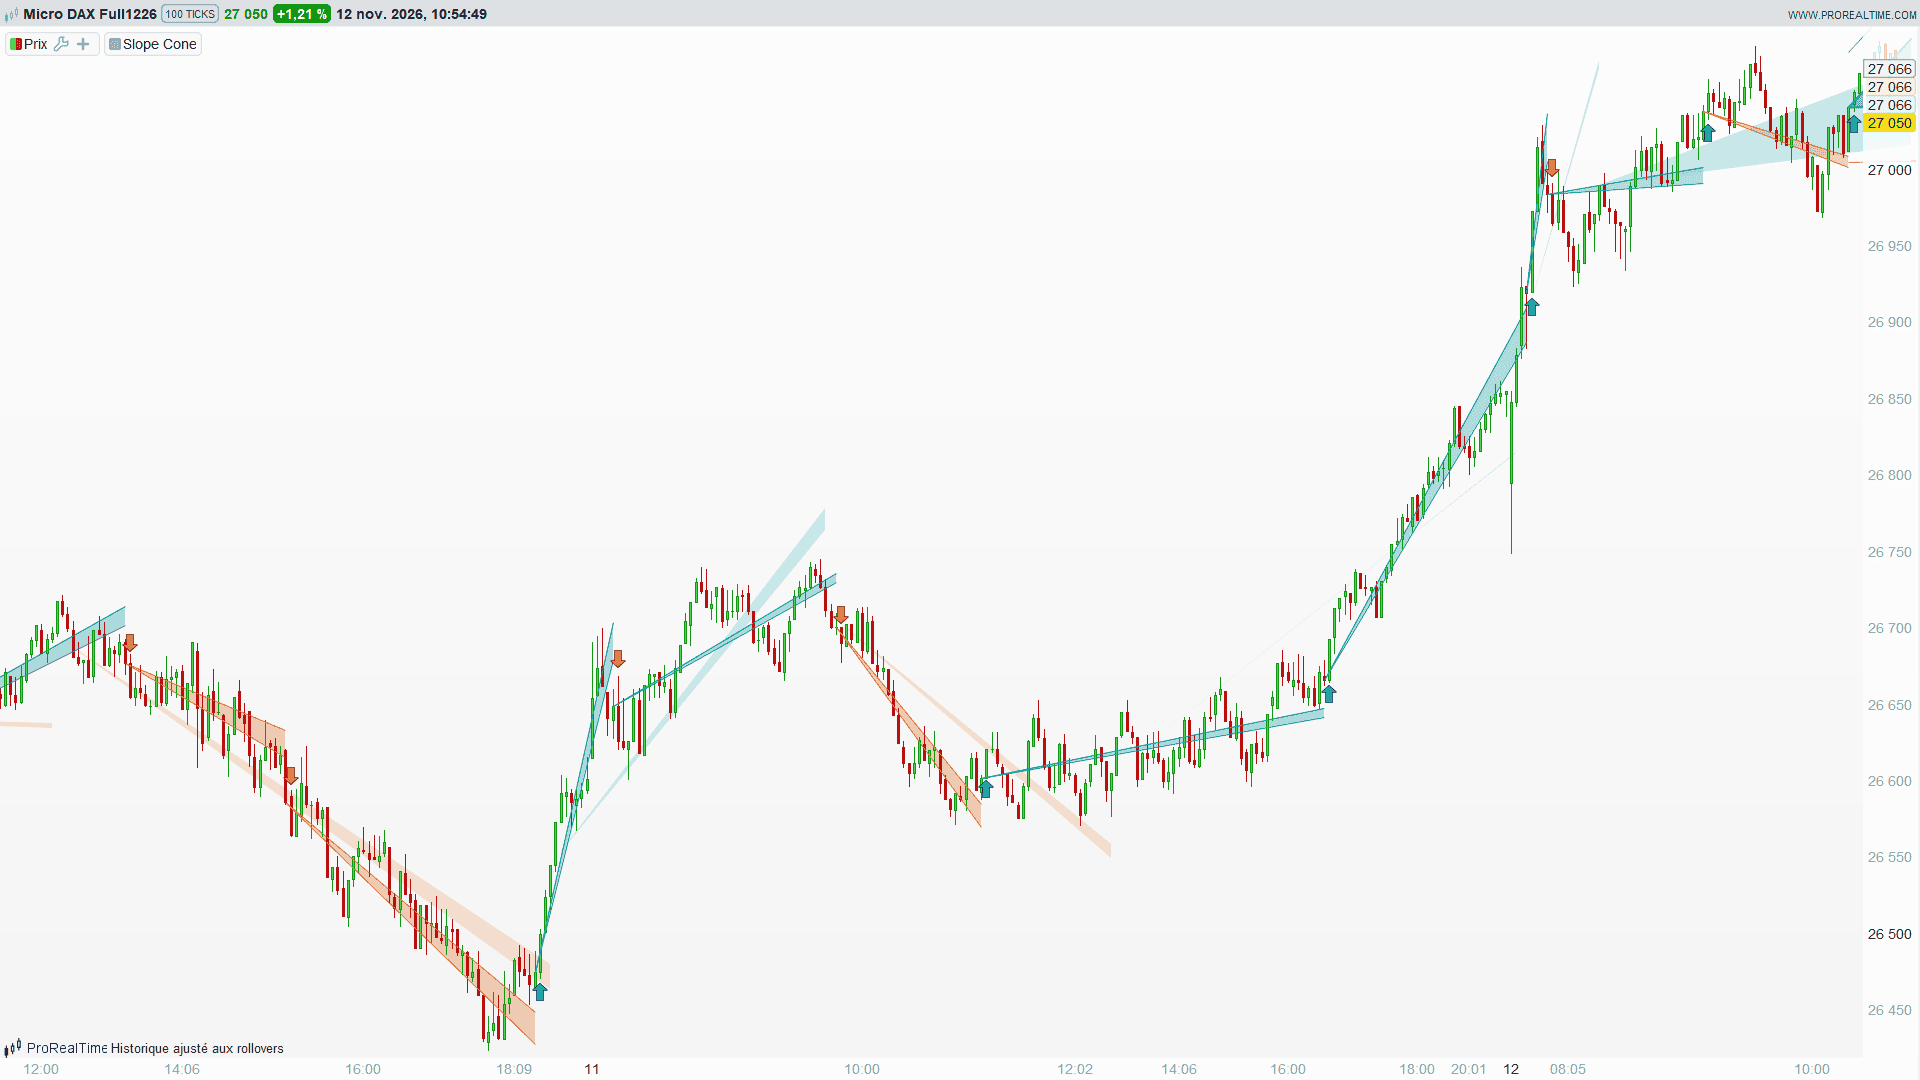
- Filled cone (teal or orange): established slope, every remaining line rises or falls.
- Grey dotted cone: undecided, the horizontal line is still possible.
- Wide pale cone: the same calculation with a wider tolerance, for the underlying trend.
- Dotted lines on the right: the exit levels of the next bars, drawn in advance. They can only get closer to each other.
- Arrows: price left the cone through the top or through the bottom.
Settings
- tolerance (1.8): half-width of the tube around the lines, in ATR.
- slowRatio (1.7): the slow cone uses tolerance x slowRatio.
- projection (12): number of bars projected to the right.
- slowCone (1): set to 0 to hide the wide pale cone.
- rails (0): set to 1 to also plot the exit levels of every past bar.
Limits
The indicator splits moves into legs rather than long phases; in choppy markets the cones are short. The tolerance is still an ATR setting. The idea comes from the “swinging door” compression algorithm used for industrial data; I have not seen it used as a trend indicator before. This is a visual tool and has not been tested as a trading system.
The code uses arrays and draws its objects on the last bar only. It contains no loop over past bars.
//----------------------------------------------------------------
// PRC_Slope Cone | indicator
// Author: Nicolas
// Date: 12.11.2026
// https://www.prorealcode.com
// License: CC BY-NC 4.0 - free to use, share and modify for
// non-commercial purposes, provided the author and the source
// above are credited.
// https://creativecommons.org/licenses/by-nc/4.0/
//----------------------------------------------------------------
// SLOPE CONE - the cone of possible slopes
// From an anchor close, keep every straight line that stays within a tolerance
// (in ATR) of each following close. The cone can only narrow.
// When no line fits anymore, the cone is frozen and a new anchor is set
// on the last compatible close.
DEFPARAM DrawOnLastBarOnly = true

// ---------- Settings
tolerance = 1.8 // half-width of the tube around the lines, in ATR
slowRatio = 1.7 // the slow cone (underlying trend) uses tolerance x slowRatio
atrPeriod = 20
projection = 12 // number of bars projected to the right
slowCone = 1 // 1 = draw the wide pale cone (underlying trend)
rails = 0 // 1 = also plot the exit levels of every past bar
maxCones = 150 // number of past cones redrawn

atr = AverageTrueRange[atrPeriod](close)
tau = tolerance * atr
tauS = tau * slowRatio

ONCE ready = 0
ONCE nR = 0
ONCE nS = 0

upLevel = close
dnLevel = close

IF ready = 0 THEN
IF barindex > atrPeriod + 1 AND atr > 0 THEN
// seed: anchor on the previous close
anchorBar = barindex - 1
anchorPrice = close[1]
sMax = close + tau - anchorPrice
sMin = close - tau - anchorPrice
anchorBarS = anchorBar
anchorPriceS = anchorPrice
sMaxS = close + tauS - anchorPriceS
sMinS = close - tauS - anchorPriceS
ready = 1
ENDIF
ELSE
// ---------- fast cone
dist = barindex - anchorBar
// levels this close had to cross to leave the cone
dnLevel = anchorPrice + sMin * dist - tau
upLevel = anchorPrice + sMax * dist + tau
slopeUp = (close + tau - anchorPrice) / dist
slopeDn = (close - tau - anchorPrice) / dist
newMax = MIN(sMax, slopeUp)
newMin = MAX(sMin, slopeDn)
IF newMin <= newMax THEN
sMax = newMax
sMin = newMin
ELSE
// no line fits anymore: the cone is frozen
exitSide = -1
exitY = high + 0.35 * atr
IF slopeDn > sMax THEN
exitSide = 1
exitY = low - 0.35 * atr
ENDIF
frozenState = 0
IF sMin > 0 THEN
frozenState = 1
ELSIF sMax < 0 THEN
frozenState = -1
ENDIF
$cA[nR] = anchorBar
$cP[nR] = anchorPrice
$cF[nR] = barindex - 1
$cMin[nR] = sMin
$cMax[nR] = sMax
$cE[nR] = frozenState
$cS[nR] = exitSide
$cY[nR] = exitY
nR = nR + 1
anchorBar = barindex - 1
anchorPrice = close[1]
sMax = close + tau - anchorPrice
sMin = close - tau - anchorPrice
ENDIF
// state of the current cone: 1 established rise, -1 established fall, 0 undecided
coneState = 0
IF sMin > 0 THEN
coneState = 1
ELSIF sMax < 0 THEN
coneState = -1
ENDIF
// ---------- slow cone: same calculation, wider tolerance
distS = barindex - anchorBarS
slopeUpS = (close + tauS - anchorPriceS) / distS
slopeDnS = (close - tauS - anchorPriceS) / distS
newMaxS = MIN(sMaxS, slopeUpS)
newMinS = MAX(sMinS, slopeDnS)
IF newMinS <= newMaxS THEN
sMaxS = newMaxS
sMinS = newMinS
ELSE
frozenStateS = 0
IF sMinS > 0 THEN
frozenStateS = 1
ELSIF sMaxS < 0 THEN
frozenStateS = -1
ENDIF
$sA[nS] = anchorBarS
$sP[nS] = anchorPriceS
$sF[nS] = barindex - 1
$sMn[nS] = sMinS
$sMx[nS] = sMaxS
$sE[nS] = frozenStateS
nS = nS + 1
anchorBarS = barindex - 1
anchorPriceS = close[1]
sMaxS = close + tauS - anchorPriceS
sMinS = close - tauS - anchorPriceS
ENDIF
coneStateS = 0
IF sMinS > 0 THEN
coneStateS = 1
ELSIF sMaxS < 0 THEN
coneStateS = -1
ENDIF
distS = barindex - anchorBarS
ENDIF

// ---------- exit levels of past bars, shown only when rails = 1
railUp = close
railDn = close
aRail = 0
IF rails = 1 THEN
railUp = upLevel
railDn = dnLevel
aRail = 170
ENDIF

// ---------- drawings, rebuilt on the last bar
IF IsLastBarUpdate AND ready = 1 THEN
IF slowCone = 1 THEN
IF nS > 0 THEN
FOR k = MAX(0, nS - maxCones) TO nS - 1 DO
dk = $sF[k] - $sA[k]
IF dk >= 1 THEN
cr = 130
cg = 140
cb = 150
IF $sE[k] = 1 THEN
cr = 0
cg = 153
cb = 153
ELSIF $sE[k] = -1 THEN
cr = 226
cg = 106
cb = 44
ENDIF
DRAWTRIANGLE($sA[k], $sP[k], $sF[k], $sP[k] + $sMx[k] * dk, $sF[k], $sP[k] + $sMn[k] * dk) COLOURED(cr, cg, cb, 48) BORDERCOLOR(cr, cg, cb, 0)
ENDIF
NEXT
ENDIF
cr = 130
cg = 140
cb = 150
IF coneStateS = 1 THEN
cr = 0
cg = 153
cb = 153
ELSIF coneStateS = -1 THEN
cr = 226
cg = 106
cb = 44
ENDIF
DRAWTRIANGLE(anchorBarS, anchorPriceS, barindex, anchorPriceS + sMaxS * distS, barindex, anchorPriceS + sMinS * distS) COLOURED(cr, cg, cb, 55) BORDERCOLOR(cr, cg, cb, 0)
ENDIF
// frozen fast cones
IF nR > 0 THEN
FOR k = MAX(0, nR - maxCones) TO nR - 1 DO
dk = $cF[k] - $cA[k]
cr = 130
cg = 140
cb = 150
IF $cE[k] = 1 THEN
cr = 0
cg = 153
cb = 153
ELSIF $cE[k] = -1 THEN
cr = 226
cg = 106
cb = 44
ENDIF
IF dk >= 1 THEN
yk1 = $cP[k] + $cMax[k] * dk
yk2 = $cP[k] + $cMin[k] * dk
IF $cE[k] = 0 THEN
DRAWTRIANGLE($cA[k], $cP[k], $cF[k], yk1, $cF[k], yk2) COLOURED(cr, cg, cb, 25) BORDERCOLOR(cr, cg, cb, 0)
DRAWSEGMENT($cA[k], $cP[k], $cF[k], yk1) COLOURED(cr, cg, cb, 220) STYLE(dottedline, 1)
DRAWSEGMENT($cA[k], $cP[k], $cF[k], yk2) COLOURED(cr, cg, cb, 220) STYLE(dottedline, 1)
ELSE
DRAWTRIANGLE($cA[k], $cP[k], $cF[k], yk1, $cF[k], yk2) COLOURED(cr, cg, cb, 75) BORDERCOLOR(cr, cg, cb, 0)
DRAWSEGMENT($cA[k], $cP[k], $cF[k], yk1) COLOURED(cr, cg, cb, 255) STYLE(line, 1)
DRAWSEGMENT($cA[k], $cP[k], $cF[k], yk2) COLOURED(cr, cg, cb, 255) STYLE(line, 1)
ENDIF
ENDIF
// arrow: price left the cone through the top or the bottom
IF $cS[k] = 1 THEN
DRAWARROWUP($cF[k] + 1, $cY[k]) COLOURED(0, 153, 153)
ELSE
DRAWARROWDOWN($cF[k] + 1, $cY[k]) COLOURED(226, 106, 44)
ENDIF
NEXT
ENDIF
// current cone and its projection
dist = barindex - anchorBar
xP = barindex + projection
xT = barindex + 2
yH = anchorPrice + sMax * dist
yB = anchorPrice + sMin * dist
yHP = anchorPrice + sMax * (dist + projection)
yBP = anchorPrice + sMin * (dist + projection)
cr = 130
cg = 140
cb = 150
IF coneState = 1 THEN
cr = 0
cg = 153
cb = 153
ELSIF coneState = -1 THEN
cr = 226
cg = 106
cb = 44
ENDIF
DRAWTRIANGLE(anchorBar, anchorPrice, xP, yHP, xP, yBP) COLOURED(cr, cg, cb, 22) BORDERCOLOR(cr, cg, cb, 0)
DRAWTRIANGLE(anchorBar, anchorPrice, barindex, yH, barindex, yB) COLOURED(cr, cg, cb, 105) BORDERCOLOR(cr, cg, cb, 0)
IF coneState = 0 THEN
DRAWSEGMENT(anchorBar, anchorPrice, barindex, yH) COLOURED(cr, cg, cb, 255) STYLE(dottedline, 2)
DRAWSEGMENT(anchorBar, anchorPrice, barindex, yB) COLOURED(cr, cg, cb, 255) STYLE(dottedline, 2)
ELSE
DRAWSEGMENT(anchorBar, anchorPrice, barindex, yH) COLOURED(cr, cg, cb, 255) STYLE(line, 2)
DRAWSEGMENT(anchorBar, anchorPrice, barindex, yB) COLOURED(cr, cg, cb, 255) STYLE(line, 2)
ENDIF
// tube of the current cone, then exit levels of the next bars
DRAWSEGMENT(anchorBar, anchorPrice + tau, barindex, yH + tau) COLOURED(0, 153, 153, 190) STYLE(line, 1)
DRAWSEGMENT(anchorBar, anchorPrice - tau, barindex, yB - tau) COLOURED(226, 106, 44, 190) STYLE(line, 1)
DRAWSEGMENT(barindex, yH + tau, xP, yHP + tau) COLOURED(0, 153, 153, 255) STYLE(dottedline, 2)
DRAWSEGMENT(barindex, yB - tau, xP, yBP - tau) COLOURED(226, 106, 44, 255) STYLE(dottedline, 2)
yTH = anchorPrice + sMax * (dist + 2) + tau + 0.6 * atr
yTB = anchorPrice + sMin * (dist + 2) - tau - 0.6 * atr
IF coneState = 1 THEN
DRAWTEXT("acceleration", xT, yTH) COLOURED(0, 153, 153)
DRAWTEXT("break", xT, yTB) COLOURED(226, 106, 44)
ELSIF coneState = -1 THEN
DRAWTEXT("break", xT, yTH) COLOURED(0, 153, 153)
DRAWTEXT("acceleration", xT, yTB) COLOURED(226, 106, 44)
ELSE
DRAWTEXT("upper exit", xT, yTH) COLOURED(0, 153, 153)
DRAWTEXT("lower exit", xT, yTB) COLOURED(226, 106, 44)
ENDIF
ENDIF

RETURN railUp COLOURED(0, 153, 153, aRail) STYLE(point, 1) AS "Upper exit", railDn COLOURED(226, 106, 44, aRail) STYLE(point, 1) AS "Lower exit"