






Augmented Dickey-Fuller (ADF) Test: Is the Market Mean Reverting Right Now?
Introduction
Mean reversion strategies (Bollinger fades, RSI extremes, pairs, range trading) all rest on one assumption: that prices tend to come back to an average. Trend-following rests on the opposite one. The Augmented Dickey-Fuller test is the classic statistical tool to check which of the two the data supports.
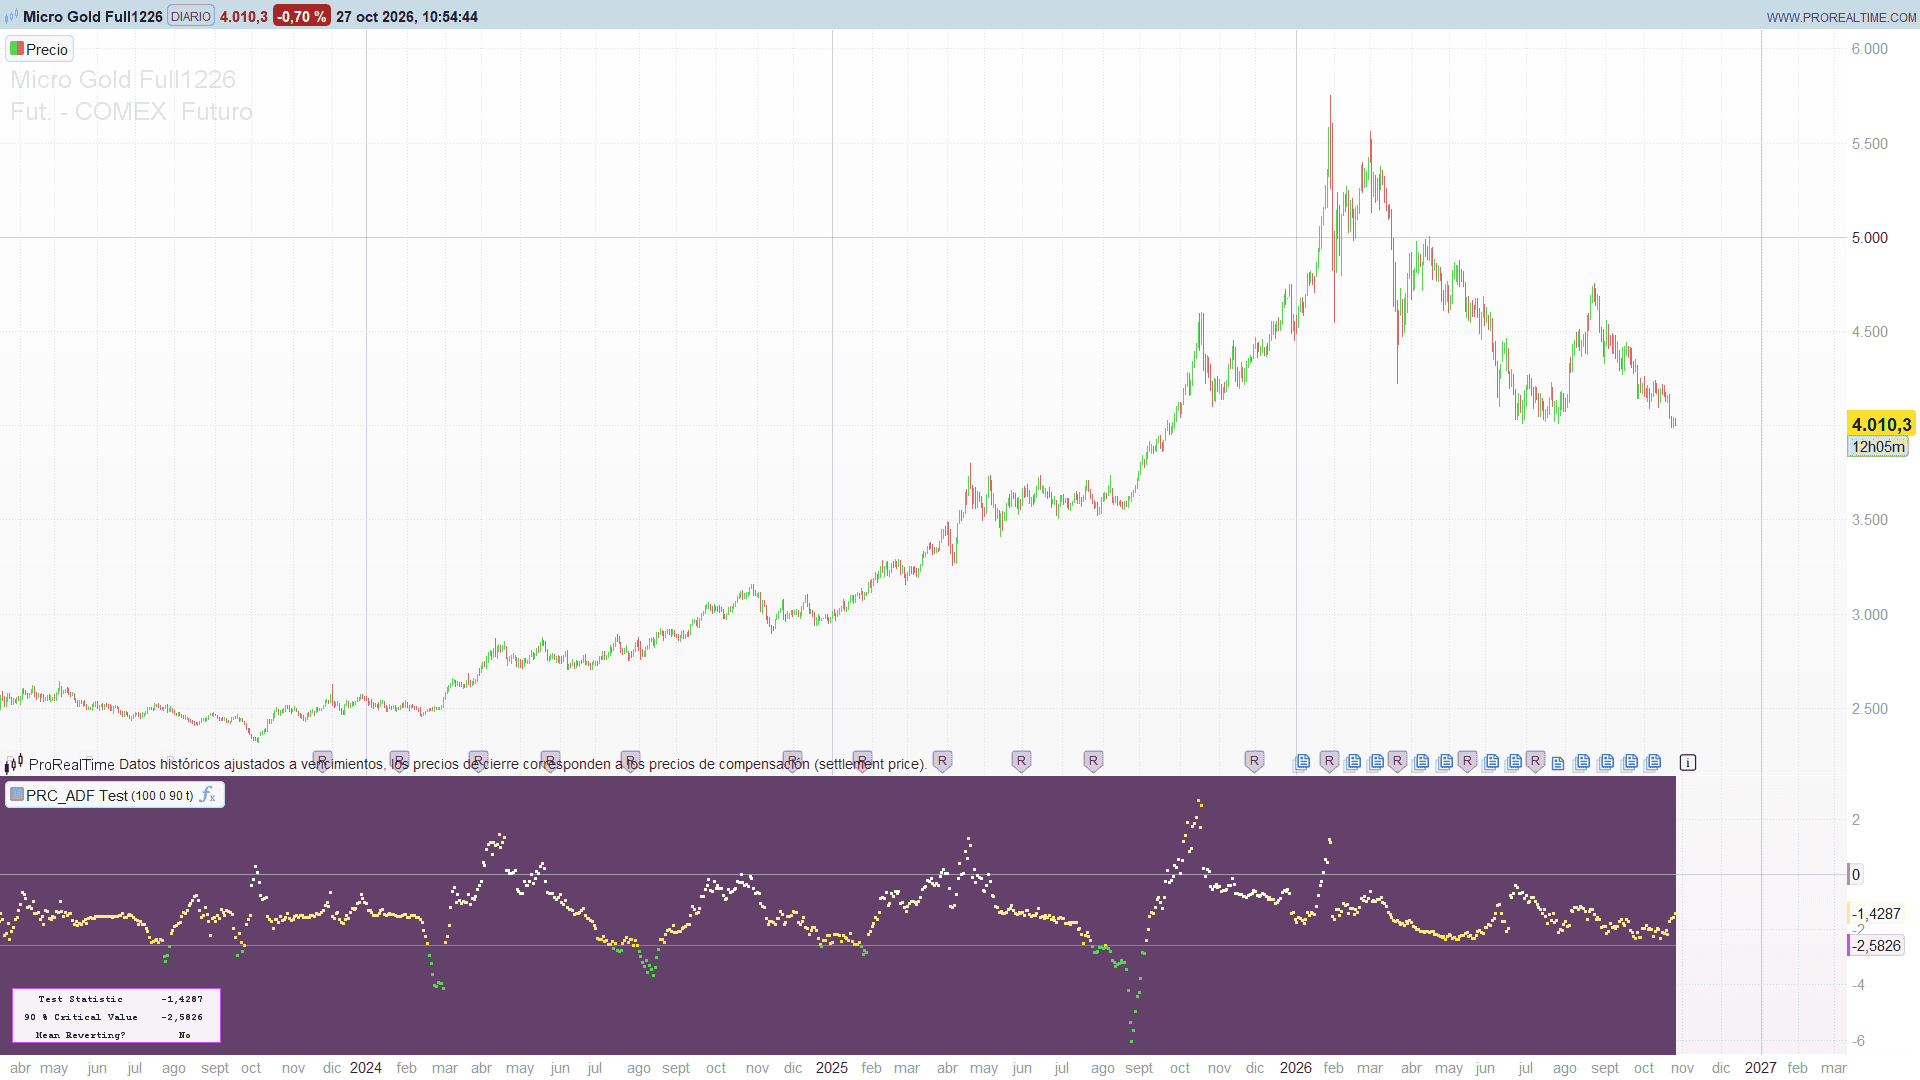
This indicator by RicardoSantos runs the ADF test on a moving window and plots the test statistic against its critical value in a separate panel. When the statistic drops below the critical value, the recent sample behaves like a stationary, mean-reverting series. When it stays above, the series looks like a random walk or a trend, and fading moves is a weaker bet.
Theory Behind the Indicator
A series with a unit root has no anchor: each shock stays in the price, and the series wanders. A stationary series keeps pulling back toward its mean. The Dickey-Fuller regression measures that pull:
- The dependent variable is the change of the series, y(t) – y(t-1).
- The regressors are the previous value y(t-1), a constant and, in the augmented version, a number of lagged changes that absorb serial correlation.
- If the coefficient of y(t-1) is clearly negative, every deviation is partly corrected on the next bar: the series reverts.
The test statistic is that coefficient divided by its standard error. It does not follow a normal distribution, so it is compared with the critical values published by MacKinnon (2010) for a model with a constant and no trend, adjusted for the number of observations. Below the critical value, the unit root hypothesis is rejected at the chosen confidence level.
On every bar the indicator takes the last Length values, builds the regression, solves it by least squares and computes the statistic and the critical value.
Key Features at a Glance
- Rolling ADF test on any price or indicator series (the “Apply to” setting).
- Optional lagged differences (augmented test) to handle autocorrelated data.
- Critical value at 90%, 95% or 99% confidence.
- Colour-coded statistic: green when the sample is mean reverting, white turning to yellow as it gets closer to the critical line.
- Info box with the current statistic, the critical value and a plain Yes / No answer.
How to Read the Indicator
- Purple line: the critical value. It barely moves, since it only depends on the confidence level and the sample size.
- Crosses under the purple line (green): the last Length bars are statistically mean reverting. Oscillator extremes and band touches are more likely to snap back.
- Crosses above the line: no evidence of mean reversion. The more yellow they get, the closer the statistic is to the threshold; white crosses near zero describe a random walk or a trend.
- Grey zero line: reference. Positive values are typical of strong, persistent trends.
- Info box: the numbers behind the last cross and the answer to “Mean Reverting?”.
A single green cross is weak evidence: the test is run on every bar, so some crossings happen by chance. Persistent stretches under the critical value are more meaningful than isolated ones.
Practical Applications
- Regime filter: allow mean reversion entries only while the statistic is under the critical value, and trend entries when it is clearly above.
- Choosing the right tool: run it on a stock, a spread or a ratio before applying a band or oscillator strategy.
- Testing indicators: apply it to an oscillator or to the difference between two averages to check whether that series actually oscillates around a mean.
Indicator Configuration
- lookback (default 100, minimum 2): number of bars in the moving sample.
- nLag (default 0): number of lagged differences added to the regression. It must stay below half the length minus two; if not, the box shows “Lag too large” and nothing is plotted.
- confLevel (default 90): confidence level of the critical value, 90, 95 or 99.
- showInfo (default 1): info box on (1) or off (0).
- The series to test is the indicator’s “Apply to” setting (close by default).
The Code
//---------------------------------------------------------------
// PRC_ADF Test
// version = 0
// 27.10.2026
// Iván González @ www.prorealcode.com
// Author: RicardoSantos
// Sharing ProRealTime knowledge
//--------------------------------------------------------------------//
DEFPARAM DRAWONLASTBARONLY = true

// ===================== INPUTS =====================
// Source: the indicator's "Apply to" setting (close by default)
lookback = 100      // Length: number of points in the moving sample (min 2)
nLag = 0            // Maximum lag: lagged differences added to the regression (min 0)
confLevel = 90      // Confidence level of the critical value: 90, 95 or 99
showInfo = 1        // 1 = show the info box, 0 = hide it

src = customclose

// ===================== SETTINGS CHECK =====================
lkb = max(2, round(lookback))
nLg = max(0, round(nLag))
lagOk = 1
IF nLg >= lkb / 2 - 2 THEN
   lagOk = 0
ENDIF
nObs = lkb - nLg - 1
nCol = 2 + nLg
nReg = 1 + nLg

once tauADF = undefined
once crit = undefined
adfOk = 0

// ===================== ADF REGRESSION =====================
// dy(i) = b0 * y(i+1) + sum(bn * dy(i+n)) + c, solved by least squares.
// The intercept is removed by centring every column, so only the slopes
// go through the normal equations.
IF lagOk = 1 AND barindex >= lkb - 1 THEN
   FOR i = 0 TO lkb - 1 DO
      $dat[i] = src[i]
   NEXT
   // means of the dependent variable and of each regressor
   meanY = 0
   FOR c = 0 TO nReg - 1 DO
      $mX[c] = 0
   NEXT
   FOR i = 0 TO nObs - 1 DO
      meanY = meanY + $dat[i] - $dat[i + 1]
      $mX[0] = $mX[0] + $dat[i + 1]
      IF nLg > 0 THEN
         FOR c = 1 TO nLg DO
            $mX[c] = $mX[c] + $dat[i + c] - $dat[i + c + 1]
         NEXT
      ENDIF
   NEXT
   meanY = meanY / nObs
   FOR c = 0 TO nReg - 1 DO
      $mX[c] = $mX[c] / nObs
   NEXT
   // normal equations on centred columns: A * b = v (augmented matrix in $aug)
   nAug = nReg + 1
   FOR c = 0 TO nReg * nAug - 1 DO
      $aug[c] = 0
   NEXT
   FOR i = 0 TO nObs - 1 DO
      $rw[0] = $dat[i + 1] - $mX[0]
      IF nLg > 0 THEN
         FOR c = 1 TO nLg DO
            $rw[c] = $dat[i + c] - $dat[i + c + 1] - $mX[c]
         NEXT
      ENDIF
      yC = $dat[i] - $dat[i + 1] - meanY
      FOR r = 0 TO nReg - 1 DO
         rv = $rw[r]
         FOR c = 0 TO nReg - 1 DO
            $aug[r * nAug + c] = $aug[r * nAug + c] + rv * $rw[c]
         NEXT
         $aug[r * nAug + nReg] = $aug[r * nAug + nReg] + rv * yC
      NEXT
   NEXT
   // Gauss-Jordan elimination with partial pivoting
   solveOk = 1
   FOR p = 0 TO nReg - 1 DO
      best = p
      bestV = abs($aug[p * nAug + p])
      IF p < nReg - 1 THEN
         FOR r = p + 1 TO nReg - 1 DO
            IF abs($aug[r * nAug + p]) > bestV THEN
               best = r
               bestV = abs($aug[r * nAug + p])
            ENDIF
         NEXT
      ENDIF
      IF bestV <= 0.0000000001 THEN
         solveOk = 0
         BREAK
      ENDIF
      IF best <> p THEN
         FOR c = 0 TO nReg DO
            tmpV = $aug[p * nAug + c]
            $aug[p * nAug + c] = $aug[best * nAug + c]
            $aug[best * nAug + c] = tmpV
         NEXT
      ENDIF
      pv = $aug[p * nAug + p]
      FOR c = 0 TO nReg DO
         $aug[p * nAug + c] = $aug[p * nAug + c] / pv
      NEXT
      FOR r = 0 TO nReg - 1 DO
         IF r <> p THEN
            fct = $aug[r * nAug + p]
            IF fct <> 0 THEN
               FOR c = 0 TO nReg DO
                  $aug[r * nAug + c] = $aug[r * nAug + c] - fct * $aug[p * nAug + c]
               NEXT
            ENDIF
         ENDIF
      NEXT
   NEXT
   IF solveOk = 1 THEN
      // slopes and intercept
      icpt = meanY
      FOR c = 0 TO nReg - 1 DO
         $cf[c] = $aug[c * nAug + nReg]
         icpt = icpt - $cf[c] * $mX[c]
      NEXT
      // mean square error of the regression and spread of the predictor
      sum1 = 0
      sum2 = 0
      FOR i = 0 TO nObs - 1 DO
         yHat = icpt + $cf[0] * $dat[i + 1]
         IF nLg > 0 THEN
            FOR c = 1 TO nLg DO
               yHat = yHat + $cf[c] * ($dat[i + c] - $dat[i + c + 1])
            NEXT
         ENDIF
         resd = $dat[i] - $dat[i + 1] - yHat
         sum1 = sum1 + resd * resd
         dxV = $dat[i + 1] - $mX[0]
         sum2 = sum2 + dxV * dxV
      NEXT
      sum1 = sum1 / (nObs - nCol)
      IF sum2 > 0 AND sum1 >= 0 THEN
         stdErr = sqrt(sum1 / sum2)
         IF stdErr > 0 THEN
            tauADF = $cf[0] / stdErr
            adfOk = 1
         ENDIF
      ENDIF
   ENDIF
   // MacKinnon (2010) critical value, model with constant and no trend
   nSq = nObs * nObs
   nCu = nObs * nObs * nObs
   IF confLevel = 99 THEN
      crit = -3.43035 - 6.5393 / nObs - 16.786 / nSq - 79.433 / nCu
   ELSIF confLevel = 95 THEN
      crit = -2.86154 - 2.8903 / nObs - 4.234 / nSq - 40.040 / nCu
   ELSE
      crit = -2.56677 - 1.5384 / nObs - 2.809 / nSq
   ENDIF
ENDIF

// ===================== COLOURS =====================
// below the critical value (mean reverting): green
// above: white to yellow as |statistic| approaches |critical value|
tauR = 255
tauG = 255
tauB = 255
tauA = 0
IF adfOk = 1 THEN
   IF tauADF < crit THEN
      tauR = 122
      tauG = 245
      tauB = 77
      tauA = 255
   ELSIF tauADF > crit THEN
      gT = min(1, max(0, abs(tauADF) / abs(crit)))
      tauR = 255 - 10 * gT
      tauG = 255 - 32 * gT
      tauB = 255 - 178 * gT
      tauA = 255
   ENDIF
ENDIF

BACKGROUNDCOLOR(100, 65, 107)

// ===================== INFO BOX =====================
IF islastbarupdate AND showInfo = 1 THEN
   rowH = 18
   chW = 6.2
   nameW = 20 * chW + 14
   valW = 9 * chW + 14
   tW = nameW + valW
   tH = 3 * rowH
   tL = 12
   tT = 12 + tH
   cxN = tL + nameW / 2
   cxV = tL + nameW + valW / 2
   IF adfOk = 1 AND tauADF < crit THEN
      frR = 122
      frG = 245
      frB = 77
   ELSE
      frR = 200
      frG = 77
      frB = 245
   ENDIF
   DRAWRECTANGLE(tL, tT, tL + tW, tT - tH) ANCHOR(BOTTOMLEFT, XSHIFT, YSHIFT) COLOURED(frR, frG, frB, 255) FILLCOLOR(250, 237, 245, 255)
   y0 = tT - rowH * 0.5
   y1 = tT - rowH * 1.5
   y2 = tT - rowH * 2.5
   DRAWTEXT("Test Statistic", cxN, y0, monospaced, bold, 10) ANCHOR(BOTTOMLEFT, XSHIFT, YSHIFT) COLOURED(0, 0, 0, 255)
   DRAWTEXT("#confLevel#% Critical Value", cxN, y1, monospaced, bold, 10) ANCHOR(BOTTOMLEFT, XSHIFT, YSHIFT) COLOURED(0, 0, 0, 255)
   DRAWTEXT("Mean Reverting?", cxN, y2, monospaced, bold, 10) ANCHOR(BOTTOMLEFT, XSHIFT, YSHIFT) COLOURED(0, 0, 0, 255)
   IF lagOk = 0 THEN
      DRAWTEXT("Lag too large", cxV, y0, monospaced, bold, 10) ANCHOR(BOTTOMLEFT, XSHIFT, YSHIFT) COLOURED(200, 0, 0, 255)
   ELSIF adfOk = 1 THEN
      tauTxt = round(tauADF * 10000) / 10000
      critTxt = round(crit * 10000) / 10000
      DRAWTEXT("#tauTxt#", cxV, y0, monospaced, bold, 10) ANCHOR(BOTTOMLEFT, XSHIFT, YSHIFT) COLOURED(0, 0, 0, 255)
      DRAWTEXT("#critTxt#", cxV, y1, monospaced, bold, 10) ANCHOR(BOTTOMLEFT, XSHIFT, YSHIFT) COLOURED(0, 0, 0, 255)
      IF tauADF < crit THEN
         DRAWTEXT("Yes", cxV, y2, monospaced, bold, 10) ANCHOR(BOTTOMLEFT, XSHIFT, YSHIFT) COLOURED(0, 0, 0, 255)
      ELSE
         DRAWTEXT("No", cxV, y2, monospaced, bold, 10) ANCHOR(BOTTOMLEFT, XSHIFT, YSHIFT) COLOURED(0, 0, 0, 255)
      ENDIF
   ELSE
      DRAWTEXT("NaN", cxV, y0, monospaced, bold, 10) ANCHOR(BOTTOMLEFT, XSHIFT, YSHIFT) COLOURED(0, 0, 0, 255)
      DRAWTEXT("NaN", cxV, y1, monospaced, bold, 10) ANCHOR(BOTTOMLEFT, XSHIFT, YSHIFT) COLOURED(0, 0, 0, 255)
      DRAWTEXT("No", cxV, y2, monospaced, bold, 10) ANCHOR(BOTTOMLEFT, XSHIFT, YSHIFT) COLOURED(0, 0, 0, 255)
   ENDIF
ENDIF

RETURN 0 COLOURED(147, 149, 151) AS "Zero", crit COLOURED(200, 77, 245) AS "Critical value", tauADF COLOURED(tauR, tauG, tauB, tauA) STYLE(point, 2) AS "Test statistic"