







Chi-Square Test, P-value and Significance
Introduction
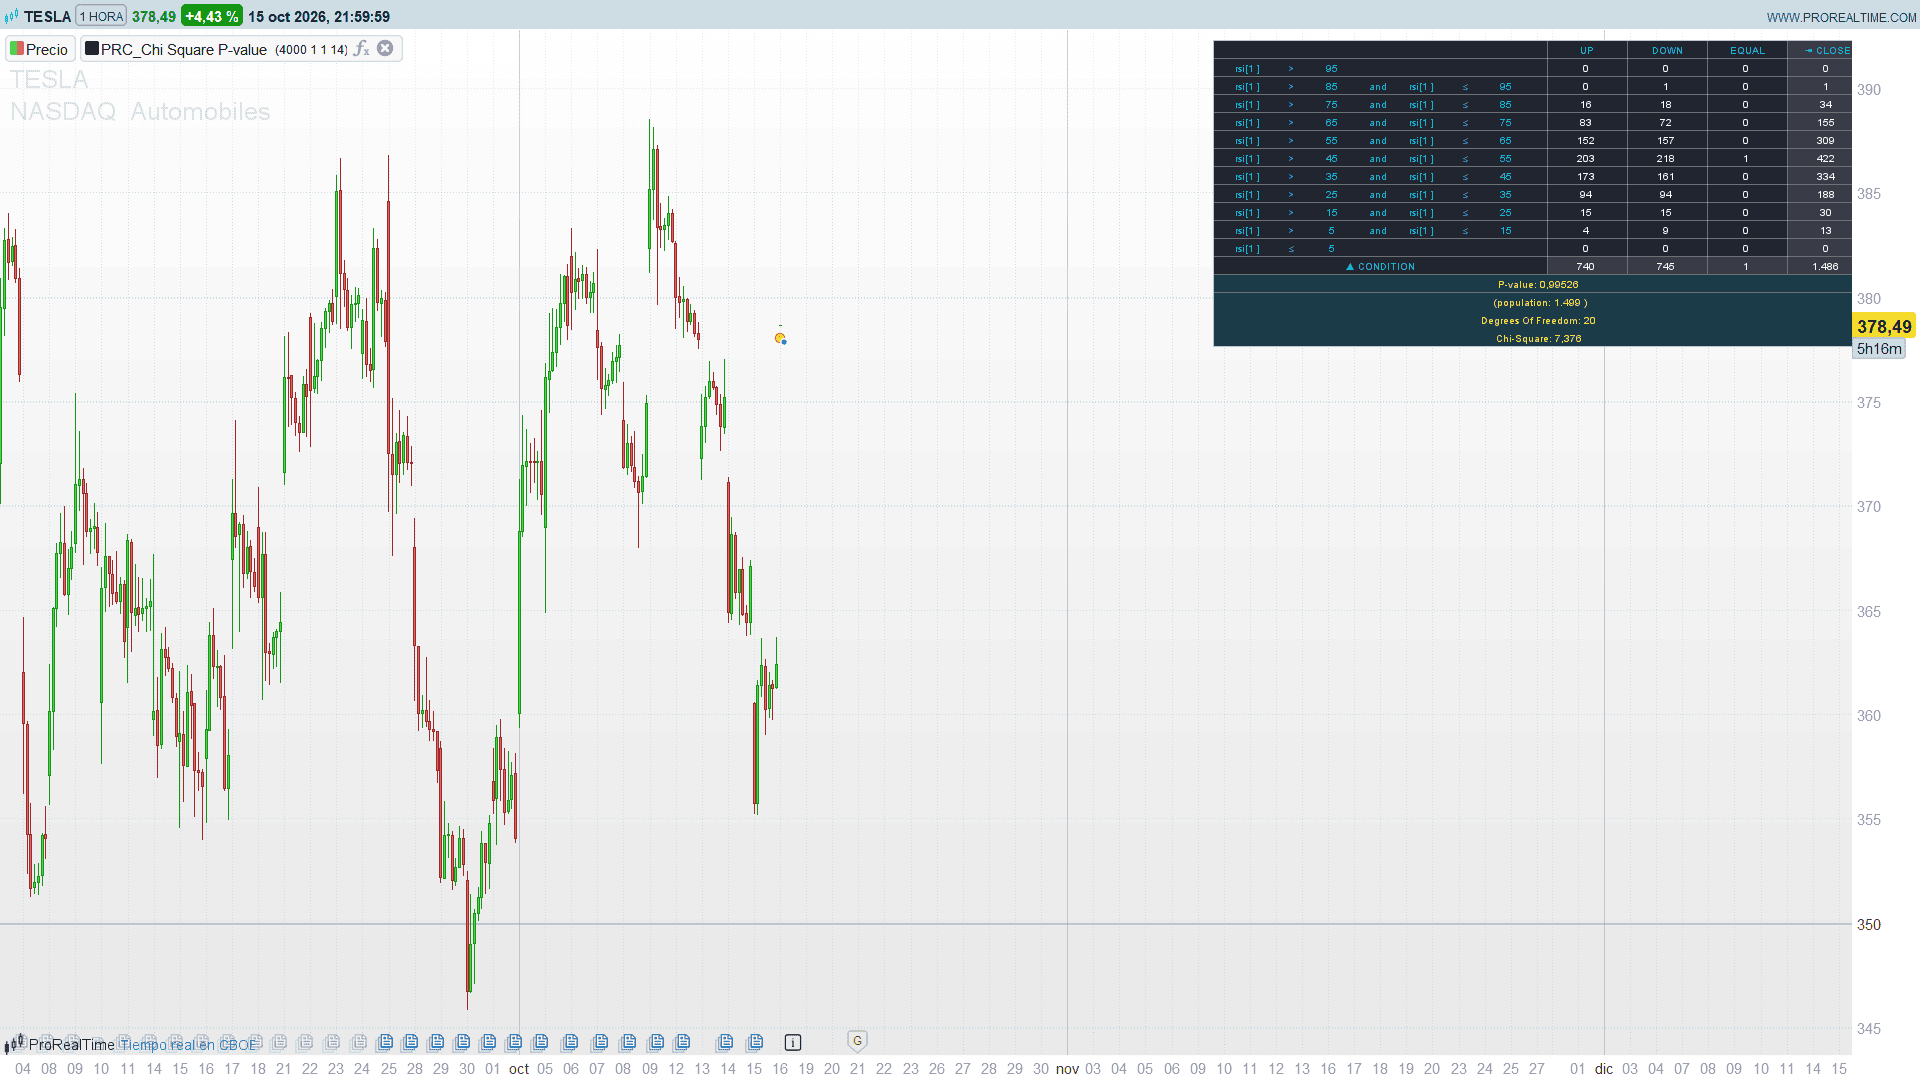
Does the close tend to rise after the RSI has been above 85? Or is that just an impression from a few memorable cases? This indicator answers that kind of question with a classic statistical tool, the Chi-Square test of independence. You define a set of conditions, the indicator counts what the close did after each of them over a large population of bars, and it tells you whether the differences between the conditions are statistically significant or could be explained by chance.
Theory Behind the Indicator
The test builds a contingency table. Each row is a condition and each column an outcome of the bar:
- UP: the close is above the previous close.
- DOWN: the close is below the previous close.
- EQUAL: both closes are the same.
The outcomes can also be grouped in two columns (UP against DOWN/EQUAL, or UP/EQUAL against DOWN).
For every bar of the population, each condition that is true adds one to the cell of the outcome of that bar. If conditions and outcomes were independent, every row would split between the columns in the same proportions as the whole table. The expected count of a cell is therefore:
expected = row total x column total / grand total
The Chi-Square statistic adds up how far the observed counts are from the expected ones:
Chi-Square = sum over all cells of (observed – expected)^2 / expected
The degrees of freedom are (rows – 1) x (columns – 1). The P-value is the probability of getting a Chi-Square at least this large if the conditions had no effect at all. It is calculated with the incomplete gamma function. Alternatively, the indicator can show it the classic way, as a range between two of the usual significance levels of the Chi-Square table (0.995, 0.99, 0.975, 0.95, 0.9, 0.5, 0.2, 0.1, 0.05, 0.025, 0.02, 0.01, 0.005, 0.002, 0.001).
A small P-value (for example below 0.05) means that the outcome of the bar is not independent of your conditions: at least one of them changes the odds.
Key Features at a Glance
- Up to 11 conditions, two always on and nine with an on/off switch.
- Each condition compares two sources, each with its own look-back, using less than, less or equal, equal, greater than or greater or equal.
- An optional second comparison joined with AND in every condition, to define ranges.
- Sources: open, high, low, close, RSI and 11 adjustable levels.
- Three outcome layouts: UP / DOWN / EQUAL, UP / DOWN-or-EQUAL, UP-or-EQUAL / DOWN.
- Contingency table with row totals, column totals and grand total.
- Chi-Square, degrees of freedom and P-value, by function or by the classic table.
- Adjustable population, marked on the chart with a vertical line.
How to Read the Indicator
With the default settings, the 11 conditions are 11 zones of the RSI (14) of the previous bar: above 95, between 85 and 95, between 75 and 85, and so on down to below 5. The table then shows, for each RSI zone, how many times the next close went up, down or stayed equal.
Compare the rows: if one zone has clearly more UP than the others, it may hold an edge. The P-value tells you whether those differences as a whole are significant. A P-value of 0.9 means the pattern you see is entirely compatible with chance; a P-value of 0.01 means such differences would appear by chance only 1% of the time.
Keep the counts in mind: zones with only a handful of cases (extreme RSI readings, for example) contribute little information, and the Chi-Square test is less reliable when many cells have small expected counts. The population line on the chart shows where the sample starts.
Practical Applications
- Validate an idea before building a system: check whether a condition really changes the distribution of the next bar’s outcome.
- Compare zones of an oscillator: the default setup tests whether the RSI zones have any influence on the following close.
- Price action conditions: compare closes, highs and lows with look-backs, such as a close above the previous high or a low below the low two bars back, against the next outcome.
- Avoid over-interpreting: a striking count in one row means little if the P-value is high.
Indicator Configuration
- back (default 4000): population, number of bars tested (10 to 4990).
- outcomeT (default 1): outcome layout. 1 UP / DOWN / EQUAL, 2 UP / DOWN-or-EQUAL, 3 UP-or-EQUAL / DOWN.
- pMethod (default 1): P-value method. 1 function, 2 classic table (range between two significance levels).
- rsiLen (default 14): RSI length.
- lv1 to lv11 (defaults 5, 15, 25, 35, 45, 55, 65, 75, 85, 95, 100): the 11 levels available as sources.
- Conditions A to K: each one has S1, B1, Op, S2, B2 for the first comparison, And to enable the second one, and S1b, B1b, Opb, S2b, B2b for the second comparison. C to K also have an On switch.
- Sources (S): 1 open, 2 high, 3 low, 4 close, 5 RSI, 6 to 16 level 1 to level 11.
- Look-backs (B): 0 to 10 bars back. Levels ignore it.
- Operators (Op): 1 less than, 2 less or equal, 3 equal, 4 greater than, 5 greater or equal.
The table needs about 320 pixels of panel height with the 11 conditions on, and at least back + 10 bars loaded on the chart for a full population.
The Code
//---------------------------------------------------------------
// PRC_Chi Square P-value
// version = 0
// 16.10.2026
// Iván González @ www.prorealcode.com
// Author: fikira
// Sharing ProRealTime knowledge
//--------------------------------------------------------------------//
// The table is redrawn on every update
DEFPARAM DRAWONLASTBARONLY = true
//--------------------------------------------------------------------//
// Settings
//--------------------------------------------------------------------//
back = 4000       // Population (bars), 10 to 4990
outcomeT = 1      // Outcome: 1 = UP - DOWN - EQUAL, 2 = UP - DOWN/EQUAL, 3 = UP/EQUAL - DOWN
pMethod = 1       // P-value method: 1 = function, 2 = table
rsiLen = 14       // RSI length
lv1 = 5
lv2 = 15
lv3 = 25
lv4 = 35
lv5 = 45
lv6 = 55
lv7 = 65
lv8 = 75
lv9 = 85
lv10 = 95
lv11 = 100
//--------------------------------------------------------------------//
// Conditions. Each one is: S1[B1] Op S2[B2], and optionally a second
// comparison joined with AND (And = 1).
// Sources: 1 open, 2 high, 3 low, 4 close, 5 rsi, 6 to 16 = level 1 to 11
// Operators: 1 less than, 2 less or equal, 3 equal, 4 greater than,
// 5 greater or equal. B = bars back (0 to 10).
// Conditions A and B are always on; C to K have an On switch.
//--------------------------------------------------------------------//
cAS1 = 5
cAB1 = 1
cAOp = 4
cAS2 = 15
cAB2 = 2
cAAnd = 0
cAS1b = 5
cAB1b = 1
cAOpb = 2
cAS2b = 16
cAB2b = 2
cBS1 = 5
cBB1 = 1
cBOp = 4
cBS2 = 14
cBB2 = 2
cBAnd = 1
cBS1b = 5
cBB1b = 1
cBOpb = 2
cBS2b = 15
cBB2b = 2
cCOn = 1
cCS1 = 5
cCB1 = 1
cCOp = 4
cCS2 = 13
cCB2 = 2
cCAnd = 1
cCS1b = 5
cCB1b = 1
cCOpb = 2
cCS2b = 14
cCB2b = 2
cDOn = 1
cDS1 = 5
cDB1 = 1
cDOp = 4
cDS2 = 12
cDB2 = 2
cDAnd = 1
cDS1b = 5
cDB1b = 1
cDOpb = 2
cDS2b = 13
cDB2b = 2
cEOn = 1
cES1 = 5
cEB1 = 1
cEOp = 4
cES2 = 11
cEB2 = 2
cEAnd = 1
cES1b = 5
cEB1b = 1
cEOpb = 2
cES2b = 12
cEB2b = 2
cFOn = 1
cFS1 = 5
cFB1 = 1
cFOp = 4
cFS2 = 10
cFB2 = 2
cFAnd = 1
cFS1b = 5
cFB1b = 1
cFOpb = 2
cFS2b = 11
cFB2b = 2
cGOn = 1
cGS1 = 5
cGB1 = 1
cGOp = 4
cGS2 = 9
cGB2 = 2
cGAnd = 1
cGS1b = 5
cGB1b = 1
cGOpb = 2
cGS2b = 10
cGB2b = 2
cHOn = 1
cHS1 = 5
cHB1 = 1
cHOp = 4
cHS2 = 8
cHB2 = 2
cHAnd = 1
cHS1b = 5
cHB1b = 1
cHOpb = 2
cHS2b = 9
cHB2b = 2
cIOn = 1
cIS1 = 5
cIB1 = 1
cIOp = 4
cIS2 = 7
cIB2 = 2
cIAnd = 1
cIS1b = 5
cIB1b = 1
cIOpb = 2
cIS2b = 8
cIB2b = 2
cJOn = 1
cJS1 = 5
cJB1 = 1
cJOp = 4
cJS2 = 6
cJB2 = 2
cJAnd = 1
cJS1b = 5
cJB1b = 1
cJOpb = 2
cJS2b = 7
cJB2b = 2
cKOn = 1
cKS1 = 5
cKB1 = 1
cKOp = 2
cKS2 = 6
cKB2 = 2
cKAnd = 0
cKS1b = 5
cKB1b = 1
cKOpb = 2
cKS2b = 6
cKB2b = 2
//--------------------------------------------------------------------//
// RSI
//--------------------------------------------------------------------//
myRsi = rsi[rsiLen](close)
//--------------------------------------------------------------------//
// Calculation and table, on the last bar
//--------------------------------------------------------------------//
IF islastbarupdate THEN
   $lvl[1] = lv1
   $lvl[2] = lv2
   $lvl[3] = lv3
   $lvl[4] = lv4
   $lvl[5] = lv5
   $lvl[6] = lv6
   $lvl[7] = lv7
   $lvl[8] = lv8
   $lvl[9] = lv9
   $lvl[10] = lv10
   $lvl[11] = lv11
   // all 11 conditions, in order (index 0 to 10)
   $qOn[0] = 1
   $qS1[0] = cAS1
   $qB1[0] = cAB1
   $qOp[0] = cAOp
   $qS2[0] = cAS2
   $qB2[0] = cAB2
   $qAnd[0] = cAAnd
   $qS1b[0] = cAS1b
   $qB1b[0] = cAB1b
   $qOpb[0] = cAOpb
   $qS2b[0] = cAS2b
   $qB2b[0] = cAB2b
   $qOn[1] = 1
   $qS1[1] = cBS1
   $qB1[1] = cBB1
   $qOp[1] = cBOp
   $qS2[1] = cBS2
   $qB2[1] = cBB2
   $qAnd[1] = cBAnd
   $qS1b[1] = cBS1b
   $qB1b[1] = cBB1b
   $qOpb[1] = cBOpb
   $qS2b[1] = cBS2b
   $qB2b[1] = cBB2b
   $qOn[2] = cCOn
   $qS1[2] = cCS1
   $qB1[2] = cCB1
   $qOp[2] = cCOp
   $qS2[2] = cCS2
   $qB2[2] = cCB2
   $qAnd[2] = cCAnd
   $qS1b[2] = cCS1b
   $qB1b[2] = cCB1b
   $qOpb[2] = cCOpb
   $qS2b[2] = cCS2b
   $qB2b[2] = cCB2b
   $qOn[3] = cDOn
   $qS1[3] = cDS1
   $qB1[3] = cDB1
   $qOp[3] = cDOp
   $qS2[3] = cDS2
   $qB2[3] = cDB2
   $qAnd[3] = cDAnd
   $qS1b[3] = cDS1b
   $qB1b[3] = cDB1b
   $qOpb[3] = cDOpb
   $qS2b[3] = cDS2b
   $qB2b[3] = cDB2b
   $qOn[4] = cEOn
   $qS1[4] = cES1
   $qB1[4] = cEB1
   $qOp[4] = cEOp
   $qS2[4] = cES2
   $qB2[4] = cEB2
   $qAnd[4] = cEAnd
   $qS1b[4] = cES1b
   $qB1b[4] = cEB1b
   $qOpb[4] = cEOpb
   $qS2b[4] = cES2b
   $qB2b[4] = cEB2b
   $qOn[5] = cFOn
   $qS1[5] = cFS1
   $qB1[5] = cFB1
   $qOp[5] = cFOp
   $qS2[5] = cFS2
   $qB2[5] = cFB2
   $qAnd[5] = cFAnd
   $qS1b[5] = cFS1b
   $qB1b[5] = cFB1b
   $qOpb[5] = cFOpb
   $qS2b[5] = cFS2b
   $qB2b[5] = cFB2b
   $qOn[6] = cGOn
   $qS1[6] = cGS1
   $qB1[6] = cGB1
   $qOp[6] = cGOp
   $qS2[6] = cGS2
   $qB2[6] = cGB2
   $qAnd[6] = cGAnd
   $qS1b[6] = cGS1b
   $qB1b[6] = cGB1b
   $qOpb[6] = cGOpb
   $qS2b[6] = cGS2b
   $qB2b[6] = cGB2b
   $qOn[7] = cHOn
   $qS1[7] = cHS1
   $qB1[7] = cHB1
   $qOp[7] = cHOp
   $qS2[7] = cHS2
   $qB2[7] = cHB2
   $qAnd[7] = cHAnd
   $qS1b[7] = cHS1b
   $qB1b[7] = cHB1b
   $qOpb[7] = cHOpb
   $qS2b[7] = cHS2b
   $qB2b[7] = cHB2b
   $qOn[8] = cIOn
   $qS1[8] = cIS1
   $qB1[8] = cIB1
   $qOp[8] = cIOp
   $qS2[8] = cIS2
   $qB2[8] = cIB2
   $qAnd[8] = cIAnd
   $qS1b[8] = cIS1b
   $qB1b[8] = cIB1b
   $qOpb[8] = cIOpb
   $qS2b[8] = cIS2b
   $qB2b[8] = cIB2b
   $qOn[9] = cJOn
   $qS1[9] = cJS1
   $qB1[9] = cJB1
   $qOp[9] = cJOp
   $qS2[9] = cJS2
   $qB2[9] = cJB2
   $qAnd[9] = cJAnd
   $qS1b[9] = cJS1b
   $qB1b[9] = cJB1b
   $qOpb[9] = cJOpb
   $qS2b[9] = cJS2b
   $qB2b[9] = cJB2b
   $qOn[10] = cKOn
   $qS1[10] = cKS1
   $qB1[10] = cKB1
   $qOp[10] = cKOp
   $qS2[10] = cKS2
   $qB2[10] = cKB2
   $qAnd[10] = cKAnd
   $qS1b[10] = cKS1b
   $qB1b[10] = cKB1b
   $qOpb[10] = cKOpb
   $qS2b[10] = cKS2b
   $qB2b[10] = cKB2b
   // the deepest look-back of all the inputs, used or not
   maxBack = 0
   FOR q = 0 TO 10 DO
      maxBack = max(maxBack, max(max($qB1[q], $qB2[q]), max($qB1b[q], $qB2b[q])))
   NEXT
   // active conditions are the rows of the contingency table
   nRows = 0
   FOR q = 0 TO 10 DO
      IF $qOn[q] = 1 THEN
         $rQ[nRows] = q
         nRows = nRows + 1
      ENDIF
   NEXT
   nCols = 3
   IF outcomeT = 2 OR outcomeT = 3 THEN
      nCols = 2
   ENDIF
   dof = (nRows - 1) * (nCols - 1)
   // bins: row r, column c at r * 4 + c; column nCols = row sum, row nRows = column sums
   FOR q = 0 TO 47 DO
      $bin[q] = 0
   NEXT
   //-----------------------------------------------------------------//
   // Fill: every bar of the population, every true condition adds one
   // to the column of the outcome of that bar (close vs previous close)
   //-----------------------------------------------------------------//
   popN = 0
   FOR i = 0 TO back - 1 DO
      IF i + maxBack > barindex THEN
         BREAK
      ENDIF
      popN = popN + 1
      oc = -1
      IF barindex >= i + 1 THEN
         IF outcomeT = 1 THEN
            IF close[i] > close[i + 1] THEN
               oc = 0
            ELSIF close[i + 1] > close[i] THEN
               oc = 1
            ELSE
               oc = 2
            ENDIF
         ELSIF outcomeT = 2 THEN
            IF close[i] > close[i + 1] THEN
               oc = 0
            ELSE
               oc = 1
            ENDIF
         ELSE
            IF close[i] >= close[i + 1] THEN
               oc = 0
            ELSE
               oc = 1
            ENDIF
         ENDIF
      ENDIF
      IF oc >= 0 THEN
         FOR r = 0 TO nRows - 1 DO
            q = $rQ[r]
            nT = 2
            IF $qAnd[q] = 1 THEN
               nT = 4
            ENDIF
            // values of the terms: 0-1 first comparison, 2-3 second one
            FOR t = 0 TO nT - 1 DO
               IF t = 0 THEN
                  tS = $qS1[q]
                  tB = $qB1[q]
               ELSIF t = 1 THEN
                  tS = $qS2[q]
                  tB = $qB2[q]
               ELSIF t = 2 THEN
                  tS = $qS1b[q]
                  tB = $qB1b[q]
               ELSE
                  tS = $qS2b[q]
                  tB = $qB2b[q]
               ENDIF
               tOk = 1
               tV = 0
               IF tS >= 6 THEN
                  tV = $lvl[tS - 5]
               ELSIF tB + i > barindex THEN
                  tOk = 0
               ELSIF tS = 1 THEN
                  tV = open[tB + i]
               ELSIF tS = 2 THEN
                  tV = high[tB + i]
               ELSIF tS = 3 THEN
                  tV = low[tB + i]
               ELSIF tS = 4 THEN
                  tV = close[tB + i]
               ELSE
                  // the RSI has no value during its first rsiLen bars
                  IF barindex - tB - i >= rsiLen THEN
                     tV = myRsi[tB + i]
                  ELSE
                     tOk = 0
                  ENDIF
               ENDIF
               $tV[t] = tV
               $tOk[t] = tOk
            NEXT
            // comparisons
            hit = 1
            FOR cp = 0 TO nT / 2 - 1 DO
               IF cp = 0 THEN
                  cOp = $qOp[q]
               ELSE
                  cOp = $qOpb[q]
               ENDIF
               vA = $tV[2 * cp]
               vB = $tV[2 * cp + 1]
               okC = 0
               IF $tOk[2 * cp] = 1 AND $tOk[2 * cp + 1] = 1 THEN
                  IF cOp = 1 THEN
                     IF vB > vA THEN
                        okC = 1
                     ENDIF
                  ELSIF cOp = 2 THEN
                     IF vB >= vA THEN
                        okC = 1
                     ENDIF
                  ELSIF cOp = 3 THEN
                     IF vA = vB THEN
                        okC = 1
                     ENDIF
                  ELSIF cOp = 4 THEN
                     IF vA > vB THEN
                        okC = 1
                     ENDIF
                  ELSE
                     IF vA >= vB THEN
                        okC = 1
                     ENDIF
                  ENDIF
               ENDIF
               IF okC = 0 THEN
                  hit = 0
               ENDIF
            NEXT
            IF hit = 1 THEN
               $bin[r * 4 + oc] = $bin[r * 4 + oc] + 1
            ENDIF
         NEXT
      ENDIF
   NEXT
   //-----------------------------------------------------------------//
   // Totals and Chi-Square
   //-----------------------------------------------------------------//
   FOR r = 0 TO nRows - 1 DO
      sR = 0
      FOR c = 0 TO nCols - 1 DO
         sR = sR + $bin[r * 4 + c]
      NEXT
      $bin[r * 4 + nCols] = sR
   NEXT
   FOR c = 0 TO nCols DO
      sC = 0
      FOR r = 0 TO nRows - 1 DO
         sC = sC + $bin[r * 4 + c]
      NEXT
      $bin[nRows * 4 + c] = sC
   NEXT
   sumT = $bin[nRows * 4 + nCols]
   chiOk = 0
   chiSq = 0
   IF sumT > 0 THEN
      chiOk = 1
      FOR r = 0 TO nRows - 1 DO
         FOR c = 0 TO nCols - 1 DO
            obsV = $bin[r * 4 + c]
            // division by zero protection, as in the original
            expV = max(0.000000000001, $bin[r * 4 + nCols] * $bin[nRows * 4 + c] / sumT)
            chiSq = chiSq + square(obsV - expV) / expV
         NEXT
      NEXT
   ENDIF
   //-----------------------------------------------------------------//
   // P-value: incomplete gamma function (series or continued fraction)
   //-----------------------------------------------------------------//
   pV = 1
   cdfRaw = 0
   IF chiOk = 1 AND dof >= 1 THEN
      gX = chiSq / 2
      gA = dof / 2
      // log of the gamma function of gA
      sG = 1 + 76.18009173 / gA - 86.50532033 / (gA + 1) + 24.01409822 / (gA + 2) - 1.231739516 / (gA + 3) + 0.00120858003 / (gA + 4) - 0.00000536382 / (gA + 5)
      lnGam = (gA - 0.5) * log(gA + 4.5) - (gA + 4.5) + log(sG * 2.50662827465)
      IF gX > 0 THEN
         IF gA + 1 > gX THEN
            // series
            gT = 1 / gA
            gG = gT
            gI = 1
            WHILE gT > gG * 0.00001 DO
               gT = gT * gX / (gA + gI)
               gG = gG + gT
               gI = gI + 1
            WEND
            cdfRaw = gG * exp(gA * log(gX) - gX - lnGam)
         ELSE
            // continued fraction
            a0 = 0
            b0 = 1
            a1 = 1
            b1 = gX
            aOld = 0
            gN = 0
            WHILE abs((a1 - aOld) / a1) > 0.00001 DO
               aOld = a1
               gN = gN + 1
               a0 = a1 + (gN - gA) * a0
               b0 = b1 + (gN - gA) * b0
               a1 = gX * a0 + gN * a1
               b1 = gX * b0 + gN * b1
               a0 = a0 / b1
               b0 = b0 / b1
               a1 = a1 / b1
               b1 = 1
            WEND
            cdfRaw = 1 - exp(gA * log(gX) - gX - lnGam) * a1
         ENDIF
      ENDIF
      pV = 1 - round(cdfRaw * 100000) / 100000
   ENDIF
   // Table method: bracket of the p-value between two of the classic
   // significance levels of the Chi-Square table
   $pLev[1] = 0.995
   $pLev[2] = 0.99
   $pLev[3] = 0.975
   $pLev[4] = 0.95
   $pLev[5] = 0.9
   $pLev[6] = 0.5
   $pLev[7] = 0.2
   $pLev[8] = 0.1
   $pLev[9] = 0.05
   $pLev[10] = 0.025
   $pLev[11] = 0.02
   $pLev[12] = 0.01
   $pLev[13] = 0.005
   $pLev[14] = 0.002
   $pLev[15] = 0.001
   pExact = 1 - cdfRaw
   pLeft = 1
   pRight = 16
   FOR c = 1 TO 15 DO
      IF $pLev[c] > pExact THEN
         pLeft = c
      ENDIF
   NEXT
   FOR c = 15 DOWNTO 1 DO
      IF pExact > $pLev[c] THEN
         pRight = c
      ENDIF
   NEXT
   pRight = min(15, pRight)
   pHi = $pLev[pLeft]
   pLo = $pLev[pRight]
   //-----------------------------------------------------------------//
   // Population start
   //-----------------------------------------------------------------//
   IF barindex >= back THEN
      DRAWVLINE(barindex - back) COLOURED(150, 150, 150)
   ENDIF
   //-----------------------------------------------------------------//
   // Table (top right)
   //-----------------------------------------------------------------//
   rowH = 18
   colW = 80
   condW = 334
   tblW = condW + (nCols + 1) * colW
   xL = -10 - tblW
   yT = -10
   IF dof > 50 THEN
      DRAWTEXT("Degrees Of Freedom too high", xL + 120, yT - 9, SansSerif, Bold, 10) ANCHOR(TOPRIGHT, XSHIFT, YSHIFT) COLOURED(255, 0, 0)
   ELSE
      nLines = nRows + 6
      yB = yT - nLines * rowH
      DRAWRECTANGLE(xL, yT, -10, yB) ANCHOR(TOPRIGHT, XSHIFT, YSHIFT) COLOURED(192, 192, 192, 255) FILLCOLOR(19, 23, 34, 240)
      // shaded cells: CLOSE header, sum column, totals row and the result rows
      xS = xL + condW + nCols * colW
      DRAWRECTANGLE(xS, yT, -10, yT - (nRows + 2) * rowH) ANCHOR(TOPRIGHT, XSHIFT, YSHIFT) COLOURED(192, 192, 192, 0) FILLCOLOR(192, 192, 192, 38)
      DRAWRECTANGLE(xL + condW, yT - (nRows + 1) * rowH, xS, yT - (nRows + 2) * rowH) ANCHOR(TOPRIGHT, XSHIFT, YSHIFT) COLOURED(192, 192, 192, 0) FILLCOLOR(192, 192, 192, 38)
      DRAWRECTANGLE(xL, yT - (nRows + 2) * rowH, -10, yB) ANCHOR(TOPRIGHT, XSHIFT, YSHIFT) COLOURED(192, 192, 192, 0) FILLCOLOR(0, 188, 212, 38)
      // grid
      FOR r = 1 TO nRows + 3 DO
         yG = yT - r * rowH
         DRAWSEGMENT(xL, yG, -10, yG) ANCHOR(TOPRIGHT, XSHIFT, YSHIFT) COLOURED(192, 192, 192, 120)
      NEXT
      FOR c = 0 TO nCols DO
         xG = xL + condW + c * colW
         DRAWSEGMENT(xG, yT, xG, yT - (nRows + 2) * rowH) ANCHOR(TOPRIGHT, XSHIFT, YSHIFT) COLOURED(192, 192, 192, 120)
      NEXT
      // header: outcome names
      yH = yT - rowH / 2
      xC0 = xL + condW + colW / 2
      IF outcomeT = 1 THEN
         DRAWTEXT("UP", xC0, yH, SansSerif, Standard, 10) ANCHOR(TOPRIGHT, XSHIFT, YSHIFT) COLOURED(0, 188, 212)
         DRAWTEXT("DOWN", xC0 + colW, yH, SansSerif, Standard, 10) ANCHOR(TOPRIGHT, XSHIFT, YSHIFT) COLOURED(0, 188, 212)
         DRAWTEXT("EQUAL", xC0 + 2 * colW, yH, SansSerif, Standard, 10) ANCHOR(TOPRIGHT, XSHIFT, YSHIFT) COLOURED(0, 188, 212)
      ELSIF outcomeT = 2 THEN
         DRAWTEXT("UP", xC0, yH, SansSerif, Standard, 10) ANCHOR(TOPRIGHT, XSHIFT, YSHIFT) COLOURED(0, 188, 212)
         DRAWTEXT("DOWN/EQUAL", xC0 + colW, yH, SansSerif, Standard, 10) ANCHOR(TOPRIGHT, XSHIFT, YSHIFT) COLOURED(0, 188, 212)
      ELSE
         DRAWTEXT("UP/EQUAL", xC0, yH, SansSerif, Standard, 10) ANCHOR(TOPRIGHT, XSHIFT, YSHIFT) COLOURED(0, 188, 212)
         DRAWTEXT("DOWN", xC0 + colW, yH, SansSerif, Standard, 10) ANCHOR(TOPRIGHT, XSHIFT, YSHIFT) COLOURED(0, 188, 212)
      ENDIF
      DRAWTEXT("◄ CLOSE", xC0 + nCols * colW, yH, SansSerif, Standard, 10) ANCHOR(TOPRIGHT, XSHIFT, YSHIFT) COLOURED(0, 188, 212)
      // condition texts, piece by piece:
      // term, operator, term, and, term, operator, term
      FOR r = 0 TO nRows - 1 DO
         q = $rQ[r]
         yR = yT - (r + 1) * rowH - rowH / 2
         nT = 2
         IF $qAnd[q] = 1 THEN
            nT = 4
            DRAWTEXT("and", xL + 165, yR, SansSerif, Standard, 10) ANCHOR(TOPRIGHT, XSHIFT, YSHIFT) COLOURED(0, 188, 212)
         ENDIF
         FOR t = 0 TO nT - 1 DO
            IF t = 0 THEN
               tS = $qS1[q]
               tB = $qB1[q]
               xT = xL + 34
            ELSIF t = 1 THEN
               tS = $qS2[q]
               tB = $qB2[q]
               xT = xL + 120
            ELSIF t = 2 THEN
               tS = $qS1b[q]
               tB = $qB1b[q]
               xT = xL + 208
            ELSE
               tS = $qS2b[q]
               tB = $qB2b[q]
               xT = xL + 294
            ENDIF
            IF tS >= 6 THEN
               lvT = $lvl[tS - 5]
               DRAWTEXT("#lvT#", xT, yR, SansSerif, Standard, 10) ANCHOR(TOPRIGHT, XSHIFT, YSHIFT) COLOURED(0, 188, 212)
            ELSIF tB = 0 THEN
               IF tS = 1 THEN
                  DRAWTEXT("open", xT, yR, SansSerif, Standard, 10) ANCHOR(TOPRIGHT, XSHIFT, YSHIFT) COLOURED(0, 188, 212)
               ELSIF tS = 2 THEN
                  DRAWTEXT("high", xT, yR, SansSerif, Standard, 10) ANCHOR(TOPRIGHT, XSHIFT, YSHIFT) COLOURED(0, 188, 212)
               ELSIF tS = 3 THEN
                  DRAWTEXT("low", xT, yR, SansSerif, Standard, 10) ANCHOR(TOPRIGHT, XSHIFT, YSHIFT) COLOURED(0, 188, 212)
               ELSIF tS = 4 THEN
                  DRAWTEXT("close", xT, yR, SansSerif, Standard, 10) ANCHOR(TOPRIGHT, XSHIFT, YSHIFT) COLOURED(0, 188, 212)
               ELSE
                  DRAWTEXT("rsi", xT, yR, SansSerif, Standard, 10) ANCHOR(TOPRIGHT, XSHIFT, YSHIFT) COLOURED(0, 188, 212)
               ENDIF
            ELSE
               IF tS = 1 THEN
                  DRAWTEXT("open[#tB#]", xT, yR, SansSerif, Standard, 10) ANCHOR(TOPRIGHT, XSHIFT, YSHIFT) COLOURED(0, 188, 212)
               ELSIF tS = 2 THEN
                  DRAWTEXT("high[#tB#]", xT, yR, SansSerif, Standard, 10) ANCHOR(TOPRIGHT, XSHIFT, YSHIFT) COLOURED(0, 188, 212)
               ELSIF tS = 3 THEN
                  DRAWTEXT("low[#tB#]", xT, yR, SansSerif, Standard, 10) ANCHOR(TOPRIGHT, XSHIFT, YSHIFT) COLOURED(0, 188, 212)
               ELSIF tS = 4 THEN
                  DRAWTEXT("close[#tB#]", xT, yR, SansSerif, Standard, 10) ANCHOR(TOPRIGHT, XSHIFT, YSHIFT) COLOURED(0, 188, 212)
               ELSE
                  DRAWTEXT("rsi[#tB#]", xT, yR, SansSerif, Standard, 10) ANCHOR(TOPRIGHT, XSHIFT, YSHIFT) COLOURED(0, 188, 212)
               ENDIF
            ENDIF
            // operator after the first term of each comparison
            IF t = 0 OR t = 2 THEN
               IF t = 0 THEN
                  cOp = $qOp[q]
               ELSE
                  cOp = $qOpb[q]
               ENDIF
               xO = xT + 44
               IF cOp = 1 THEN
                  DRAWTEXT("‹", xO, yR, SansSerif, Standard, 10) ANCHOR(TOPRIGHT, XSHIFT, YSHIFT) COLOURED(0, 188, 212)
               ELSIF cOp = 2 THEN
                  DRAWTEXT("≤", xO, yR, SansSerif, Standard, 10) ANCHOR(TOPRIGHT, XSHIFT, YSHIFT) COLOURED(0, 188, 212)
               ELSIF cOp = 3 THEN
                  DRAWTEXT("=", xO, yR, SansSerif, Standard, 10) ANCHOR(TOPRIGHT, XSHIFT, YSHIFT) COLOURED(0, 188, 212)
               ELSIF cOp = 4 THEN
                  DRAWTEXT(">", xO, yR, SansSerif, Standard, 10) ANCHOR(TOPRIGHT, XSHIFT, YSHIFT) COLOURED(0, 188, 212)
               ELSE
                  DRAWTEXT("≥", xO, yR, SansSerif, Standard, 10) ANCHOR(TOPRIGHT, XSHIFT, YSHIFT) COLOURED(0, 188, 212)
               ENDIF
            ENDIF
         NEXT
      NEXT
      DRAWTEXT("▲ CONDITION", xL + condW / 2, yT - (nRows + 1) * rowH - rowH / 2, SansSerif, Standard, 10) ANCHOR(TOPRIGHT, XSHIFT, YSHIFT) COLOURED(0, 188, 212)
      // counts, row sums and column sums
      FOR r = 0 TO nRows DO
         yR = yT - (r + 1) * rowH - rowH / 2
         FOR c = 0 TO nCols DO
            cntV = $bin[r * 4 + c]
            DRAWTEXT("#cntV#", xC0 + c * colW, yR, SansSerif, Standard, 10) ANCHOR(TOPRIGHT, XSHIFT, YSHIFT) COLOURED(255, 255, 255)
         NEXT
      NEXT
      // results
      xM = xL + tblW / 2
      yP = yT - (nRows + 2) * rowH
      IF chiOk = 0 THEN
         DRAWTEXT("P-value: NaN", xM, yP - rowH / 2, SansSerif, Standard, 10) ANCHOR(TOPRIGHT, XSHIFT, YSHIFT) COLOURED(255, 235, 59)
      ELSIF pMethod = 2 THEN
         DRAWTEXT("P-value: [#pLo#-#pHi#]", xM, yP - rowH / 2, SansSerif, Standard, 10) ANCHOR(TOPRIGHT, XSHIFT, YSHIFT) COLOURED(255, 235, 59)
      ELSE
         DRAWTEXT("P-value: #pV#", xM, yP - rowH / 2, SansSerif, Standard, 10) ANCHOR(TOPRIGHT, XSHIFT, YSHIFT) COLOURED(255, 235, 59)
      ENDIF
      DRAWTEXT("(population: #popN#)", xM, yP - rowH - rowH / 2, SansSerif, Standard, 10) ANCHOR(TOPRIGHT, XSHIFT, YSHIFT) COLOURED(255, 235, 59)
      DRAWTEXT("Degrees Of Freedom: #dof#", xM, yP - 2 * rowH - rowH / 2, SansSerif, Standard, 10) ANCHOR(TOPRIGHT, XSHIFT, YSHIFT) COLOURED(255, 235, 59)
      IF chiOk = 1 THEN
         chiR = round(chiSq * 1000) / 1000
         DRAWTEXT("Chi-Square: #chiR#", xM, yP - 3 * rowH - rowH / 2, SansSerif, Standard, 10) ANCHOR(TOPRIGHT, XSHIFT, YSHIFT) COLOURED(255, 235, 59)
      ELSE
         DRAWTEXT("Chi-Square: NaN", xM, yP - 3 * rowH - rowH / 2, SansSerif, Standard, 10) ANCHOR(TOPRIGHT, XSHIFT, YSHIFT) COLOURED(255, 235, 59)
      ENDIF
   ENDIF
ENDIF
RETURN
Conclusion
Most trading ideas are built on conditions that look meaningful on a chart. This indicator puts them to a simple, standard statistical test, directly on your instrument and timeframe, so you can tell a real effect from a pattern that chance alone would produce.