Peak Trading Activity Graphs
Introduction
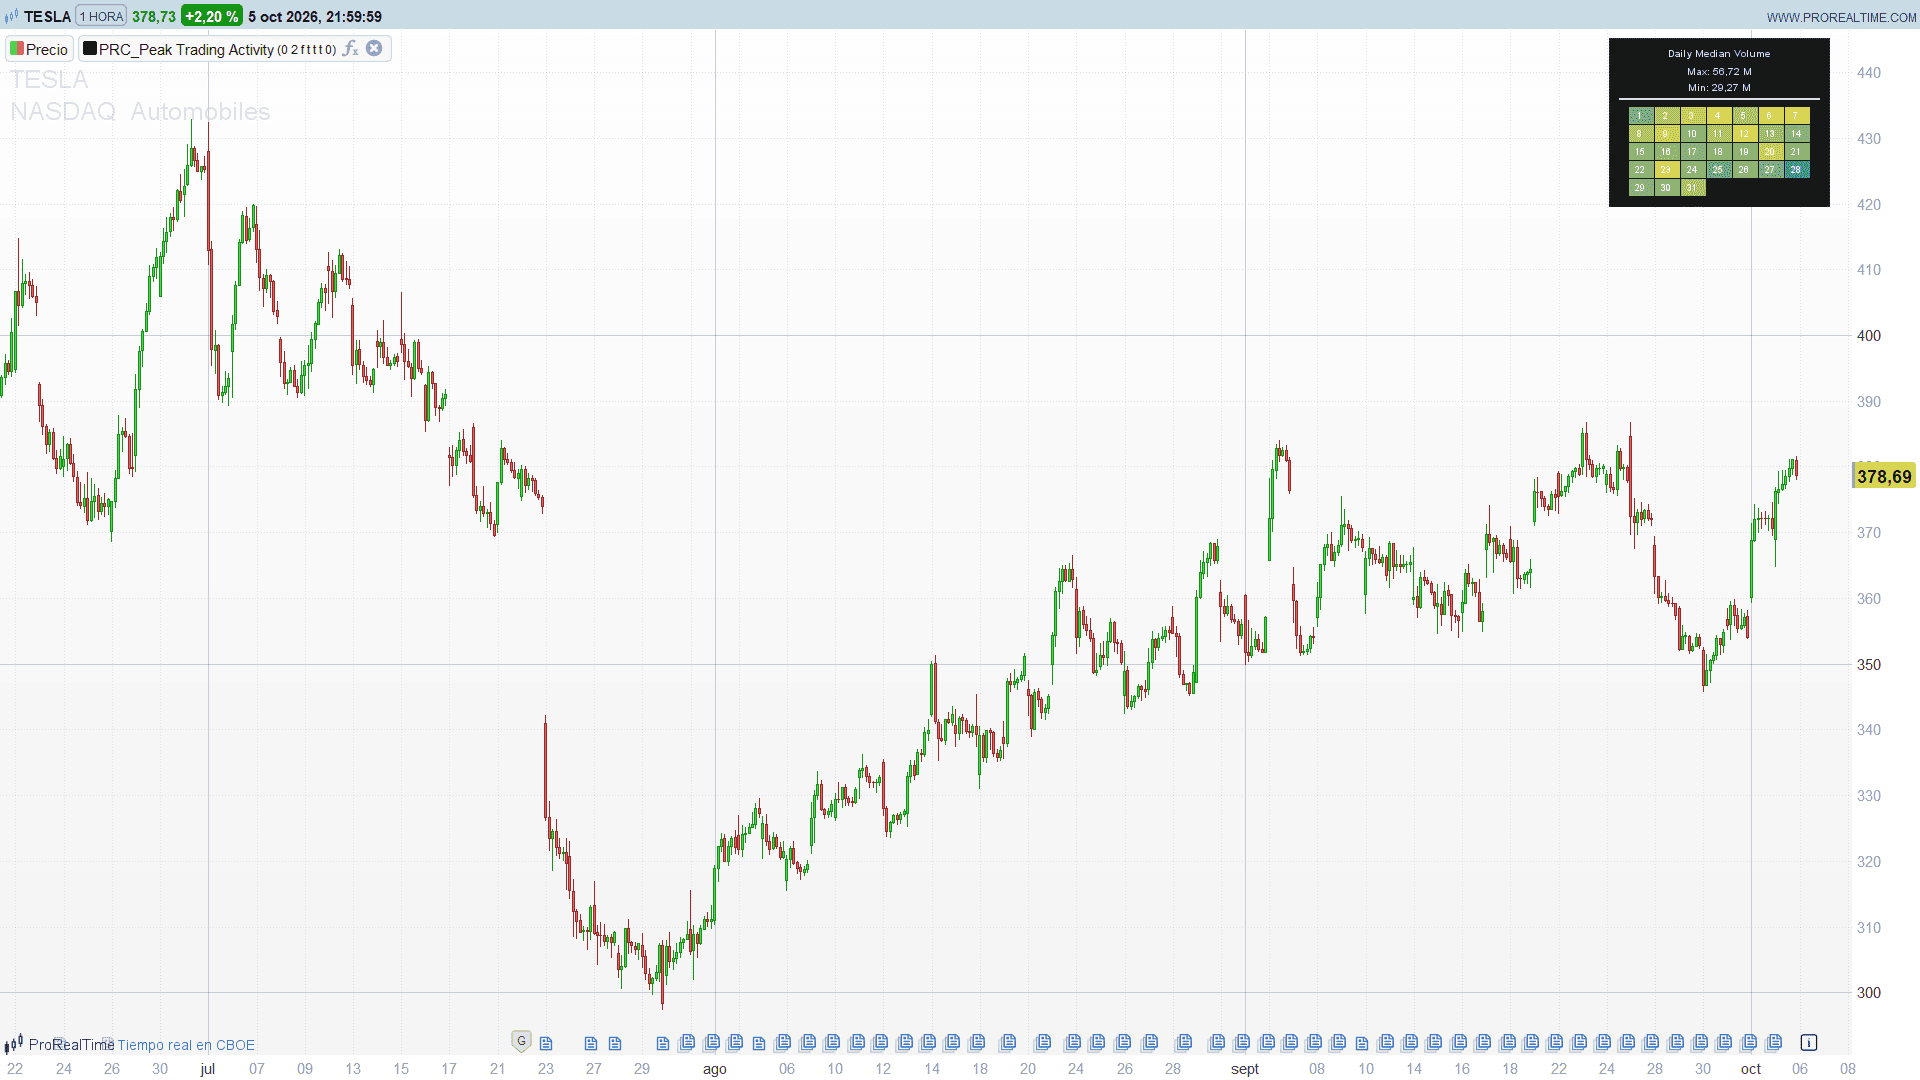
Activity is not spread evenly over time. Some hours of the session concentrate most of the volume, some weekdays move much more than others, and some days of the month or months of the year are consistently quieter. Peak Trading Activity Graphs measures this on the instrument you are looking at and shows it as a small heatmap panel on the price chart.
You choose what to measure (volume or volatility) and how to group it (months, days of the month, days of the week or hours of the day). For each group the indicator takes the median value over the whole loaded history, scores it from 1 to 100 and colours it from cold to hot, so the busiest and the quietest periods stand out at a glance.
Theory Behind the Indicator
Periods and their values
The history is cut into periods of the selected kind: every hour, every day or every month. For each period the indicator computes:
- Volume: the total volume traded in the period.
- Volatility: the true range of the period, that is, the distance between its highest and lowest price, extended to the previous period’s close when there is a gap.
Each period is then assigned to its group: the hour of the day (0 to 23), the day of the week, the day of the month (1 to 31) or the month (January to December).
Why the median
A single news day or an expiry can produce a volume several times larger than normal. An average would be pulled up by those few outliers; the median is the typical value of the group and is not distorted by them. On a chart with a lower timeframe than the period, each period’s value is counted once per bar of the following period, so groups are compared on the same footing whatever the chart timeframe.
Score and colours
Each group’s median is divided by the largest median and turned into a score from 1 to 100. With Delta enabled, the scale is stretched between the smallest median (0) and the largest one (100), which makes small differences much easier to see. The score sets the height of each column and its colour, from cold (low activity) through lukewarm to hot (high activity).
Key Features at a Glance
- Median volume or median volatility for every group
- Four groupings: months, days of the month, days of the week and hours of the day
- Vertical columns for months, weekdays and hours; a 7-column calendar for the days of the month
- Optional Delta mode that rescales the medians between the smallest and the largest
- Min and max medians in the header, with K, M and B for volume
- Viridis, Plasma and Magma colour maps, or your own three colours
- Adjustable width and height of the graph
- Warning instead of the graph when the chart timeframe is above the chosen period
How to Read the Indicator
- Hot colours and tall columns are the periods of highest typical activity; cold colours and short columns, the lowest.
- The header shows the grouping, the data and the lowest and highest medians, so you know the real range behind the colours.
- Days of the week: if the history has Saturday bars (crypto), the seven days are shown; otherwise Monday to Friday, with the Sunday evening session counted in Monday.
- Hours are those of the chart’s time zone.
- Empty columns or uncoloured calendar cells are groups with no data, for example the night hours of a stock market.
Practical Applications
- Choosing when to trade. The hours with the highest median volatility are where breakout strategies have room to work; the quiet ones suit range strategies or no trading at all.
- Position sizing and stops. Weekdays or months with higher median volatility call for wider stops or smaller size.
- Liquidity planning. The calendar of the days of the month shows recurring volume peaks around month starts, month ends or expiries.
- Comparing instruments. The same graph on two markets shows whether their active hours overlap.
Indicator Configuration
baseData(default: 0): data to measure. 0 = volume, 1 = volatility (true range of the period).periodSel(default: 2): grouping. 1 = months, 2 = days of the month, 3 = days of the week, 4 = hours.deltaOn(default: 0): 1 = display the delta between medians (smallest = 0, largest = 100).dashCorner(default: 1): corner of the graph. 1 = top right, 2 = bottom right, 3 = bottom left. For 2 or 3, also replace the wordTOPRIGHTin the code withBOTTOMRIGHTorBOTTOMLEFT(find and replace in the editor).dashW(default: 1) anddashH(default: 1): width and height multipliers of the graph.colorMap(default: 0): 0 = Viridis, 1 = Plasma, 2 = Magma, 3 = custom colours.custColdR/G/B,custWarmR/G/B,custHotR/G/B: the three custom colours (cold, lukewarm and hot), used withcolorMap = 3.
The graph needs a chart timeframe equal to or lower than the grouping: up to 1 hour for hours, up to daily for days and up to monthly for months.
Code
//---------------------------------------------------------------
// PRC_Peak Trading Activity
// version = 0
// 06.10.2026
// Iván González @ www.prorealcode.com
// Author: LuxAlgo
// Sharing ProRealTime knowledge
//--------------------------------------------------------------------//
DEFPARAM DRAWONLASTBARONLY = TRUE
//--------------------------------------------------------------------//
// INPUTS
//--------------------------------------------------------------------//
baseData = 0 // Data: 0 = Volume, 1 = Volatility (true range of the period)
periodSel = 2 // Period: 1 = Months, 2 = Days of Month, 3 = Days of Week, 4 = Hours
deltaOn = 0 // 1 = display the delta between medians (smallest = 0, largest = 100)
// Graph
dashCorner = 1 // 1 = Top Right, 2 = Bottom Right, 3 = Bottom Left (also edit the ANCHOR keyword, see notes)
dashW = 1 // graph width multiplier (>= 1)
dashH = 1 // graph height multiplier (>= 1)
// Style
colorMap = 0 // 0 = Viridis, 1 = Plasma, 2 = Magma, 3 = Custom
custColdR = 242 // Custom Cold
custColdG = 54
custColdB = 69
custWarmR = 242 // Custom Lukewarm
custWarmG = 232
custWarmB = 5
custHotR = 8 // Custom Hot
custHotG = 153
custHotB = 129
//--------------------------------------------------------------------//
// COLOURS
//--------------------------------------------------------------------//
dataR = 219 // panel text
dataG = 219
dataB = 219
bgR = 22 // panel background
bgG = 22
bgB = 22
frameR = 46 // panel frame
frameG = 46
frameB = 46
IF colorMap = 0 THEN
coldR = 64
coldG = 10
coldB = 83
warmR = 64
warmG = 142
warmB = 139
hotR = 248
hotG = 230
hotB = 80
ELSIF colorMap = 1 THEN
coldR = 17
coldG = 10
coldB = 129
warmR = 184
warmG = 72
warmB = 125
hotR = 248
hotG = 230
hotB = 80
ELSIF colorMap = 2 THEN
coldR = 0
coldG = 0
coldB = 5
warmR = 157
warmG = 59
warmB = 122
hotR = 252
hotG = 247
hotB = 190
ELSE
coldR = custColdR
coldG = custColdG
coldB = custColdB
warmR = custWarmR
warmG = custWarmG
warmB = custWarmB
hotR = custHotR
hotG = custHotG
hotB = custHotB
ENDIF
//--------------------------------------------------------------------//
// CHART TIMEFRAME (minimum spacing between bars)
//--------------------------------------------------------------------//
ONCE tfChart = 0
ONCE dayGap = 0
mNow = floor(opentime / 10000) * 60 + (floor(opentime / 100) MOD 100)
IF barindex > 0 THEN
IF date = date[1] THEN
dtM = mNow - mNow[1]
IF dtM > 0 AND (tfChart = 0 OR dtM < tfChart) THEN
tfChart = dtM
ENDIF
ELSIF date - date[1] > 0 AND (dayGap = 0 OR date - date[1] < dayGap) THEN
dayGap = date - date[1]
ENDIF
ENDIF
// the graph is only built when the chart timeframe is not above the period
tooHigh = 0
IF periodSel = 4 THEN
IF tfChart > 60 OR (tfChart = 0 AND dayGap > 0) THEN
tooHigh = 1
ENDIF
ELSIF periodSel = 1 THEN
IF tfChart = 0 AND dayGap > 150 THEN
tooHigh = 1
ENDIF
ELSE
IF tfChart = 0 AND dayGap >= 5 THEN
tooHigh = 1
ENDIF
ENDIF
//--------------------------------------------------------------------//
// PERIODS: volume / true range of every hour, day or month
//--------------------------------------------------------------------//
hourKey = floor(opentime / 10000)
monthKey = floor(date / 100)
newP = 0
IF barindex = 0 THEN
newP = 1
ELSIF periodSel = 4 THEN
IF date <> date[1] OR hourKey <> hourKey[1] THEN
newP = 1
ENDIF
ELSIF periodSel = 1 THEN
IF monthKey <> monthKey[1] THEN
newP = 1
ENDIF
ELSE
IF date <> date[1] THEN
newP = 1
ENDIF
ENDIF
// key of the period that starts on this bar
IF periodSel = 1 THEN
keyNow = monthKey MOD 100
ELSIF periodSel = 2 THEN
keyNow = date MOD 100
ELSIF periodSel = 3 THEN
keyNow = dayofweek MOD 7
ELSE
keyNow = hourKey
ENDIF
ONCE nP = 0
ONCE pFirst = 1
ONCE pN = 0
ONCE pVol = 0
ONCE pHi = 0
ONCE pLo = 0
ONCE pKey = 0
ONCE lastC = 0
IF newP = 1 THEN
IF barindex > 0 THEN
// the period that has just finished (the first one is skipped: the chart may start halfway)
IF pFirst = 0 THEN
nP = nP + 1
IF baseData = 0 THEN
$pV[nP] = pVol
ELSE
$pV[nP] = max(pHi, lastC) - min(pLo, lastC)
ENDIF
$pK[nP] = pKey
// each period is sampled once per bar of the following period
$pW[nP - 1] = pN
ENDIF
lastC = close[1]
pFirst = 0
ENDIF
pN = 1
pVol = volume
pHi = high
pLo = low
pKey = keyNow
ELSE
pN = pN + 1
pVol = pVol + volume
pHi = max(pHi, high)
pLo = min(pLo, low)
ENDIF
//--------------------------------------------------------------------//
// GRAPH
//--------------------------------------------------------------------//
IF islastbarupdate THEN
IF tooHigh = 1 THEN
DRAWRECTANGLE(-340, 34, 340, -30) ANCHOR(MIDDLE, XSHIFT, YSHIFT) COLOURED(255, 93, 0, 255) FILLCOLOR(254, 241, 232, 255)
DRAWTEXT("Warning: the tool will not display the graph on higher timeframes.", 0, 12, SansSerif, Bold, 11) COLOURED(255, 93, 0) ANCHOR(MIDDLE, XSHIFT, YSHIFT)
DRAWTEXT("Please select a chart timeframe equal to or lower than the Period setting.", 0, -10, SansSerif, Standard, 11) COLOURED(255, 93, 0) ANCHOR(MIDDLE, XSHIFT, YSHIFT)
ELSE
// ---- buckets
has7 = 0
IF periodSel = 1 THEN
nB = 12
ELSIF periodSel = 2 THEN
nB = 31
ELSIF periodSel = 4 THEN
nB = 24
ELSE
IF nP > 0 THEN
FOR k = 1 TO nP DO
IF $pK[k] = 6 THEN
has7 = 1
ENDIF
NEXT
ENDIF
nB = 5 + 2 * has7
ENDIF
FOR b = 0 TO nB - 1 DO
$cnt[b] = 0
$has[b] = 0
$med[b] = 0
NEXT
// ---- assign every period to its bucket
IF nP > 0 THEN
FOR k = 1 TO nP DO
kk = $pK[k]
IF periodSel = 3 THEN
IF has7 = 1 THEN
bk = kk
ELSIF kk = 0 THEN
bk = 0 // Sunday session belongs to Monday
ELSE
bk = kk - 1
ENDIF
ELSIF periodSel = 4 THEN
bk = kk
ELSE
bk = kk - 1
ENDIF
IF bk >= 0 AND bk < nB THEN
$kB[k] = bk
$cnt[bk] = $cnt[bk] + 1
ELSE
$kB[k] = -1
ENDIF
NEXT
ENDIF
$off[0] = 0
$fil[0] = 0
FOR b = 1 TO nB - 1 DO
$off[b] = $off[b - 1] + $cnt[b - 1]
$fil[b] = $off[b]
NEXT
IF nP > 0 THEN
FOR k = 1 TO nP DO
bk = $kB[k]
IF bk >= 0 THEN
IF k = nP THEN
wk = pN
ELSE
wk = $pW[k]
ENDIF
ps = $fil[bk]
$wv[ps] = $pV[k]
$ww[ps] = wk
$fil[bk] = ps + 1
ENDIF
NEXT
ENDIF
// ---- median of every bucket (shell sort + weighted middle element)
FOR b = 0 TO nB - 1 DO
nc = $cnt[b]
IF nc > 0 THEN
o = $off[b]
gp = floor(nc / 2)
WHILE gp > 0 DO
FOR i = o + gp TO o + nc - 1 DO
tv = $wv[i]
tw = $ww[i]
j = i
moving = 1
WHILE moving = 1 DO
moving = 0
IF j >= o + gp THEN
IF $wv[j - gp] > tv THEN
$wv[j] = $wv[j - gp]
$ww[j] = $ww[j - gp]
j = j - gp
moving = 1
ENDIF
ENDIF
WEND
$wv[j] = tv
$ww[j] = tw
NEXT
gp = floor(gp / 2)
WEND
tot = 0
FOR i = o TO o + nc - 1 DO
tot = tot + $ww[i]
NEXT
IF tot MOD 2 = 1 THEN
t1 = (tot + 1) / 2
t2 = t1
ELSE
t1 = tot / 2
t2 = t1 + 1
ENDIF
cum = 0
v1 = 0
v2 = 0
got1 = 0
got2 = 0
FOR i = o TO o + nc - 1 DO
cum = cum + $ww[i]
IF got1 = 0 AND cum >= t1 THEN
v1 = $wv[i]
got1 = 1
ENDIF
IF got2 = 0 AND cum >= t2 THEN
v2 = $wv[i]
got2 = 1
ENDIF
NEXT
$med[b] = (v1 + v2) / 2
$has[b] = 1
ENDIF
NEXT
// ---- min / max of the medians
nHas = 0
mnM = 0
mxM = 0
FOR b = 0 TO nB - 1 DO
IF $has[b] = 1 THEN
IF nHas = 0 THEN
mnM = $med[b]
mxM = $med[b]
ELSE
mnM = min(mnM, $med[b])
mxM = max(mxM, $med[b])
ENDIF
nHas = nHas + 1
ENDIF
NEXT
// ---- 1..100 score and gradient colour of every bucket
FOR b = 0 TO nB - 1 DO
$val[b] = 0
IF $has[b] = 1 THEN
sc = -1
IF deltaOn = 1 THEN
IF mxM > mnM THEN
sc = ($med[b] - mnM) / (mxM - mnM)
ENDIF
ELSIF mxM > 0 THEN
sc = $med[b] / mxM
ENDIF
IF sc >= 0 THEN
vv = max(1, floor(100 * sc))
$val[b] = vv
IF vv >= 50 THEN
tg = min(1, (vv - 50) / 50)
$cR[b] = round(warmR + (hotR - warmR) * tg)
$cG[b] = round(warmG + (hotG - warmG) * tg)
$cB[b] = round(warmB + (hotB - warmB) * tg)
ELSE
tg = max(0, (vv - 1) / 49)
$cR[b] = round(coldR + (warmR - coldR) * tg)
$cG[b] = round(coldG + (warmG - coldG) * tg)
$cB[b] = round(coldB + (warmB - coldB) * tg)
ENDIF
ENDIF
ENDIF
NEXT
// ---- min / max text: volume with K/M/B, volatility rounded to the tick
IF baseData = 0 THEN
IF mnM >= 1000000000 THEN
mnS = 3
mnT = round(mnM / 10000000) / 100
ELSIF mnM >= 1000000 THEN
mnS = 2
mnT = round(mnM / 10000) / 100
ELSIF mnM >= 1000 THEN
mnS = 1
mnT = round(mnM / 10) / 100
ELSE
mnS = 0
mnT = round(mnM)
ENDIF
IF mxM >= 1000000000 THEN
mxS = 3
mxT = round(mxM / 10000000) / 100
ELSIF mxM >= 1000000 THEN
mxS = 2
mxT = round(mxM / 10000) / 100
ELSIF mxM >= 1000 THEN
mxS = 1
mxT = round(mxM / 10) / 100
ELSE
mxS = 0
mxT = round(mxM)
ENDIF
ELSE
mnS = 0
mxS = 0
mnT = round(mnM / pipsize) * pipsize
mxT = round(mxM / pipsize) * pipsize
ENDIF
//---- geometry (pixels, panel coordinates: x to the right, y downwards)
pad = 10
yHead = 14
IF deltaOn = 1 THEN
yInfo = 30
ELSE
yInfo = 16
ENDIF
IF periodSel = 2 THEN
// calendar: 7 columns x 5 rows
cellW = round(26 * dashW)
cellH = round(18 * dashH)
yMax = yInfo + 16
yMin = yMax + 16
yDiv = yMin + 12
gTop = yDiv + 8
gridW = 7 * cellW
panelW = max(gridW + 2 * pad, 220)
panelH = gTop + 5 * cellH + pad
ELSE
// vertical columns
IF periodSel = 4 THEN
colW = round(16 * dashW)
ELSE
colW = round(28 * dashW)
ENDIF
colGap = 4
colH = round(100 * dashH)
yMax = yInfo + 16
yMin = yMax
gTop = yMax + 14
gridW = nB * colW + (nB - 1) * colGap
panelW = max(gridW + 2 * pad, 220)
panelH = gTop + colH + 26
ENDIF
gx0 = round((panelW - gridW) / 2)
// anchor corner -> panel origin
IF dashCorner = 3 THEN
x0 = 8
ELSE
x0 = -88 - panelW
ENDIF
IF dashCorner = 1 THEN
yTop = -8
ELSE
yTop = 8 + panelH
ENDIF
xC = x0 + panelW / 2
// ---- panel
DRAWRECTANGLE(x0, yTop, x0 + panelW, yTop - panelH) ANCHOR(TOPRIGHT, XSHIFT, YSHIFT) COLOURED(frameR, frameG, frameB, 255) FILLCOLOR(bgR, bgG, bgB, 255)
// ---- header
IF periodSel = 1 THEN
IF baseData = 0 THEN
DRAWTEXT("Monthly Median Volume", xC, yTop - yHead, SansSerif, Bold, 10) COLOURED(dataR, dataG, dataB) ANCHOR(TOPRIGHT, XSHIFT, YSHIFT)
ELSE
DRAWTEXT("Monthly Median Volatility", xC, yTop - yHead, SansSerif, Bold, 10) COLOURED(dataR, dataG, dataB) ANCHOR(TOPRIGHT, XSHIFT, YSHIFT)
ENDIF
ELSIF periodSel = 4 THEN
IF baseData = 0 THEN
DRAWTEXT("Hourly Median Volume", xC, yTop - yHead, SansSerif, Bold, 10) COLOURED(dataR, dataG, dataB) ANCHOR(TOPRIGHT, XSHIFT, YSHIFT)
ELSE
DRAWTEXT("Hourly Median Volatility", xC, yTop - yHead, SansSerif, Bold, 10) COLOURED(dataR, dataG, dataB) ANCHOR(TOPRIGHT, XSHIFT, YSHIFT)
ENDIF
ELSE
IF baseData = 0 THEN
DRAWTEXT("Daily Median Volume", xC, yTop - yHead, SansSerif, Bold, 10) COLOURED(dataR, dataG, dataB) ANCHOR(TOPRIGHT, XSHIFT, YSHIFT)
ELSE
DRAWTEXT("Daily Median Volatility", xC, yTop - yHead, SansSerif, Bold, 10) COLOURED(dataR, dataG, dataB) ANCHOR(TOPRIGHT, XSHIFT, YSHIFT)
ENDIF
ENDIF
IF deltaOn = 1 THEN
DRAWTEXT("(Delta)", xC, yTop - 28, SansSerif, Standard, 10) COLOURED(dataR, dataG, dataB) ANCHOR(TOPRIGHT, XSHIFT, YSHIFT)
ENDIF
IF nHas > 0 THEN
IF periodSel = 2 THEN
xMx = xC
xMn = xC
ELSE
xMn = x0 + round(panelW * 0.3)
xMx = x0 + round(panelW * 0.7)
ENDIF
IF mnS = 3 THEN
DRAWTEXT("Min: #mnT#B", xMn, yTop - yMin, SansSerif, Standard, 10) COLOURED(dataR, dataG, dataB) ANCHOR(TOPRIGHT, XSHIFT, YSHIFT)
ELSIF mnS = 2 THEN
DRAWTEXT("Min: #mnT#M", xMn, yTop - yMin, SansSerif, Standard, 10) COLOURED(dataR, dataG, dataB) ANCHOR(TOPRIGHT, XSHIFT, YSHIFT)
ELSIF mnS = 1 THEN
DRAWTEXT("Min: #mnT#K", xMn, yTop - yMin, SansSerif, Standard, 10) COLOURED(dataR, dataG, dataB) ANCHOR(TOPRIGHT, XSHIFT, YSHIFT)
ELSE
DRAWTEXT("Min: #mnT#", xMn, yTop - yMin, SansSerif, Standard, 10) COLOURED(dataR, dataG, dataB) ANCHOR(TOPRIGHT, XSHIFT, YSHIFT)
ENDIF
IF mxS = 3 THEN
DRAWTEXT("Max: #mxT#B", xMx, yTop - yMax, SansSerif, Standard, 10) COLOURED(dataR, dataG, dataB) ANCHOR(TOPRIGHT, XSHIFT, YSHIFT)
ELSIF mxS = 2 THEN
DRAWTEXT("Max: #mxT#M", xMx, yTop - yMax, SansSerif, Standard, 10) COLOURED(dataR, dataG, dataB) ANCHOR(TOPRIGHT, XSHIFT, YSHIFT)
ELSIF mxS = 1 THEN
DRAWTEXT("Max: #mxT#K", xMx, yTop - yMax, SansSerif, Standard, 10) COLOURED(dataR, dataG, dataB) ANCHOR(TOPRIGHT, XSHIFT, YSHIFT)
ELSE
DRAWTEXT("Max: #mxT#", xMx, yTop - yMax, SansSerif, Standard, 10) COLOURED(dataR, dataG, dataB) ANCHOR(TOPRIGHT, XSHIFT, YSHIFT)
ENDIF
ENDIF
IF periodSel = 2 THEN
// ---- calendar of the days of the month
DRAWRECTANGLE(x0 + pad, yTop - yDiv, x0 + panelW - pad, yTop - yDiv - 1) ANCHOR(TOPRIGHT, XSHIFT, YSHIFT) COLOURED(dataR, dataG, dataB, 255) FILLCOLOR(dataR, dataG, dataB, 255)
FOR b = 0 TO 30 DO
dNum = b + 1
cx1 = x0 + gx0 + (b MOD 7) * cellW
cy1 = yTop - gTop - floor(b / 7) * cellH
IF $has[b] = 1 AND $val[b] > 0 THEN
DRAWRECTANGLE(cx1, cy1, cx1 + cellW, cy1 - cellH) ANCHOR(TOPRIGHT, XSHIFT, YSHIFT) COLOURED(bgR, bgG, bgB, 255) FILLCOLOR($cR[b], $cG[b], $cB[b], 255)
ENDIF
DRAWTEXT("#dNum#", cx1 + cellW / 2, cy1 - cellH / 2, SansSerif, Standard, 9) COLOURED(255, 255, 255) ANCHOR(TOPRIGHT, XSHIFT, YSHIFT)
NEXT
ELSE
// ---- one column per bucket, filled from the bottom up to its score
yBase = yTop - gTop - colH
FOR b = 0 TO nB - 1 DO
cx1 = x0 + gx0 + b * (colW + colGap)
xMid = cx1 + colW / 2
IF $has[b] = 1 AND $val[b] > 0 THEN
barTop = yBase + round(colH * $val[b] / 100)
DRAWRECTANGLE(cx1, yBase, cx1 + colW, barTop) ANCHOR(TOPRIGHT, XSHIFT, YSHIFT) COLOURED($cR[b], $cG[b], $cB[b], 255) FILLCOLOR($cR[b], $cG[b], $cB[b], 255)
ENDIF
yLab = yBase - 12
IF periodSel = 4 THEN
hNum = b
DRAWTEXT("#hNum#", xMid, yLab, SansSerif, Standard, 9) COLOURED(dataR, dataG, dataB) ANCHOR(TOPRIGHT, XSHIFT, YSHIFT)
ELSIF periodSel = 1 THEN
IF b = 0 THEN
DRAWTEXT("JAN", xMid, yLab, SansSerif, Standard, 9) COLOURED(dataR, dataG, dataB) ANCHOR(TOPRIGHT, XSHIFT, YSHIFT)
ELSIF b = 1 THEN
DRAWTEXT("FEB", xMid, yLab, SansSerif, Standard, 9) COLOURED(dataR, dataG, dataB) ANCHOR(TOPRIGHT, XSHIFT, YSHIFT)
ELSIF b = 2 THEN
DRAWTEXT("MAR", xMid, yLab, SansSerif, Standard, 9) COLOURED(dataR, dataG, dataB) ANCHOR(TOPRIGHT, XSHIFT, YSHIFT)
ELSIF b = 3 THEN
DRAWTEXT("APR", xMid, yLab, SansSerif, Standard, 9) COLOURED(dataR, dataG, dataB) ANCHOR(TOPRIGHT, XSHIFT, YSHIFT)
ELSIF b = 4 THEN
DRAWTEXT("MAY", xMid, yLab, SansSerif, Standard, 9) COLOURED(dataR, dataG, dataB) ANCHOR(TOPRIGHT, XSHIFT, YSHIFT)
ELSIF b = 5 THEN
DRAWTEXT("JUN", xMid, yLab, SansSerif, Standard, 9) COLOURED(dataR, dataG, dataB) ANCHOR(TOPRIGHT, XSHIFT, YSHIFT)
ELSIF b = 6 THEN
DRAWTEXT("JUL", xMid, yLab, SansSerif, Standard, 9) COLOURED(dataR, dataG, dataB) ANCHOR(TOPRIGHT, XSHIFT, YSHIFT)
ELSIF b = 7 THEN
DRAWTEXT("AUG", xMid, yLab, SansSerif, Standard, 9) COLOURED(dataR, dataG, dataB) ANCHOR(TOPRIGHT, XSHIFT, YSHIFT)
ELSIF b = 8 THEN
DRAWTEXT("SEP", xMid, yLab, SansSerif, Standard, 9) COLOURED(dataR, dataG, dataB) ANCHOR(TOPRIGHT, XSHIFT, YSHIFT)
ELSIF b = 9 THEN
DRAWTEXT("OCT", xMid, yLab, SansSerif, Standard, 9) COLOURED(dataR, dataG, dataB) ANCHOR(TOPRIGHT, XSHIFT, YSHIFT)
ELSIF b = 10 THEN
DRAWTEXT("NOV", xMid, yLab, SansSerif, Standard, 9) COLOURED(dataR, dataG, dataB) ANCHOR(TOPRIGHT, XSHIFT, YSHIFT)
ELSE
DRAWTEXT("DEC", xMid, yLab, SansSerif, Standard, 9) COLOURED(dataR, dataG, dataB) ANCHOR(TOPRIGHT, XSHIFT, YSHIFT)
ENDIF
ELSE
IF has7 = 1 THEN
dName = b
ELSE
dName = b + 1
ENDIF
IF dName = 0 THEN
DRAWTEXT("SUN", xMid, yLab, SansSerif, Standard, 9) COLOURED(dataR, dataG, dataB) ANCHOR(TOPRIGHT, XSHIFT, YSHIFT)
ELSIF dName = 1 THEN
DRAWTEXT("MON", xMid, yLab, SansSerif, Standard, 9) COLOURED(dataR, dataG, dataB) ANCHOR(TOPRIGHT, XSHIFT, YSHIFT)
ELSIF dName = 2 THEN
DRAWTEXT("TUE", xMid, yLab, SansSerif, Standard, 9) COLOURED(dataR, dataG, dataB) ANCHOR(TOPRIGHT, XSHIFT, YSHIFT)
ELSIF dName = 3 THEN
DRAWTEXT("WED", xMid, yLab, SansSerif, Standard, 9) COLOURED(dataR, dataG, dataB) ANCHOR(TOPRIGHT, XSHIFT, YSHIFT)
ELSIF dName = 4 THEN
DRAWTEXT("THU", xMid, yLab, SansSerif, Standard, 9) COLOURED(dataR, dataG, dataB) ANCHOR(TOPRIGHT, XSHIFT, YSHIFT)
ELSIF dName = 5 THEN
DRAWTEXT("FRI", xMid, yLab, SansSerif, Standard, 9) COLOURED(dataR, dataG, dataB) ANCHOR(TOPRIGHT, XSHIFT, YSHIFT)
ELSE
DRAWTEXT("SAT", xMid, yLab, SansSerif, Standard, 9) COLOURED(dataR, dataG, dataB) ANCHOR(TOPRIGHT, XSHIFT, YSHIFT)
ENDIF
ENDIF
NEXT
ENDIF
ENDIF
ENDIF
RETURN