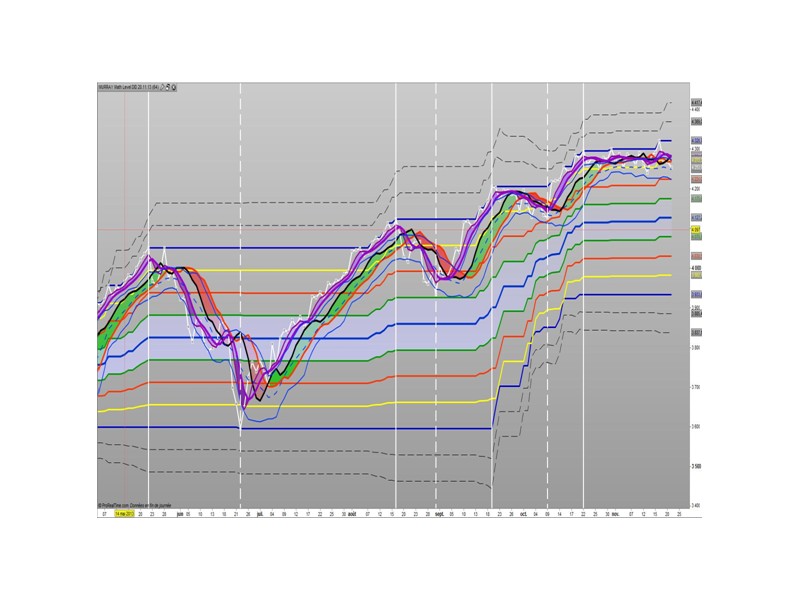
The Murrey Math lines levels are determined within some principles of Gann levels and candlesticks formations. The Murrey Math levels act pretty much like pivot and support/resistance areas.
1. Line 8/8 – 0/8 (Ultimate Support and Ultimate Resistance).
Those lines are the most strong concerning Support and resistance.
2. Line 7/8 (Weak, Place to Stop and Reverse).
This line is weak. If suddenly the price was going too fast and too far and stops around this line it means the price will reverse down very soon. If the price did not stop near this line this price will continue the movement to the line 8/8.
3. Line 1/8 (Weak, Place to Stop and Reverse).
This line is weak. If suddenly the price was going too fast and too far and stops around this line it means the price will reverse up very soon. If the price did not stop near this line this price will continue the movement down to the line 0/8.
4. Line 2/8 and 6/8 (Pivot, Reverse)
Those two lines yield the line 4/8 only to the strength to reverse the price movement.
5. Line 5/8 (Top of Trading Range)
The price is spending the about 40% of the time on the movement between the lines 5/8 and 3/8. If the price is moving near line 5/8 and stopping near the line during the 10 – 12 days so it means that it is necessary to sell in this “bonus zone” (some people are doing like this) but if the price is keeping the tendency to stay above 5/8 line, so it means that the price will be above. But if the price is droping below 5/8 line it means that the price will continue falling to the next level of resistance.
6. Line 3/8 (Bottom of Trading Range).
If the price is below this line and in uptrend it means that it will be very difficult for the price to break this level. If the price broke this line during the uptrend and staying above during the 10- 12 days it means that the price will be above this line during the 40% of its time moving between this line and 5/8 line.
7. Line 4/8 (Major Support/Resistance Line).
It is the major line concerning support and resistance. This level is the better for the new sell or buy. It is the strong level of support of the price is above 4/8. It is the fine resistance line if the price is below this 4/8 line.
|
1 2 3 4 5 6 7 8 9 10 11 12 13 14 15 16 17 18 19 20 21 22 23 24 25 26 27 28 29 30 31 32 33 34 |
// Variables : p = 64 //periods of calculation // MURRAY MATH LEVELS DID 20.11.2013 h5 = h4 + ( haut - bas ) / 8 h4 = haut + ( haut - bas ) / 8 Haut = highest [ p ] ( close ) h3 = haut - ( Haut - Bas )/8 h2 = h3 - ( Haut - Bas )/8 h1 = h2 - ( Haut - Bas )/8 MP = h1 - ( Haut - Bas )/8 l1 = MP - ( Haut - Bas )/8 l2 = l1 - ( Haut - Bas )/8 l3 = l2 - ( Haut - Bas )/8 Bas = lowest [ p ]( close ) l4 = bas - (haut - bas ) /8 l5 = l4 - ( haut - Bas ) /8 cc = customclose Return l5 as " L5 " , l4 as " L4 " , Bas as " Bas " , l3 as " L3 " , l2 as " L2 ", l1 as " L1 " , MP as " MP " , h1 as " H1 " , h2 as " H2 " , h3 as " H3 " , Haut as " Haut " , h4 as " H4 " , h5 as " H5 " , cc as " customclose " |
Share this
No information on this site is investment advice or a solicitation to buy or sell any financial instrument. Past performance is not indicative of future results. Trading may expose you to risk of loss greater than your deposits and is only suitable for experienced investors who have sufficient financial means to bear such risk.
ProRealTime ITF files and other attachments :PRC is also on YouTube, subscribe to our channel for exclusive content and tutorials

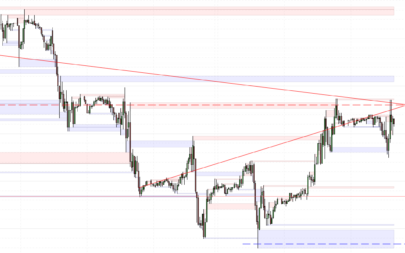




Hello, Do you think it is possible to code something similar to the example in the following link?
https://www.fxstreet.com/analysis/murray-math-analysis-gbp-usd-eur-cad-201707211405
Why HAUT and BAS have been calculated AFTER line 8?
Shouldn’t they be calculated BEFORE line 6?