

Multi Deviation Scaled Moving Average (Multi-DSMA)
1) What is the Multi-DSMA?
The Multi Deviation Scaled Moving Average (by ChartPrime) is an adaptive moving average that stacks eight Deviation-Scaled MAs (DSMAs) with progressively longer lookbacks. Each DSMA self-adjusts to current market activity via RMS scaling, then all eight are averaged into a single line. A score gauges how many fast layers are above the slowest layer, driving dynamic color/opacity and generating early/late crossover signals.
Use it when you need a trend-aware line that reacts quickly in acceleration phases but remains calm in choppy markets.
2) How it Works — The Short Version
Pipeline per bar:
-
Super Smoother prefilter → noise reduction with low lag.
-
RMS scaling (via exponential average) → dimensionless, volatility-aware signal.
-
Adaptive alpha → bigger |signal| ⇒ faster DSMA; clamped to avoid overshoot.
-
Eight DSMA layers → periods =
Periods + k×step(k = 0..7). -
Average of 8 layers → final “Multi DSMA Avg” line.
-
Score (0–1) → fraction of fast layers above the slowest layer.
-
Color/Opacity from score + Signals at 0.30/0.70 crossovers.
3) Core Mechanics
3.1 Super Smoother (per layer)
Each layer takes a zero-mean input (close - close[2]) and runs it through a 2-pole Super Smoother (Ehlers-style) using period-dependent coefficients. This removes high-frequency noise without the lag typical of simple MAs.
3.2 RMS Normalization
rms = sqrt(ExponentialAverage(period)(filt^2))
Dividing the filtered signal by its RMS (scaledFilt) makes the amplitude comparable across regimes (quiet vs. volatile), so the adaption depends on structure, not raw volatility.
3.3 Adaptive DSMA
alpha = min( |scaledFilt| * 5 / period , 1 )DSMA = alpha * close + (1 - alpha) * DSMA[1]
When structure builds (|scaled| ↑), alpha increases and the DSMA hugs price more tightly. In calm conditions, alpha shrinks and the line smooths out.
3.4 The Eight Layers & Sensitivity Inversion
-
Base period =
Periods. -
Step =
max(100 - Sensitivity, 1)→ higher Sensitivity ⇒ smaller step ⇒ layers are closer together ⇒ more responsiveness. -
Layer periods:
Periods, Periods+step, ..., Periods+7×step.
3.5 Multi-Layer Average
The plotted line “Multi DSMA Avg” is the simple average of the 8 DSMA values. This blend keeps the agility of fast layers while anchoring to the slower context.
3.6 Score Construction (0–1)
Compare each of the seven fast layers to the slowest (DSMA8). Each fast-above-slow adds ≈ 1/7.
-
Score ≈ 1 → strong bullish stack (broad alignment).
-
Score ≈ 0 → strong bearish stack.
-
Middle → mixed/transition.
3.7 Dynamic Color & Opacity
-
If score > 0.5: gradient fades in towards the upper color (bullish).
-
If score ≤ 0.5: gradient fades out from the down color (bearish).
Opacity follows the same logic: conviction (stack agreement) literally shows up as a more opaque line.
3.8 Signals (Hysteresis Band)
-
Bullish signal when score crosses up 0.30 → early heads-up.
-
Bearish signal when score crosses down 0.70 → late confirmation.
This asymmetric band reduces flip-flops by asking for more evidence before flipping bearish.
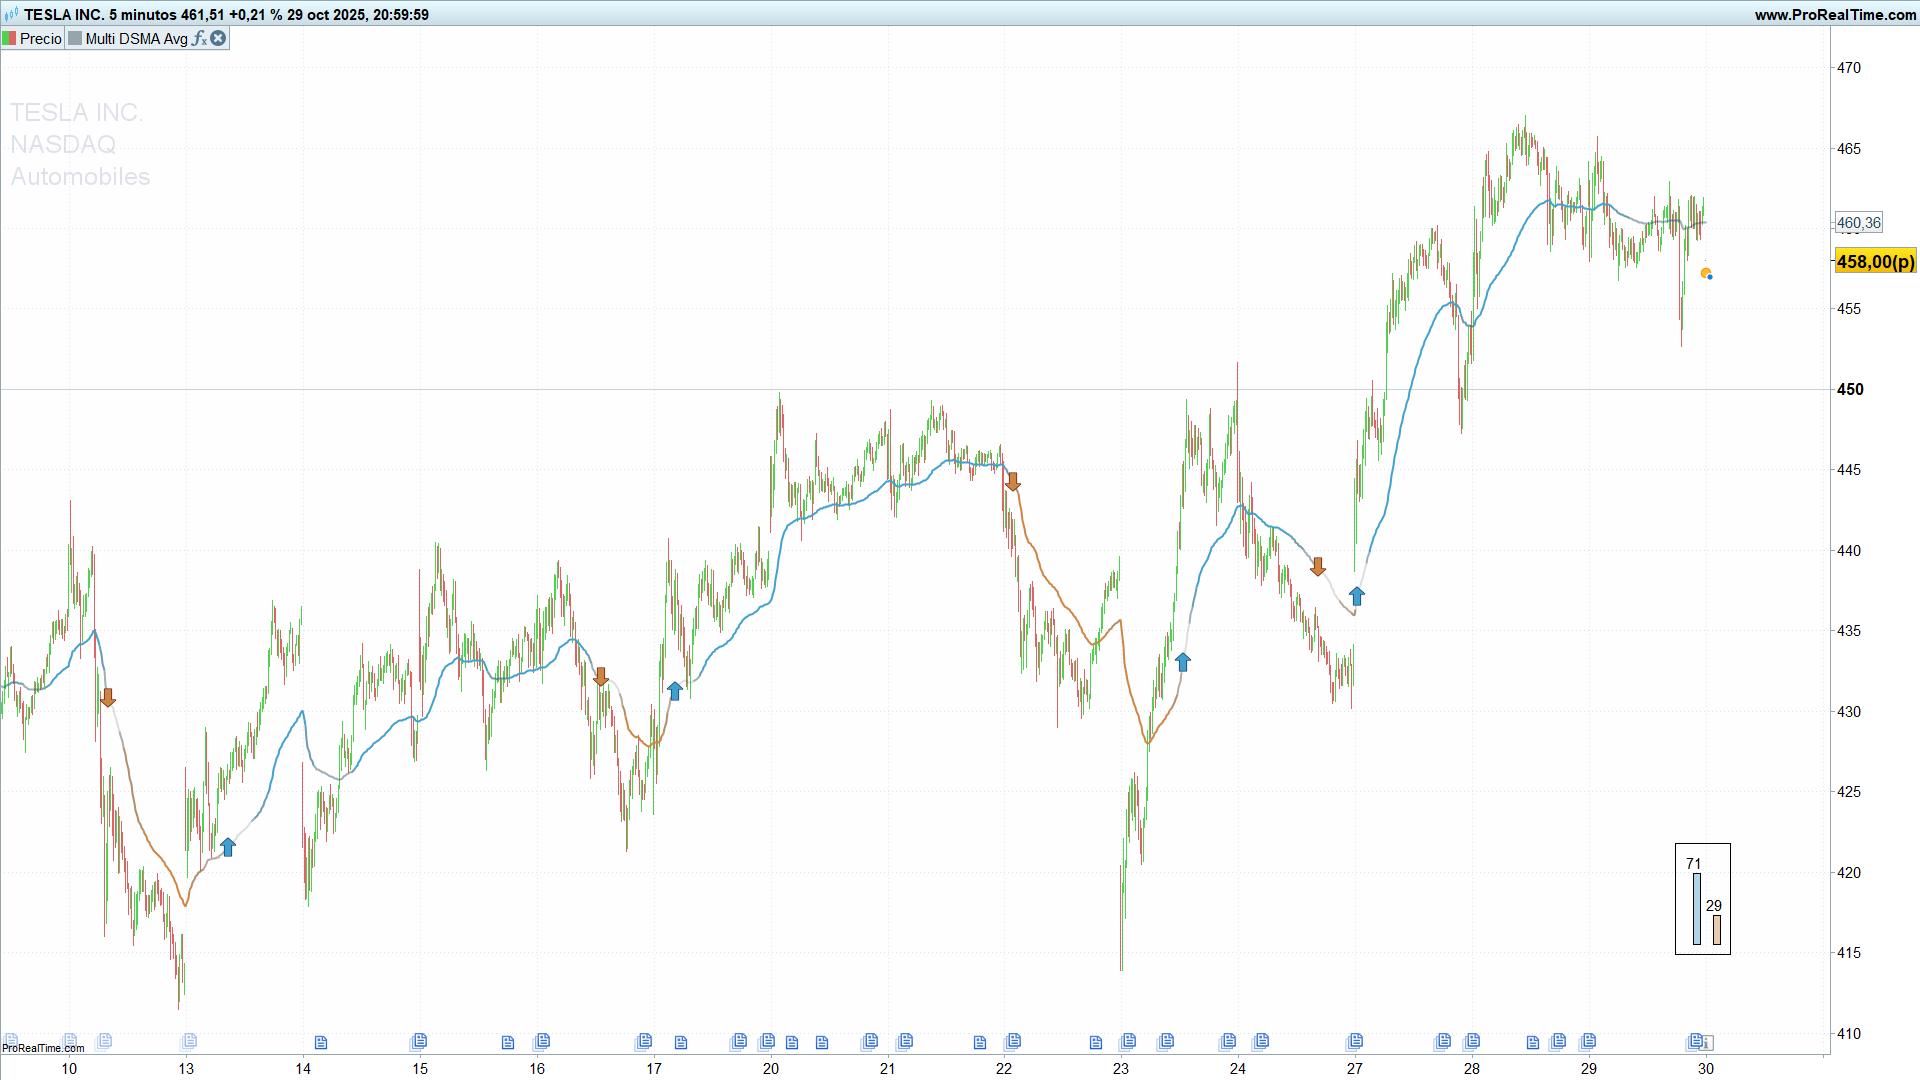
4) How to Read It on the Chart
-
Line direction: trend bias of the blended stack.
-
Color & opacity: confidence. Deeper/denser = stronger alignment.
-
Arrows:
-
▲ at the Multi DSMA Avg when score crosses above 0.30.
-
▼ at the Multi DSMA Avg when score crosses below 0.70.
-
-
On-chart panel (last bar): two vertical bars show Up% vs Down% (score×100 vs 100–score×100), updated on the most recent update.
Tip: The score panel uses anchored drawing near the bottom-right of the chart. If you customize positions, keep the
anchor(bottomright, xshift, yshift)logic consistent.
5) Typical Uses
A) Trend Confirmation / Bias Filter
-
Trade only long when score > 0.5 and line slopes up; short when < 0.5 and slope down.
-
Use arrows as timing aids, not stand-alone entries.
B) Momentum Entries
-
Aggressive: act on the ▲ (0.30 cross up) if the line is already turning up and price pulls back to or slightly below the line.
-
Conservative: wait for price to reclaim the line and the score to sustain > 0.6 for several bars.
C) Exits / Risk Control
-
Partial exit when score slips below 0.7 from high levels (momentum fading).
-
Hard exit on ▼ (0.70 cross down) and line turning flat/down.
D) Multi-Timeframe
-
Use higher timeframe score as bias; execute with lower timeframe ▲/▼ around the Multi DSMA Avg.
This indicator is non-repainting (no future data; all calculations use current and past bars).
6) Inputs & Configuration
Periods (default 30)
-
Sets the base lookback.
-
Lower (e.g., 14–25): faster, more responsive, more signals.
-
Higher (e.g., 40–80): smoother trend backbone, fewer signals.
Sensitivity (default 60, range 0–100)
-
Controls step via
step = max(100 - Sensitivity, 1). -
Higher Sensitivity ⇒ smaller step ⇒ layers cluster ⇒ more agility.
-
Lower Sensitivity ⇒ larger step ⇒ wider spread ⇒ stronger “stack” requirement.
Recommended starting points:
-
Scalping:
Periods 20–30,Sensitivity 70–85 -
Swing:
Periods 30–50,Sensitivity 55–70 -
Position:
Periods 50–80,Sensitivity 40–60
Colors (RGB triplets)
-
Upper color for bullish gradients, Down color for bearish.
-
You can soften opacity extremes by lowering the alpha scaling, but the default provides a clear conviction cue.
7) ProBuilder Code
//----------------------------------------------------
//PRC_Multi Deviation Scaled Moving Average by ChartPrime
//version = 0
//28.10.2025
//Iván González @ www.prorealcode.com
//Sharing ProRealTime knowledge
//----------------------------------------------------
// USER INPUTS
//----------------------------------------------------
Periods = 30 // Period (Default: 30)
Sensitivity = 60 // Sensitivity (0-100), Higher = More Sensitive (Default: 60)
// Visualization Colors (RGB)
upperColorR = 65
upperColorG = 161
upperColorB = 206
downColorR = 206
downColorG = 133
downColorB = 65
//----------------------------------------------------
// INDICATOR CALCULATIONS
//----------------------------------------------------
// --- DSMA Calculation Setup ---
// Invert sensitivity and ensure step is at least 1
step = 100 - Sensitivity
IF step < 1 THEN
step = 1
ENDIF
//----------------------------------------------------
pi = 3.1415926535897932
g = SQRT(2)
ONCE filt1 = 0
ONCE filt2 = 0
ONCE filt3 = 0
ONCE filt4 = 0
ONCE filt5 = 0
ONCE filt6 = 0
ONCE filt7 = 0
ONCE filt8 = 0
ONCE dsmaVal1 = typicalprice
ONCE dsmaVal2 = typicalprice
ONCE dsmaVal3 = typicalprice
ONCE dsmaVal4 = typicalprice
ONCE dsmaVal5 = typicalprice
ONCE dsmaVal6 = typicalprice
ONCE dsmaVal7 = typicalprice
ONCE dsmaVal8 = typicalprice
//----------------------------------------------------
// --- Calculate DSMA 1 ---
if barindex > periods then
// Smooth with a Super Smoother
currentPeriods = Periods
s = 2 * pi / currentPeriods
a1 = EXP(-g * pi / (0.5 * currentPeriods))
b1 = 2 * a1 * COS((g * s / (0.5 * currentPeriods)) * 180 / pi)
c2 = b1
c3 = -a1 * a1
c1 = 1 - c2 - c3
zeros = close - close[2]
filt1 = c1 * (zeros + zeros[1]) / 2 + c2 * filt1[1] + c3 * filt1[2]
rms1 = SQRT(ExponentialAverage[currentPeriods](SQUARE(filt1)))
IF rms1 <> 0 THEN
scaledFilt1 = filt1 / rms1
ELSE
scaledFilt1 = 0
ENDIF
alpha1 = ABS(scaledFilt1) * 5 / currentPeriods
IF alpha1 > 1 THEN // Clamp alpha
alpha1 = 1
ENDIF
dsmaVal1 = alpha1 * close + (1 - alpha1) * dsmaVal1[1]
endif
//----------------------------------------------------
// --- Calculate DSMA 2 ---
if barindex>Periods + step then
currentPeriods = Periods + step
s = 2 * pi / currentPeriods
a1 = EXP(-g * pi / (0.5 * currentPeriods))
b1 = 2 * a1 * COS((g * s / (0.5 * currentPeriods)) * 180 / pi)
c2 = b1
c3 = -a1 * a1
c1 = 1 - c2 - c3
zeros = close - close[2]
filt2 = c1 * (zeros + zeros[1]) / 2 + c2 * filt2[1] + c3 * filt2[2]
rms2 = SQRT(ExponentialAverage[currentPeriods](SQUARE(filt2)))
IF rms2 <> 0 THEN
scaledFilt2 = filt2 / rms2
ELSE
scaledFilt2 = 0
ENDIF
alpha2 = ABS(scaledFilt2) * 5 / currentPeriods
IF alpha2 > 1 THEN // Clamp alpha
alpha2 = 1
ENDIF
dsmaVal2 = alpha2 * close + (1 - alpha2) * dsmaVal2[1]
endif
//----------------------------------------------------
// --- Calculate DSMA 3 ---
if barindex > Periods + 2 * step then
currentPeriods = Periods + 2 * step
s = 2 * pi / currentPeriods
a1 = EXP(-g * pi / (0.5 * currentPeriods))
b1 = 2 * a1 * COS((g * s / (0.5 * currentPeriods)) * 180 / pi)
c2 = b1
c3 = -a1 * a1
c1 = 1 - c2 - c3
zeros = close - close[2]
filt3 = c1 * (zeros + zeros[1]) / 2 + c2 * filt3[1] + c3 * filt3[2]
rms3 = SQRT(ExponentialAverage[currentPeriods](SQUARE(filt3)))
IF rms3 <> 0 THEN
scaledFilt3 = filt3 / rms3
ELSE
scaledFilt3 = 0
ENDIF
alpha3 = ABS(scaledFilt3) * 5 / currentPeriods
IF alpha3 > 1 THEN // Clamp alpha
alpha3 = 1
ENDIF
dsmaVal3 = alpha3 * close + (1 - alpha3) * dsmaVal3[1]
endif
//----------------------------------------------------
// --- Calculate DSMA 4 ---
if barindex>Periods + 3 * step then
currentPeriods = Periods + 3 * step
s = 2 * pi / currentPeriods
a1 = EXP(-g * pi / (0.5 * currentPeriods))
b1 = 2 * a1 * COS((g * s / (0.5 * currentPeriods)) * 180 / pi)
c2 = b1
c3 = -a1 * a1
c1 = 1 - c2 - c3
zeros = close - close[2]
filt4 = c1 * (zeros + zeros[1]) / 2 + c2 * filt4[1] + c3 * filt4[2]
rms4 = SQRT(ExponentialAverage[currentPeriods](SQUARE(filt4)))
IF rms4 <> 0 THEN
scaledFilt4 = filt4 / rms4
ELSE
scaledFilt4 = 0
ENDIF
alpha4 = ABS(scaledFilt4) * 5 / currentPeriods
IF alpha4 > 1 THEN // Clamp alpha
alpha4 = 1
ENDIF
dsmaVal4 = alpha4 * close + (1 - alpha4) * dsmaVal4[1]
endif
//----------------------------------------------------
// --- Calculate DSMA 5 ---
if barindex>Periods + 4 * step then
currentPeriods = Periods + 4 * step
s = 2 * pi / currentPeriods
a1 = EXP(-g * pi / (0.5 * currentPeriods))
b1 = 2 * a1 * COS((g * s / (0.5 * currentPeriods)) * 180 / pi)
c2 = b1
c3 = -a1 * a1
c1 = 1 - c2 - c3
zeros = close - close[2]
filt5 = c1 * (zeros + zeros[1]) / 2 + c2 * filt5[1] + c3 * filt5[2]
rms5 = SQRT(ExponentialAverage[currentPeriods](SQUARE(filt5)))
IF rms5 <> 0 THEN
scaledFilt5 = filt5 / rms5
ELSE
scaledFilt5 = 0
ENDIF
alpha5 = ABS(scaledFilt5) * 5 / currentPeriods
IF alpha5 > 1 THEN // Clamp alpha
alpha5 = 1
ENDIF
dsmaVal5 = alpha5 * close + (1 - alpha5) * dsmaVal5[1]
endif
//----------------------------------------------------
// --- Calculate DSMA 6 ---
if barindex>Periods+5*step then
currentPeriods = Periods + 5 * step
s = 2 * pi / currentPeriods
a1 = EXP(-g * pi / (0.5 * currentPeriods))
b1 = 2 * a1 * COS((g * s / (0.5 * currentPeriods)) * 180 / pi)
c2 = b1
c3 = -a1 * a1
c1 = 1 - c2 - c3
zeros = close - close[2]
filt6 = c1 * (zeros + zeros[1]) / 2 + c2 * filt6[1] + c3 * filt6[2]
rms6 = SQRT(ExponentialAverage[currentPeriods](SQUARE(filt6)))
IF rms6 <> 0 THEN
scaledFilt6 = filt6 / rms6
ELSE
scaledFilt6 = 0
ENDIF
alpha6 = ABS(scaledFilt6) * 5 / currentPeriods
IF alpha6 > 1 THEN // Clamp alpha
alpha6 = 1
ENDIF
dsmaVal6 = alpha6 * close + (1 - alpha6) * dsmaVal6[1]
endif
//----------------------------------------------------
// --- Calculate DSMA 7 ---
if barindex>periods+6*step then
currentPeriods = Periods + 6 * step
s = 2 * pi / currentPeriods
a1 = EXP(-g * pi / (0.5 * currentPeriods))
b1 = 2 * a1 * COS((g * s / (0.5 * currentPeriods)) * 180 / pi)
c2 = b1
c3 = -a1 * a1
c1 = 1 - c2 - c3
zeros = close - close[2]
filt7 = c1 * (zeros + zeros[1]) / 2 + c2 * filt7[1] + c3 * filt7[2]
rms7 = SQRT(ExponentialAverage[currentPeriods](SQUARE(filt7)))
IF rms7 <> 0 THEN
scaledFilt7 = filt7 / rms7
ELSE
scaledFilt7 = 0
ENDIF
alpha7 = ABS(scaledFilt7) * 5 / currentPeriods
IF alpha7 > 1 THEN // Clamp alpha
alpha7 = 1
ENDIF
dsmaVal7 = alpha7 * close + (1 - alpha7) * dsmaVal7[1]
endif
//----------------------------------------------------
// --- Calculate DSMA 8 ---
if barindex>periods+7*step then
currentPeriods = Periods + 7 * step
s = 2 * pi / currentPeriods
a1 = EXP(-g * pi / (0.5 * currentPeriods))
b1 = 2 * a1 * COS((g * s / (0.5 * currentPeriods)) * 180 / pi)
c2 = b1
c3 = -a1 * a1
c1 = 1 - c2 - c3
zeros = close - close[2]
filt8 = c1 * (zeros + zeros[1]) / 2 + c2 * filt8[1] + c3 * filt8[2]
rms8 = SQRT(ExponentialAverage[currentPeriods](SQUARE(filt8)))
IF rms8 <> 0 THEN
scaledFilt8 = filt8 / rms8
ELSE
scaledFilt8 = 0
ENDIF
alpha8 = ABS(scaledFilt8) * 5 / currentPeriods
IF alpha8 > 1 THEN // Clamp alpha
alpha8 = 1
ENDIF
dsmaVal8 = alpha8 * close + (1 - alpha8) * dsmaVal8[1]
endif
//----------------------------------------------------
// --- Calculate Average DSMA ---
//----------------------------------------------------
ma = (dsmaVal1 + dsmaVal2 + dsmaVal3 + dsmaVal4 + dsmaVal5 + dsmaVal6 + dsmaVal7 + dsmaVal8) / 8
//----------------------------------------------------
// --- Calculate Score ---
//----------------------------------------------------
score = 0
val = 0.14285714 // Approximately 1/7
IF dsmaVal1 > dsmaVal8 THEN
score = score + val
ENDIF
IF dsmaVal2 > dsmaVal8 THEN
score = score + val
ENDIF
IF dsmaVal3 > dsmaVal8 THEN
score = score + val
ENDIF
IF dsmaVal4 > dsmaVal8 THEN
score = score + val
ENDIF
IF dsmaVal5 > dsmaVal8 THEN
score = score + val
ENDIF
IF dsmaVal6 > dsmaVal8 THEN
score = score + val
ENDIF
IF dsmaVal7 > dsmaVal8 THEN
score = score + val
ENDIF
// Ensure score is within 0-1 range (can slightly exceed due to float precision)
IF score > 1 THEN
score = 1
ELSIF score < 0 THEN
score = 0
ENDIF
// --- Determine Color based on Score (Manual Gradient) ---
// If score > 0.5, gradient from transparent (at 0.5) to upperColor (at 1)
// If score <= 0.5, gradient from downColor (at 0) to transparent (at 0.5)
colorR = 0
colorG = 0
colorB = 0
alpha = 255 // Opacity
IF score > 0.5 THEN
// Scale score from 0 (at 0.5) to 1 (at 1.0)
gradientFactor = (score - 0.5) * 2
colorR = Round(upperColorR * gradientFactor)
colorG = Round(upperColorG * gradientFactor)
colorB = Round(upperColorB * gradientFactor)
alpha = Round(255 * gradientFactor) // Fade in
ELSE
// Scale score from 0 (at 0.0) to 1 (at 0.5)
gradientFactor = score * 2
colorR = Round(downColorR * (1 - gradientFactor)) // Color fades out
colorG = Round(downColorG * (1 - gradientFactor))
colorB = Round(downColorB * (1 - gradientFactor))
alpha = Round(255 * (1- gradientFactor)) // Fade out
ENDIF
// Clamp color values just in case
IF colorR < 0 THEN
colorR = 0
ELSIF colorR > 255 THEN
colorR = 255
ENDIF
IF colorG < 0 THEN
colorG = 0
ELSIF colorG > 255 THEN
colorG = 255
ENDIF
IF colorB < 0 THEN
colorB = 0
ELSIF colorB > 255 THEN
colorB = 255
ENDIF
IF alpha < 0 THEN
alpha = 0
ELSIF alpha > 255 THEN
alpha = 255
ENDIF
// --- Detect Crossovers for Signal Generation ---
crossUp = (score CROSSES OVER 0.3)
crossDn = (score CROSSES UNDER 0.7)

//----------------------------------------------------
// VISUALIZATION
//----------------------------------------------------
// --- Plot Signals using Arrows ---
IF crossUp THEN
DRAWARROWUP(barindex, ma) COLOURED(upperColorR, upperColorG, upperColorB)
ENDIF

IF crossDn THEN
DRAWARROWDOWN(barindex, ma) COLOURED(downColorR, downColorG, downColorB)
ENDIF

// --- Plot the score ---
if islastbarupdate then
upPercent=round(score*100,0)
dnPercent=100-upPercent
drawrectangle(-130,110,-137,110+upPercent)anchor(bottomright,xshift,yshift)fillcolor(upperColorR, upperColorG, upperColorB, alpha)
drawtext("#upPercent#",-134,120+upPercent)anchor(bottomright,xshift,yshift)
drawrectangle(-110,110,-117,110+dnPercent)anchor(bottomright,xshift,yshift)fillcolor(downColorR, downColorG, downColorB, alpha)
drawtext("#dnPercent#",-114,120+dnPercent)anchor(bottomright,xshift,yshift)
drawrectangle(-155,100,-100,max(120+dnPercent,120+uppercent)+20)anchor(bottomright,xshift,yshift)
endif
//----------------------------------------------------
RETURN ma COLOURED(colorR, colorG, colorB, alpha) AS "Multi DSMA Avg" STYLE(Line, 2) // Style 2 for slightly thicker line
