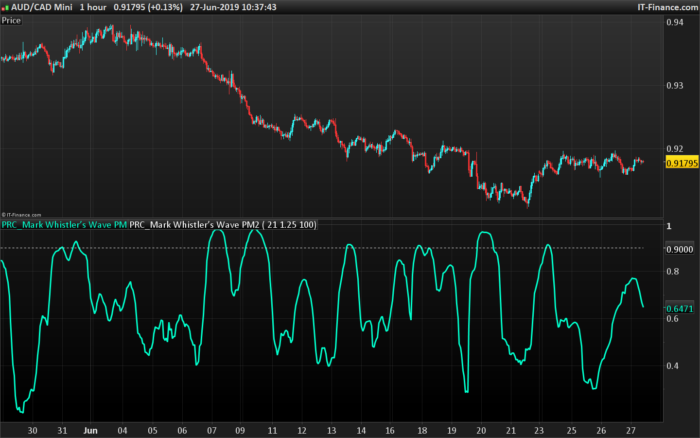
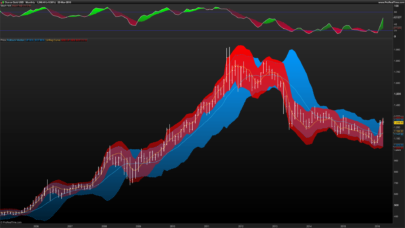
The Wave PM (Whistler Active Volatility Energy Price Mass) indicator is an oscillator described in the Mark Whistler’s book “Volatility Illuminated”.
The Wave PM was specifically designed to help read cycles of volatility. Read when a strong trend is about to start and end, along with the potential duration of lateral chop. By using concepts of probability and volatility, which anyone can understand, retail traders can learn to think about “risk” more like an institutional trader… With WAVE PM and an understanding of institutional risk-based trading, at home traders are able to start seeing volatility as opportunity, not an “out of the blue” hindrance.
Price Mass is not a directional oscillator it’s more of a gauge of potential energy left in the distribution cycle from Mark Whistler’s book “Volatility Illuminated”
Discussion about the indicator and other concept derivated took place here.
|
1 2 3 4 5 6 7 8 9 10 11 12 13 14 15 16 17 18 19 20 21 22 23 24 25 26 27 28 29 30 31 32 33 |
//PRC_Mark Whistler’s Wave PM | indicator //27.06.2019 //Nicolas @ www.prorealcode.com //Sharing ProRealTime knowledge // --- settings BandsPeriod=14 BandsDeviation=1.25 Chars= 100 // --- end of settings if barindex>max(Chars,BandsPeriod) then Dev = std[BandsPeriod]*BandsDeviation Dev1 = square(Dev / Pointsize) temp=sqrt(average[chars](dev1))*pointsize if temp<>0 then temp=dev/temp endif if(temp>0) then iexp=Exp(-2*temp) returnNum= (1-iexp)/(1+iexp) osc= (returnNum) else iexp=Exp(2*temp) returnNum=(iexp-1)/(1+iexp) osc= (returnNum) endif endif return osc, 0.9 style(dottedline,1) |
Share this
No information on this site is investment advice or a solicitation to buy or sell any financial instrument. Past performance is not indicative of future results. Trading may expose you to risk of loss greater than your deposits and is only suitable for experienced investors who have sufficient financial means to bear such risk.
ProRealTime ITF files and other attachments :
Find other exclusive trading pro-tools on ![]()
PRC is also on YouTube, subscribe to our channel for exclusive content and tutorials


Hi Nicolas, thanks a lot for coding this interesting looking indicator.
I read: https://www.tradingview.com/chart/BTCUSD/6SIl2X3f-The-Holy-Grail-of-Trading-Advanced-Volatility-Theory
and wondered why is 1.25 std deviations the “fulcrum” between the compression and expansion of the distribution? Or as the author puts it: 1.25 std devs is “the pivot point for the expansion and compression of the ENTIRE distribution for that period.”?
Cheers for any insights!
I’ve also just noticed that changing the “Bands Deviation” setting from 1.25 to eg 3 doesn’t change the indicator at all?
Hi @Nicolas,
Really impressed by your work.
I am trying to replicate the Wave-PM indicator that you coded. Would you mind answering some question? Would really appreciate it.
You don’t have to replicate it, download the file and import it into your platform.