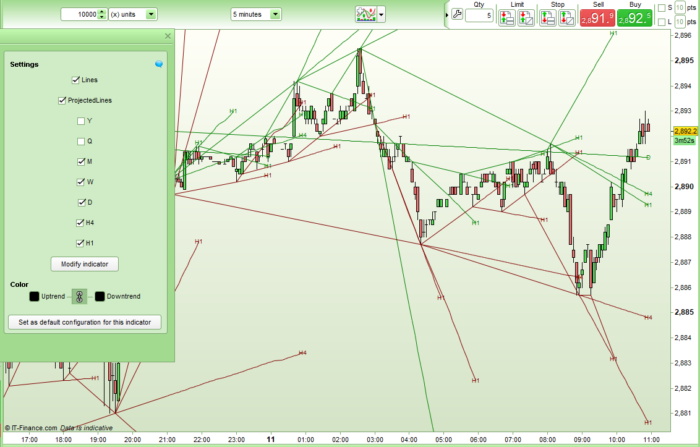
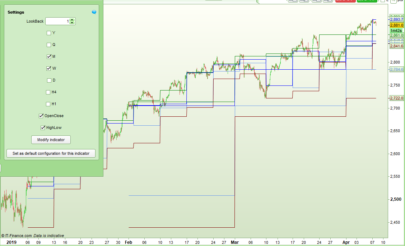
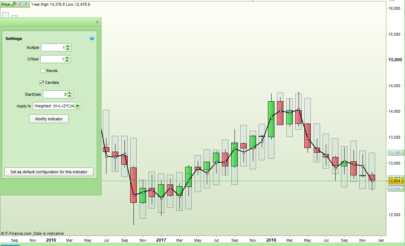
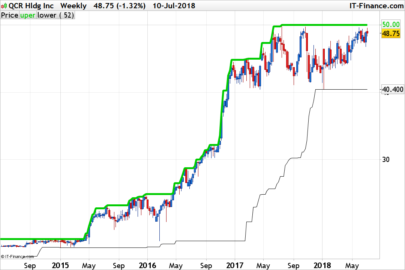
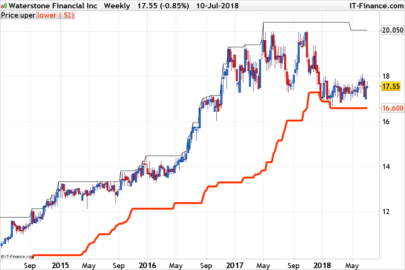
At the start of a new period this indicator draws lines connecting the previous two periods highest highs and previous two lowest lows. It then projects these lines forward throughout the latest period.
It can find the last two yearly, quarterly, monthly, weekly, daily, 4 hourly and 1 hourly highest highs and lowest lows and draw lines connecting them and projected forward until the start of a new year, quarter, month, week, day, 4 hour period, 1 hour period when new lines are drawn.
You can turn on or off the lines connecting the highs and lows and also turn off the projected lines using the settings ‘Lines’ and ProjectedLines’.
The indicator can be used on any time frame chart but if there is not enough data to provide two HH or two LL then it won’t draw any lines for that time period. You can only draw slower time frame lines on a faster time frame chart so for example you obviously cannot draw H1 lines a daily chart
For daily calculations Sunday candles are included in Fridays data so the projected lines on a Monday are from the Thursday daily HH and daily LL and the daily HH and daily LL of Friday and Sunday combined. Weeks start at the open of the Sunday candle.
Each line is labelled at its end. If projected lines are shown then the label is at the end of the projected line if not then it is at the end of the line connecting HH’s and LL’s. Because it is not possible to draw something and then delete it there are no labels on the last projected lines shown on the chart. To overcome this issue you can add my other ‘Last Two Highest High and Lowest Low as Horizontal Lines – Yearly Quarterly, Monthly, Weekly, Daily, 4 Hour and 1 Hour’ indicator to your price chart and turn off the values and lines in that indicator. This will give you up to date labels.
The projected lines can go a little wobbly on very fast time frames which I assume is due to missing candles messing up the barindex value used in the projection calculations.
Apply only to the price chart
The lines can be used as support and resistance or for breakout trading – however you wish.
It will be slow to draw if you want every line drawn on a lot of historical bars.
I suggest downloading and importing the indicator to get full functionality.
|
1 2 3 4 5 6 7 8 9 10 11 12 13 14 15 16 17 18 19 20 21 22 23 24 25 26 27 28 29 30 31 32 33 34 35 36 37 38 39 40 41 42 43 44 45 46 47 48 49 50 51 52 53 54 55 56 57 58 59 60 61 62 63 64 65 66 67 68 69 70 71 72 73 74 75 76 77 78 79 80 81 82 83 84 85 86 87 88 89 90 91 92 93 94 95 96 97 98 99 100 101 102 103 104 105 106 107 108 109 110 111 112 113 114 115 116 117 118 119 120 121 122 123 124 125 126 127 128 129 130 131 132 133 134 135 136 137 138 139 140 141 142 143 144 145 146 147 148 149 150 151 152 153 154 155 156 157 158 159 160 161 162 163 164 165 166 167 168 169 170 171 172 173 174 175 176 177 178 179 180 181 182 183 184 185 186 187 188 189 190 191 192 193 194 195 196 197 198 199 200 201 202 203 204 205 206 207 208 209 210 211 212 213 214 215 216 217 218 219 220 221 222 223 224 225 226 227 228 229 230 231 232 233 234 235 236 237 238 239 240 241 242 243 244 245 246 247 248 249 250 251 252 253 254 255 256 257 258 259 260 261 262 263 264 265 266 267 268 269 270 271 272 273 274 275 276 277 278 279 280 281 282 283 284 285 286 287 288 289 290 291 292 293 294 295 296 297 298 299 300 301 302 303 304 305 306 307 308 309 310 311 312 313 314 315 316 317 318 319 320 321 322 323 324 325 326 327 328 329 330 331 332 333 334 335 336 337 338 339 340 341 342 343 344 345 346 347 348 349 350 351 352 353 354 355 356 357 358 359 360 361 362 363 364 365 366 367 368 369 370 371 372 373 374 375 376 377 378 379 380 381 382 383 384 385 386 387 388 389 390 391 392 393 394 395 396 397 398 399 400 401 402 403 404 405 406 407 408 409 410 411 412 413 414 415 416 417 418 419 420 421 422 423 424 425 426 427 428 429 430 431 432 433 434 435 436 437 438 439 440 441 442 443 444 445 446 447 448 449 450 451 452 453 454 455 456 457 458 459 460 461 462 463 464 465 466 467 468 469 470 471 472 473 474 475 476 477 478 479 480 481 482 483 484 485 486 487 488 489 490 491 492 493 494 495 496 497 498 499 500 501 502 503 504 505 506 507 508 509 510 511 512 513 514 515 516 517 518 519 520 521 522 523 524 525 526 527 528 529 530 531 532 533 534 535 536 537 538 539 540 541 542 543 544 545 546 547 548 549 550 551 552 553 554 555 556 557 558 559 560 561 562 563 564 565 566 567 568 569 570 571 572 573 574 575 576 577 578 579 580 581 582 583 584 585 586 587 588 589 590 591 592 593 594 595 596 597 598 599 600 601 602 603 604 605 606 607 608 609 610 611 612 613 614 615 616 617 618 619 620 621 622 623 624 625 626 627 628 629 630 631 632 633 634 635 636 637 638 639 640 641 642 643 644 645 646 647 648 649 650 651 652 653 654 655 656 657 658 659 660 661 662 663 664 665 666 667 668 669 670 671 672 673 674 675 676 677 678 679 680 681 682 683 684 685 686 687 688 689 690 691 692 693 694 695 696 697 698 699 700 701 702 703 704 705 706 707 708 709 710 711 712 713 714 715 716 717 718 719 720 721 722 723 724 725 726 727 728 729 730 731 732 733 734 735 736 737 738 739 740 741 742 743 744 745 746 747 748 749 750 751 752 753 754 755 756 757 758 759 760 761 762 763 764 765 766 767 768 769 770 771 772 773 774 775 776 777 778 |
//Last Two HH LL Lines //Coded by Vonasi //Date 20190411 //Lines = 1 //ProjectedLines = 1 //Y = 0 //Q = 0 //M = 0 //W = 0 //D = 0 //H4 = 0 //H1 = 0 //Year if y then once yhi1 = low once yhi2 = low once yhiindex1 = barindex once yhiindex2 = barindex once ylo1 = high once ylo2 = high once yloindex1 = barindex once yloindex2 = barindex if high >= yhi1 then yhi1 = high yhiindex1 = barindex endif if low <= ylo1 then ylo1 = low yloindex1 = barindex endif if openyear <> openyear[1] then if projectedlines then DRAWTEXT("Y", barindex-1, yhiend[2], SansSerif, standard, 10) coloured(0,128,0) DRAWTEXT("Y", barindex-1, yloend[2], SansSerif, standard, 10) coloured(128,0,0) endif if lines then drawsegment(yloindex2,ylo2,yloindex1,ylo1) coloured(128,0,0) drawsegment(yhiindex2,yhi2,yhiindex1,yhi1) coloured(0,128,0) if not projectedlines then DRAWTEXT("Y", yhiindex1, yhi1, SansSerif, standard, 10) coloured(0,128,0) DRAWTEXT("Y", yloindex1, ylo1, SansSerif, standard, 10) coloured(128,0,0) endif endif yhistart = yhi1 yhistartindex = yhiindex1 if yhi1 >= yhi2 then yhiadj = (yhi1 - yhi2) / (yhiindex1 - yhiindex2) yhiend = (yhistart + (yhiadj * (barindex - yhistartindex))) yhidir = 1 endif if yhi1 < yhi2 then yhiadj = (yhi2 - yhi1) / (yhiindex1 - yhiindex2) yhiend = (yhistart - (yhiadj * (barindex - yhistartindex))) yhidir = -1 endif ylostart = ylo1 ylostartindex = yloindex1 if ylo1 >= ylo2 then yloadj = (ylo1 - ylo2) / (yloindex1 - yloindex2) yloend = (ylostart + (yloadj * (barindex - ylostartindex))) ylodir = 1 endif if ylo1 < ylo2 then yloadj = (ylo2 - ylo1) / (yloindex1 - yloindex2) yloend = (ylostart - (yloadj * (barindex - ylostartindex))) ylodir = -1 endif yhi2 = yhi1 yhiindex2 = yhiindex1 yhi1 = low yhiindex1 = barindex ylo2 = ylo1 yloindex2 = yloindex1 ylo1 = high yhiindex1 = barindex endif if projectedlines then if yhidir = 1 then drawsegment(yhistartindex,yhistart,barindex,yhiend) coloured (0,128,0) yhistartindex = barindex yhistart = yhiend yhiend = (yhistart + (yhiadj * ((barindex+1) - yhistartindex))) endif if yhidir = -1 then drawsegment(yhistartindex,yhistart,barindex,yhiend) coloured (0,128,0) yhistartindex = barindex yhistart = yhiend yhiend = (yhistart - (yhiadj * ((barindex+1) - yhistartindex))) endif if ylodir = 1 then drawsegment(ylostartindex,ylostart,barindex,yloend) coloured (128,0,0) ylostartindex = barindex ylostart = yloend yloend = (ylostart + (yloadj * ((barindex+1) - ylostartindex))) endif if ylodir = -1 then drawsegment(ylostartindex,ylostart,barindex,yloend) coloured (128,0,0) ylostartindex = barindex ylostart = yloend yloend = (ylostart - (yloadj * ((barindex+1) - ylostartindex))) endif endif endif //Quarter if q then once qhi1 = low once qhi2 = low once qhiindex1 = barindex once qhiindex2 = barindex once qlo1 = high once qlo2 = high once qloindex1 = barindex once qloindex2 = barindex if high >= qhi1 then qhi1 = high qhiindex1 = barindex endif if low <= qlo1 then qlo1 = low qloindex1 = barindex endif if openmonth <> openmonth[1] and (openmonth = 1 or openmonth = 4 or openmonth = 7 or openmonth = 10) then if projectedlines then DRAWTEXT("Q", barindex-1, qhiend[2], SansSerif, standard, 10) coloured(0,128,0) DRAWTEXT("Q", barindex-1, qloend[2], SansSerif, standard, 10) coloured(128,0,0) endif if lines then drawsegment(qloindex2,qlo2,qloindex1,qlo1) coloured(128,0,0) drawsegment(qhiindex2,qhi2,qhiindex1,qhi1) coloured(0,128,0) if not projectedlines then DRAWTEXT("Q", qhiindex1, qhi1, SansSerif, standard, 10) coloured(0,128,0) DRAWTEXT("Q", qloindex1, qlo1, SansSerif, standard, 10) coloured(128,0,0) endif endif qhistart = qhi1 qhistartindex = qhiindex1 if qhi1 >= qhi2 then qhiadj = (qhi1 - qhi2) / (qhiindex1 - qhiindex2) qhiend = (qhistart + (qhiadj * (barindex - qhistartindex))) qhidir = 1 endif if qhi1 < qhi2 then qhiadj = (qhi2 - qhi1) / (qhiindex1 - qhiindex2) qhiend = (qhistart - (qhiadj * (barindex - qhistartindex))) qhidir = -1 endif qlostart = qlo1 qlostartindex = qloindex1 if qlo1 >= qlo2 then qloadj = (qlo1 - qlo2) / (qloindex1 - qloindex2) qloend = (qlostart + (qloadj * (barindex - qlostartindex))) qlodir = 1 endif if qlo1 < qlo2 then qloadj = (qlo2 - qlo1) / (qloindex1 - qloindex2) qloend = (qlostart - (qloadj * (barindex - qlostartindex))) qlodir = -1 endif qhi2 = qhi1 qhiindex2 = qhiindex1 qhi1 = low qhiindex1 = barindex qlo2 = qlo1 qloindex2 = qloindex1 qlo1 = high qhiindex1 = barindex endif if projectedlines then if qhidir = 1 then drawsegment(qhistartindex,qhistart,barindex,qhiend) coloured (0,128,0) qhistartindex = barindex qhistart = qhiend qhiend = (qhistart + (qhiadj * ((barindex+1) - qhistartindex))) endif if qhidir = -1 then drawsegment(qhistartindex,qhistart,barindex,qhiend) coloured (0,128,0) qhistartindex = barindex qhistart = qhiend qhiend = (qhistart - (qhiadj * ((barindex+1) - qhistartindex))) endif if qlodir = 1 then drawsegment(qlostartindex,qlostart,barindex,qloend) coloured (128,0,0) qlostartindex = barindex qlostart = qloend qloend = (qlostart + (qloadj * ((barindex+1) - qlostartindex))) endif if qlodir = -1 then drawsegment(qlostartindex,qlostart,barindex,qloend) coloured (128,0,0) qlostartindex = barindex qlostart = qloend qloend = (qlostart - (qloadj * ((barindex+1) - qlostartindex))) endif endif endif //Month if m then once mhi1 = low once mhi2 = low once mhiindex1 = barindex once mhiindex2 = barindex once mlo1 = high once mlo2 = high once mloindex1 = barindex once mloindex2 = barindex if high >= mhi1 then mhi1 = high mhiindex1 = barindex endif if low <= mlo1 then mlo1 = low mloindex1 = barindex endif if openmonth <> openmonth[1] then if projectedlines then DRAWTEXT("M", barindex-1, mhiend[2], SansSerif, standard, 10) coloured(0,128,0) DRAWTEXT("M", barindex-1, mloend[2], SansSerif, standard, 10) coloured(128,0,0) endif if lines then drawsegment(mloindex2,mlo2,mloindex1,mlo1) coloured(128,0,0) drawsegment(mhiindex2,mhi2,mhiindex1,mhi1) coloured(0,128,0) if not projectedlines then DRAWTEXT("M", mhiindex1, mhi1, SansSerif, standard, 10) coloured(0,128,0) DRAWTEXT("M", mloindex1, mlo1, SansSerif, standard, 10) coloured(128,0,0) endif endif mhistart = mhi1 mhistartindex = mhiindex1 if mhi1 >= mhi2 then mhiadj = (mhi1 - mhi2) / (mhiindex1 - mhiindex2) mhiend = (mhistart + (mhiadj * (barindex - mhistartindex))) mhidir = 1 endif if mhi1 < mhi2 then mhiadj = (mhi2 - mhi1) / (mhiindex1 - mhiindex2) mhiend = (mhistart - (mhiadj * (barindex - mhistartindex))) mhidir = -1 endif mlostart = mlo1 mlostartindex = mloindex1 if mlo1 >= mlo2 then mloadj = (mlo1 - mlo2) / (mloindex1 - mloindex2) mloend = (mlostart + (mloadj * (barindex - mlostartindex))) mlodir = 1 endif if mlo1 < mlo2 then mloadj = (mlo2 - mlo1) / (mloindex1 - mloindex2) mloend = (mlostart - (mloadj * (barindex - mlostartindex))) mlodir = -1 endif mhi2 = mhi1 mhiindex2 = mhiindex1 mhi1 = low mhiindex1 = barindex mlo2 = mlo1 mloindex2 = mloindex1 mlo1 = high mhiindex1 = barindex endif if projectedlines then if mhidir = 1 then drawsegment(mhistartindex,mhistart,barindex,mhiend) coloured (0,128,0) mhistartindex = barindex mhistart = mhiend mhiend = (mhistart + (mhiadj * ((barindex+1) - mhistartindex))) endif if mhidir = -1 then drawsegment(mhistartindex,mhistart,barindex,mhiend) coloured (0,128,0) mhistartindex = barindex mhistart = mhiend mhiend = (mhistart - (mhiadj * ((barindex+1) - mhistartindex))) endif if mlodir = 1 then drawsegment(mlostartindex,mlostart,barindex,mloend) coloured (128,0,0) mlostartindex = barindex mlostart = mloend mloend = (mlostart + (mloadj * ((barindex+1) - mlostartindex))) endif if mlodir = -1 then drawsegment(mlostartindex,mlostart,barindex,mloend) coloured (128,0,0) mlostartindex = barindex mlostart = mloend mloend = (mlostart - (mloadj * ((barindex+1) - mlostartindex))) endif endif endif //Week if w then once whi1 = low once whi2 = low once whiindex1 = barindex once whiindex2 = barindex once wlo1 = high once wlo2 = high once wloindex1 = barindex once wloindex2 = barindex if high >= whi1 then whi1 = high whiindex1 = barindex endif if low <= wlo1 then wlo1 = low wloindex1 = barindex endif if opendayofweek < opendayofweek[1] then if projectedlines then DRAWTEXT("W", barindex-1, whiend[2], SansSerif, standard, 10) coloured(0,128,0) DRAWTEXT("W", barindex-1, wloend[2], SansSerif, standard, 10) coloured(128,0,0) endif if lines then drawsegment(wloindex2,wlo2,wloindex1,wlo1) coloured(128,0,0) drawsegment(whiindex2,whi2,whiindex1,whi1) coloured(0,128,0) if not projectedlines then DRAWTEXT("W", whiindex1, whi1, SansSerif, standard, 10) coloured(0,128,0) DRAWTEXT("W", wloindex1, wlo1, SansSerif, standard, 10) coloured(128,0,0) endif endif whistart = whi1 whistartindex = whiindex1 if whi1 >= whi2 then whiadj = (whi1 - whi2) / (whiindex1 - whiindex2) whiend = (whistart + (whiadj * (barindex - whistartindex))) whidir = 1 endif if whi1 < whi2 then whiadj = (whi2 - whi1) / (whiindex1 - whiindex2) whiend = (whistart - (whiadj * (barindex - whistartindex))) whidir = -1 endif wlostart = wlo1 wlostartindex = wloindex1 if wlo1 >= wlo2 then wloadj = (wlo1 - wlo2) / (wloindex1 - wloindex2) wloend = (wlostart + (wloadj * (barindex - wlostartindex))) wlodir = 1 endif if wlo1 < wlo2 then wloadj = (wlo2 - wlo1) / (wloindex1 - wloindex2) wloend = (wlostart - (wloadj * (barindex - wlostartindex))) wlodir = -1 endif whi2 = whi1 whiindex2 = whiindex1 whi1 = low whiindex1 = barindex wlo2 = wlo1 wloindex2 = wloindex1 wlo1 = high whiindex1 = barindex endif if projectedlines then if whidir = 1 then drawsegment(whistartindex,whistart,barindex,whiend) coloured (0,128,0) whistartindex = barindex whistart = whiend whiend = (whistart + (whiadj * ((barindex+1) - whistartindex))) endif if whidir = -1 then drawsegment(whistartindex,whistart,barindex,whiend) coloured (0,128,0) whistartindex = barindex whistart = whiend whiend = (whistart - (whiadj * ((barindex+1) - whistartindex))) endif if wlodir = 1 then drawsegment(wlostartindex,wlostart,barindex,wloend) coloured (128,0,0) wlostartindex = barindex wlostart = wloend wloend = (wlostart + (wloadj * ((barindex+1) - wlostartindex))) endif if wlodir = -1 then drawsegment(wlostartindex,wlostart,barindex,wloend) coloured (128,0,0) wlostartindex = barindex wlostart = wloend wloend = (wlostart - (wloadj * ((barindex+1) - wlostartindex))) endif endif endif //Day if d then once dhi1 = low once dhi2 = low once dhiindex1 = barindex once dhiindex2 = barindex once dlo1 = high once dlo2 = high once dloindex1 = barindex once dloindex2 = barindex if high >= dhi1 then dhi1 = high dhiindex1 = barindex endif if low <= dlo1 then dlo1 = low dloindex1 = barindex endif if openday <> openday[1] and openday[1] <> 7 then if projectedlines then DRAWTEXT("D", barindex-1, dhiend[2], SansSerif, standard, 10) coloured(0,128,0) DRAWTEXT("D", barindex-1, dloend[2], SansSerif, standard, 10) coloured(128,0,0) endif if lines then drawsegment(dloindex2,dlo2,dloindex1,dlo1) coloured(128,0,0) drawsegment(dhiindex2,dhi2,dhiindex1,dhi1) coloured(0,128,0) if not projectedlines then DRAWTEXT("D", Dhiindex1, Dhi1, SansSerif, standard, 10) coloured(0,128,0) DRAWTEXT("D", Dloindex1, Dlo1, SansSerif, standard, 10) coloured(128,0,0) endif endif dhistart = dhi1 dhistartindex = dhiindex1 if dhi1 >= dhi2 then dhiadj = (dhi1 - dhi2) / (dhiindex1 - dhiindex2) dhiend = (dhistart + (dhiadj * (barindex - dhistartindex))) dhidir = 1 endif if dhi1 < dhi2 then dhiadj = (dhi2 - dhi1) / (dhiindex1 - dhiindex2) dhiend = (dhistart - (dhiadj * (barindex - dhistartindex))) dhidir = -1 endif dlostart = dlo1 dlostartindex = dloindex1 if dlo1 >= dlo2 then dloadj = (dlo1 - dlo2) / (dloindex1 - dloindex2) dloend = (dlostart + (dloadj * (barindex - dlostartindex))) dlodir = 1 endif if dlo1 < dlo2 then dloadj = (dlo2 - dlo1) / (dloindex1 - dloindex2) dloend = (dlostart - (dloadj * (barindex - dlostartindex))) dlodir = -1 endif dhi2 = dhi1 dhiindex2 = dhiindex1 dhi1 = low dhiindex1 = barindex dlo2 = dlo1 dloindex2 = dloindex1 dlo1 = high dhiindex1 = barindex endif if projectedlines then if dhidir = 1 then drawsegment(dhistartindex,dhistart,barindex,dhiend) coloured (0,128,0) dhistartindex = barindex dhistart = dhiend dhiend = (dhistart + (dhiadj * ((barindex+1) - dhistartindex))) endif if dhidir = -1 then drawsegment(dhistartindex,dhistart,barindex,dhiend) coloured (0,128,0) dhistartindex = barindex dhistart = dhiend dhiend = (dhistart - (dhiadj * ((barindex+1) - dhistartindex))) endif if dlodir = 1 then drawsegment(dlostartindex,dlostart,barindex,dloend) coloured (128,0,0) dlostartindex = barindex dlostart = dloend dloend = (dlostart + (dloadj * ((barindex+1) - dlostartindex))) endif if dlodir = -1 then drawsegment(dlostartindex,dlostart,barindex,dloend) coloured (128,0,0) dlostartindex = barindex dlostart = dloend dloend = (dlostart - (dloadj * ((barindex+1) - dlostartindex))) endif endif endif //4 Hour if h4 then once h4hi1 = low once h4hi2 = low once h4hiindex1 = barindex once h4hiindex2 = barindex once h4lo1 = high once h4lo2 = high once h4loindex1 = barindex once h4loindex2 = barindex if high >= h4hi1 then h4hi1 = high h4hiindex1 = barindex endif if low <= h4lo1 then h4lo1 = low h4loindex1 = barindex endif if openhour <> openhour[1] and (openhour = 1 or openhour = 5 or openhour = 9 or openhour = 13 or openhour = 17 or openhour = 21) then if projectedlines then DRAWTEXT("H4", barindex-1, h4hiend[2], SansSerif, standard, 10) coloured(0,128,0) DRAWTEXT("H4", barindex-1, h4loend[2], SansSerif, standard, 10) coloured(128,0,0) endif if lines then drawsegment(h4loindex2,h4lo2,h4loindex1,h4lo1) coloured(128,0,0) drawsegment(h4hiindex2,h4hi2,h4hiindex1,h4hi1) coloured(0,128,0) if not projectedlines then DRAWTEXT("H4", h4hiindex1, h4hi1, SansSerif, standard, 10) coloured(0,128,0) DRAWTEXT("H4", h4loindex1, h4lo1, SansSerif, standard, 10) coloured(128,0,0) endif endif h4histart = h4hi1 h4histartindex = h4hiindex1 if h4hi1 >= h4hi2 then h4hiadj = (h4hi1 - h4hi2) / (h4hiindex1 - h4hiindex2) h4hiend = (h4histart + (h4hiadj * (barindex - h4histartindex))) h4hidir = 1 endif if h4hi1 < h4hi2 then h4hiadj = (h4hi2 - h4hi1) / (h4hiindex1 - h4hiindex2) h4hiend = (h4histart - (h4hiadj * (barindex - h4histartindex))) h4hidir = -1 endif h4lostart = h4lo1 h4lostartindex = h4loindex1 if h4lo1 >= h4lo2 then h4loadj = (h4lo1 - h4lo2) / (h4loindex1 - h4loindex2) h4loend = (h4lostart + (h4loadj * (barindex - h4lostartindex))) h4lodir = 1 endif if h4lo1 < h4lo2 then h4loadj = (h4lo2 - h4lo1) / (h4loindex1 - h4loindex2) h4loend = (h4lostart - (h4loadj * (barindex - h4lostartindex))) h4lodir = -1 endif h4hi2 = h4hi1 h4hiindex2 = h4hiindex1 h4hi1 = low h4hiindex1 = barindex h4lo2 = h4lo1 h4loindex2 = h4loindex1 h4lo1 = high h4hiindex1 = barindex endif if projectedlines then if h4hidir = 1 then drawsegment(h4histartindex,h4histart,barindex,h4hiend) coloured (0,128,0) h4histartindex = barindex h4histart = h4hiend h4hiend = (h4histart + (h4hiadj * ((barindex+1) - h4histartindex))) endif if h4hidir = -1 then drawsegment(h4histartindex,h4histart,barindex,h4hiend) coloured (0,128,0) h4histartindex = barindex h4histart = h4hiend h4hiend = (h4histart - (h4hiadj * ((barindex+1) - h4histartindex))) endif if h4lodir = 1 then drawsegment(h4lostartindex,h4lostart,barindex,h4loend) coloured (128,0,0) h4lostartindex = barindex h4lostart = h4loend h4loend = (h4lostart + (h4loadj * ((barindex+1) - h4lostartindex))) endif if h4lodir = -1 then drawsegment(h4lostartindex,h4lostart,barindex,h4loend) coloured (128,0,0) h4lostartindex = barindex h4lostart = h4loend h4loend = (h4lostart - (h4loadj * ((barindex+1) - h4lostartindex))) endif endif endif //1 Hour if h1 then once h1hi1 = low once h1hi2 = low once h1hiindex1 = barindex once h1hiindex2 = barindex once h1lo1 = high once h1lo2 = high once h1loindex1 = barindex once h1loindex2 = barindex if high >= h1hi1 then h1hi1 = high h1hiindex1 = barindex endif if low <= h1lo1 then h1lo1 = low h1loindex1 = barindex endif if openhour <> openhour[1] then if projectedlines then DRAWTEXT("H1", barindex-1, h1hiend[2], SansSerif, standard, 10) coloured(0,128,0) DRAWTEXT("H1", barindex-1, h1loend[2], SansSerif, standard, 10) coloured(128,0,0) endif if lines then drawsegment(h1loindex2,h1lo2,h1loindex1,h1lo1) coloured(128,0,0) drawsegment(h1hiindex2,h1hi2,h1hiindex1,h1hi1) coloured(0,128,0) if not projectedlines then DRAWTEXT("H1", h1hiindex1, h1hi1, SansSerif, standard, 10) coloured(0,128,0) DRAWTEXT("H1", h1loindex1, h1lo1, SansSerif, standard, 10) coloured(128,0,0) endif endif h1histart = h1hi1 h1histartindex = h1hiindex1 if h1hi1 >= h1hi2 then h1hiadj = (h1hi1 - h1hi2) / (h1hiindex1 - h1hiindex2) h1hiend = (h1histart + (h1hiadj * (barindex - h1histartindex))) h1hidir = 1 endif if h1hi1 < h1hi2 then h1hiadj = (h1hi2 - h1hi1) / (h1hiindex1 - h1hiindex2) h1hiend = (h1histart - (h1hiadj * (barindex - h1histartindex))) h1hidir = -1 endif h1lostart = h1lo1 h1lostartindex = h1loindex1 if h1lo1 >= h1lo2 then h1loadj = (h1lo1 - h1lo2) / (h1loindex1 - h1loindex2) h1loend = (h1lostart + (h1loadj * (barindex - h1lostartindex))) h1lodir = 1 endif if h1lo1 < h1lo2 then h1loadj = (h1lo2 - h1lo1) / (h1loindex1 - h1loindex2) h1loend = (h1lostart - (h1loadj * (barindex - h1lostartindex))) h1lodir = -1 endif h1hi2 = h1hi1 h1hiindex2 = h1hiindex1 h1hi1 = low h1hiindex1 = barindex h1lo2 = h1lo1 h1loindex2 = h1loindex1 h1lo1 = high h1hiindex1 = barindex endif if projectedlines then if h1hidir = 1 then drawsegment(h1histartindex,h1histart,barindex,h1hiend) coloured (0,128,0) h1histartindex = barindex h1histart = h1hiend h1hiend = (h1histart + (h1hiadj * ((barindex+1) - h1histartindex))) endif if h1hidir = -1 then drawsegment(h1histartindex,h1histart,barindex,h1hiend) coloured (0,128,0) h1histartindex = barindex h1histart = h1hiend h1hiend = (h1histart - (h1hiadj * ((barindex+1) - h1histartindex))) endif if h1lodir = 1 then drawsegment(h1lostartindex,h1lostart,barindex,h1loend) coloured (128,0,0) h1lostartindex = barindex h1lostart = h1loend h1loend = (h1lostart + (h1loadj * ((barindex+1) - h1lostartindex))) endif if h1lodir = -1 then drawsegment(h1lostartindex,h1lostart,barindex,h1loend) coloured (128,0,0) h1lostartindex = barindex h1lostart = h1loend h1loend = (h1lostart - (h1loadj * ((barindex+1) - h1lostartindex))) endif endif endif return |
Share this
No information on this site is investment advice or a solicitation to buy or sell any financial instrument. Past performance is not indicative of future results. Trading may expose you to risk of loss greater than your deposits and is only suitable for experienced investors who have sufficient financial means to bear such risk.
ProRealTime ITF files and other attachments :
Find other exclusive trading pro-tools on ![]()
PRC is also on YouTube, subscribe to our channel for exclusive content and tutorials


There has been a minor bug fix as lines were drawn incorrectly if both HH or both LL values were identical. The code and ITF file in this library post have been updated. Anyone who has already downloaded or copied the code should now download v1.1 or copy the amended code found here.
Thanks !
Thank you!
Hello Vonasi super indicator! is it possible to extend the indicator by the time scales M10 and M5?
Thank you
Hello Vonasi
I found out myself how I can change it.
Thanks again for the indicator
HI Razz can you tell how you managed to do it ?
VONAZI super indicator thank you. Can you provide me a code that gives me the two latest max e min without any drawn lines? Thank you very much
hi,
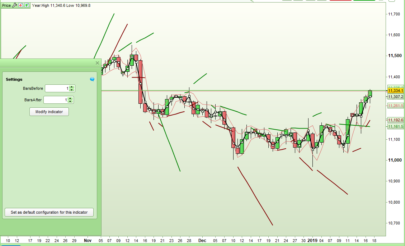
Is there a simple way to draw downwards and upwards trend lines on a specific timeframe. For example on a monthly chart the downward trend line would take the barindex with the high point and then look for the next barindex with the second highest point, and same for the third point. Included would be a parameter for the period as well. Now that i have played a bit with some coding I can’t see that this is too hard.
I have an image I can share, however not sure how to do it from here.
thanks in advance
Toby
Images are not possible in library posts. It is best to start a topic in the forums.
Apologies for not responding sooner. I have been busy completing a professional FX training course. To my earlier comment above, and from what I have been taught by a institutional FX trader the trend lines are crucial for the technical analysis in support of the the fundamentals. I am not sure of your situation however I am trying to establish these trend lines automatically as these need to be adjusted everyday at the start of the trading session for the currency pair in question within the prescribed timeframes being, monthly, weekly, daily and hourly. I am not a coder however I have been able to manipulate some PRT code to create automatic Fibs based on ABCD patterns. Would it be possible to have a dialogue whereby I can explain in more detail what I am trying to accomplish and get your opinion the best way in which to approach this. I don’t think it is difficult however there are some specific conditions that need to be considered for this to work in a way where the charts are automatically updated. I look forward to your response.
All the best for now.
Toby
Sorry – I’m out sailing in Greece for the summer and not coding anything so I can’t help at the moment.
Hi Vonasi,
Sounds lovely, I race yachts around europe myself. Most regattas cancelled unfortunately.
Enjoy the sailing, and if you have a chance once your back to look at the code I have been trying to piece together I would be very grateful. I am very keen on the “Projected Lines” feature you have incorporated as this is what makes the Trendlines work on the FX charts
Many thanks
Toby
Hello Vonasi thank for your work ! A question how can we do it for minutes ( or 15 min or x minutes ) times frames ?
Many thanks in advance !
I think that would be possible but probably in a whole new indicator as detecting when a new 5 minute or x minute bar starts could lead to some incorrect lines being drawn on slower time frame charts as we need to use the MOD instruction to test if our x divides into the closing time of each candle – which it would do a lot on slow charts. I’m a bit busy right now (sailing) but I’ll try to find some time to adapt it if I can…. don’t hold your breath though!