Klinger oscillator

Klinger oscillator

Copyright by HPotter v1.0 09/06/2014
The Klinger Oscillator (KO) was developed by Stephen J. Klinger. Learning from prior research on volume by such well-known technicians as Joseph Granville, Larry Williams, and Marc Chaikin, Mr. Klinger set out to develop a volume-based indicator to help in both short- and long-term analysis.
The KO was developed with two seemingly opposite goals in mind: to be sensitive enough to signal short-term tops and bottoms, yet accurate enough to reflect the long-term flow of money into and out of a security.

The KO is based on the following tenets: Price range (i.e. High – Low) is a measure of movement and volume is the force behind the movement. The sum of High + Low + Close defines a trend. Accumulation occurs when today’s sum is greater than the previous day’s. Conversely, distribution occurs when today’s sum is less than the previous day’s. When the sums are equal, the existing trend is maintained. Volume produces continuous intra-day changes in price reflecting buying and selling pressure.
The KO quantifies the difference between the number of shares being accumulated and distributed each day as “volume force”. A strong, rising volume force should accompany an uptrend and then gradually contract over time during the latter stages of the uptrend and the early stages of the following downtrend. This should be followed by a rising volume force reflecting some accumulation before a bottom develops.


Share this

Risk disclosure:

No information on this site is investment advice or a solicitation to buy or sell any financial instrument. Past performance is not indicative of future results. Trading may expose you to risk of loss greater than your deposits and is only suitable for experienced investors who have sufficient financial means to bear such risk.

ProRealTime ITF files and other attachments : How to import ITF files into ProRealTime platform?

PRC is also on YouTube, subscribe to our channel for exclusive content and tutorials

  1. Niel Rossouw • 10/11/2015 #

    Syntax Error: vairiables “fastx , slowx, triglen” are undefined….

    • Nicolas • 10/11/2015 #

      Because they are external variables and not present in the code. Please download the itf file and import it into your platform, you’ll get rid of this error message.

  2. fykemang • 10/11/2015 #

    Whenever I attempt to apply this to a chart, the value is 0, not sure what is wrong.

    • Nicolas • 10/11/2015 #

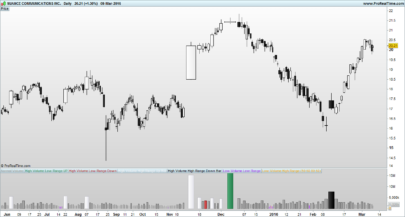
      The Klinger Oscillator needs Volume in order to be calculated. Apply it on an instrument that have Volumes.

avatar
Register or

Likes

avatar avatar avatar avatar avatar
Related users ' posts
TradingDeckard
9 years ago
camarilla pivot points
9
Indicators
Choliver Merci Nicolas pour cette réponse rapide et cette information. J'ai regardé et testé et cela...
carlo__ Sorry, but this indicator doesn't update the levels in real time. They are draw and stucked ...
carlo__ I leave an update. The indicator works as it plots in a progressive way the Cama levels on t...
Nicolas
9 years ago
Adaptive Stochastic
Adaptive Stochastic
1
Indicators
AngelPujalt falta poner bandas por la parte de arriba: 80 y por la parte de abajo: 20
Nicolas
9 years ago
Adaptive CCI
Adaptive CCI
4
Indicators
Stef Thanks @Saud. Enjoyed the article.
Newbie I've tried to modify this so I can display on 1min chart with the 5 min chart variant as a s...
Nicolas No, just create 2 different indicators in this case, one with the timeframe(5 minutes) and o...
GraHal Hi Nicolas I like this and would like to understand it fully so please forgive the (maybe) d...
Nicolas Hi GraHal, the Factor parameter is only a multiplier of the ATR that is added or subtracted ...
GraHal Nicolas, thank you for your useful and informative response. Yes I optimise using ProBackte...
Denis Hello, Congratulations and thank you for this work. I do not understand one thing, however...
Nicolas
9 years ago
GraHal Hi Nicolas Britains .itf file didn't work for me ... I had to change h to hh at line 13 and...
Nicolas Thank you GraHal for pointing this error, i have corrected the code in the file. The code in...
sr021 Hi I tried to copy and paste the code, but recieve the message  : Syntax error:The followi...
Nicolas Hello, of course. You have 3 options : 1/ you download the file and import it into your plat...
Nicolas
9 years ago
Nicolas
9 years ago
Nicolas
9 years ago
trabucaire Hello, what does it mean the 20 and 40 number on this code ? Thank you !
robertogozzi I modified it to make parameters customizable and to Draw a Grey candlestick when a range is...
Nicolas
9 years ago
Blai5 CazaGaps
Blai5 CazaGaps
0
Indicators
Nicolas
9 years ago
Blai5 BB double
Blai5 BB double
0
Indicators
Nicolas
9 years ago
Blai5 ATLAS Mini
Blai5 ATLAS Mini
0
Indicators
Nicolas
9 years ago
Blai5 Astro indicator
0
Indicators
throwaway200
10 years ago
Super Smoothed WMA
Super Smoothed WMA
0
Indicators
dakaodo Very useful when initially learning the timing and rhythm of an instrument. Before using thi...
Denis Then I have tried this but nor does it run : //coloring histogram if pctRankT>=pctile...
Denis Here we are ! //coloring histogram if pctRankT>=pctile/100 then r=255 g=0 b=0 els...
Denis Hi Edisone, see my last comment for setting colors
dave
10 years ago
Value Chart High/Low
12
Indicators
tfx This was my first thought, but 1 minute bars don't look like these on my charts. Hmm...
daveAF  It's SP500 before Wall Street open. 
tfx I will be looking into it. Thank you for responding!
hq76
10 years ago
Ahoora Trend
Ahoora Trend
0
Indicators
dave
10 years ago
Wolf Just for information: This calculate code is interesting, but it is not a Triangular Moving...
Dron Hola Lobo, soy nuevo en programación, pero me interesa ese indicador, en tu mensaje estas ha...
supertiti // TMA CENTER Channel by Dave modifié // parameters // HalfLength = 50 // AtrLength = 10...

Top