

John Ehlers - Correlation Cycle
May 28, 2020, 8:12 AM
Indicators
7 Comments
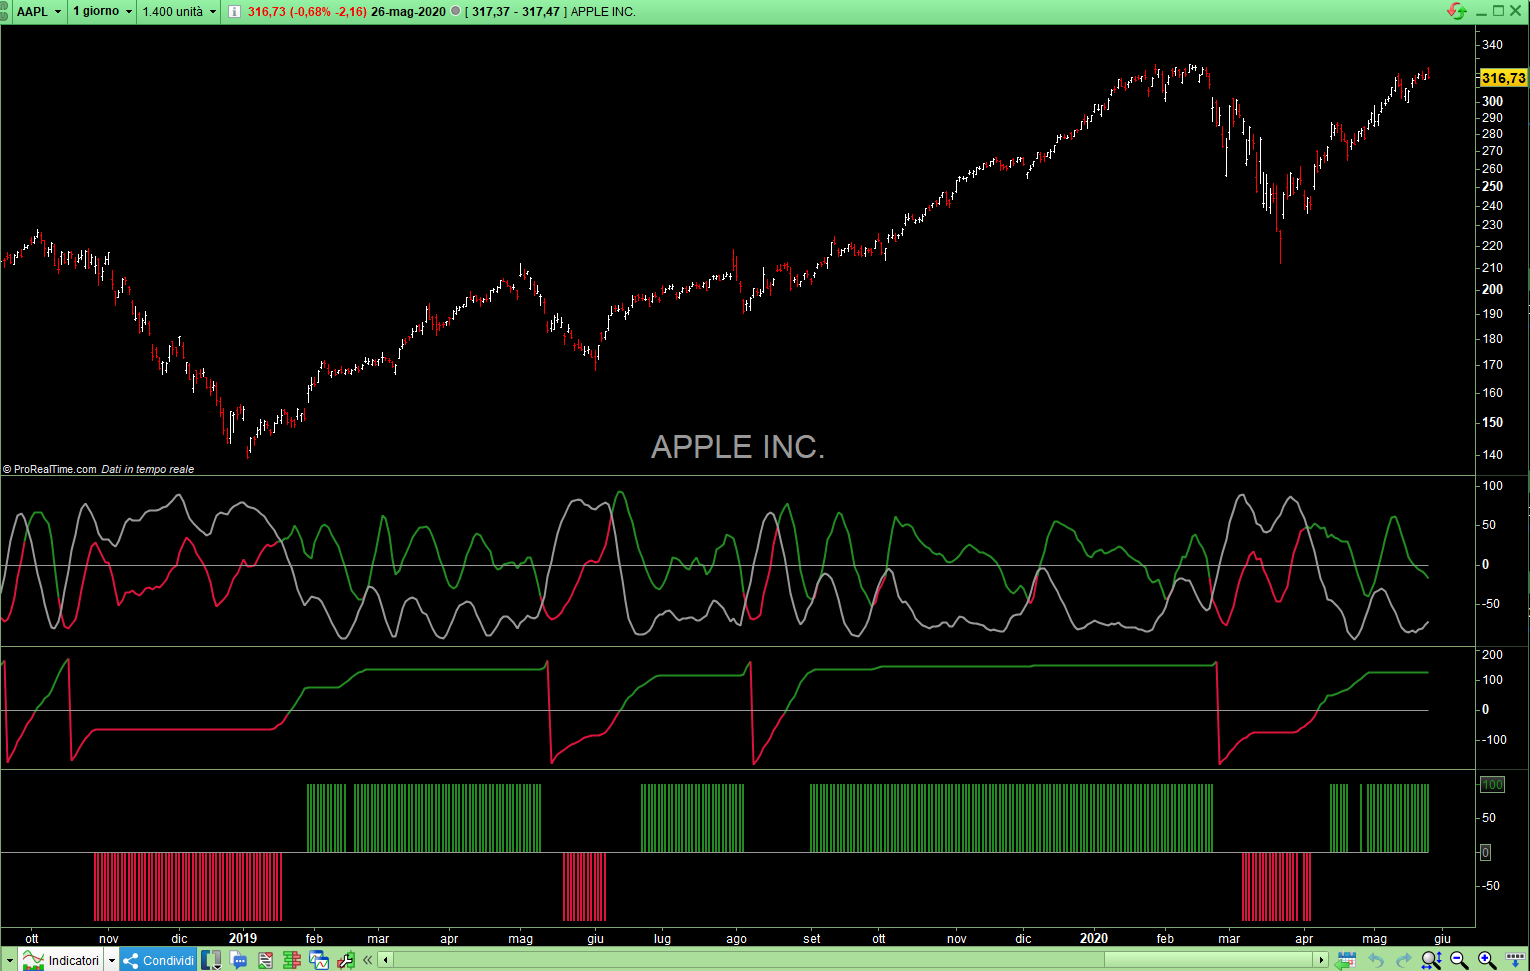
The Correlation Cycle Indicator was created by John Ehlers (Stocks & Commodities TASC). This particular indicator was designed for trend direction and trend strength and simply buy when it is green and sell when it turns red. Also keep in mind that the higher the indicator is above the signal then the stronger the trend and when they are close together, conditions get choppy.
// Indicator: Correlation Cycle
// Correlation Angle Indicator
// (C) 2013-2020   John F. Ehlers
// TASC Jun 2020

// Inputs Setting
Period = 14
InputPeriod = 0           // Uses price data if 0
ShowCycleIndicator = 1 // Booleano  Indicator Mode
ShowCycleIndex = 0    // Booleano  Index Mode
ShowPhasorAngle = 0   // Booleano  Show Angle Phasor Mode
ShowMarketState = 0   // Booleano  Show Market State Mode


//Correlate over one full cycle period
Length = Period
Price = customClose

//Creates a theoretical sinusoid having an period equal to the input period as the data input
if InputPeriod <> 0 then
Price = Sin( 360 * Barindex / InputPeriod)
endif
//Correlate price with cosine wave having a fixed period
Sx = 0
Sy = 0
Sxx = 0
Sxy = 0
Syy = 0
for Count = 1 to Length do
X = Price[count - 1]
Y = Cos( 360 * ( Count - 1 ) / Period )
Sx = Sx + X
Sy = Sy + Y
Sxx = Sxx + X * X
Sxy = Sxy + X * Y
Syy = Syy + Y*Y
next

if ( Length*Sxx - Sx*Sx > 0) and ( Length*Syy - Sy*Sy > 0 ) then
Real = ( Length*Sxy - Sx*Sy ) / SQRT( ( Length*Sxx - Sx*Sx ) * ( Length*Syy - Sy*Sy ) )
endif
//Correlate with a negative sine wave having a fixed period
Sx = 0
Sy = 0
Sxx = 0
Sxy = 0
Syy = 0
for Count = 1 to Length do
X = Price[count - 1]
Y = -Sin( 360 * ( count - 1 ) / Period )
Sx = Sx + X
Sy = Sy + Y
Sxx = Sxx + X * X
Sxy = Sxy + X * Y
Syy = Syy + Y * Y
next

if ( Length*Sxx - Sx*Sx > 0 ) and ( Length*Syy - Sy*Sy > 0 ) then
Imag = ( Length*Sxy - Sx*Sy ) / SqRt( ( Length*Sxx - Sx*Sx ) *( Length*Syy - Sy*Sy ) )
endif

//Compute the angle as an arctangent function and resolve ambiguity
if Imag <> 0 then
Angle = 90 + Atan( Real / Imag )
Endif
if Imag > 0 then
Angle = Angle - 180
Endif
//Do not allow the rate change of angle to go negative
if Angle[1] - Angle < 270 and Angle < Angle[1] then
Angle = Angle[1]
Endif

//Compute and plot market state
State = 0
if Abs( Angle - Angle[1] ) < 9 and Angle <= 0 then
State = -1
Endif
if Abs( Angle - Angle[1] ) < 9 and Angle >= 0 then
State = 1
Endif

If ShowCycleIndicator Then
Realshow = (((real+1)/2)*200)-100
Imagshow = (((Imag+1)/2)*200)-100
r=169
g=169
b=169
if Realshow>Imagshow then
r=34
g=139
b=34
elsif Realshow<Imagshow then
r=220
g=20
b=60
endif
ZeroLine = 0
Endif

If ShowCycleIndex Then
Realshow = (((real+1)/2)*100)
Imagshow = (((Imag+1)/2)*100)
r=169
g=169
b=169
if Realshow>Imagshow then
r=34
g=139
b=34
elsif Realshow<Imagshow then
r=220
g=20
b=60
endif
ZeroLine = 50
Endif

If ShowPhasorAngle Then
AngleShow = Angle
if AngleShow>0 then
r=34
g=139
b=34
elsif AngleShow<0 then
r=220
g=20
b=60
endif
ZeroLine = 0
Endif

If ShowMarketState Then
StateShow = State*100
if StateShow>0 then
r=34
g=139
b=34
elsif StateShow<0 then
r=220
g=20
b=60
Endif
ZeroLine = 0
Endif

Return Realshow coloured(r,g,b) as "Real", Imagshow coloured(153,153,153) as "Imag" ,AngleShow coloured(r,g,b) as "Phasor", StateShow coloured(r,g,b) Style(Histogram,1) as "Correlation Cycle Ind", ZeroLine coloured(153,153,153) as "Zero Line"
Download
Filename:
John-Ehlers-Correlation-Cycle.itf
Downloads:
625
Veteran
Code artist, my biography is a blank page waiting to be scripted. Imagine a bio so awesome it hasn't been coded yet.
Author’s Profile
Loading...