1. Introduction
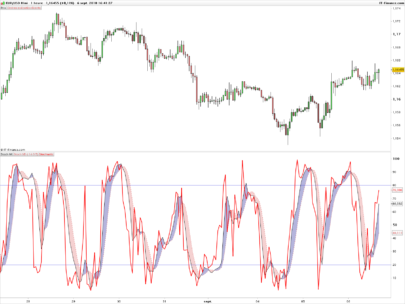
The Hull MA + Stochastic Signals indicator is a hybrid tool that merges trend-following and momentum analysis into a single, streamlined indicator. By combining a configurable Hull Moving Average (HMA) with a Stochastic Oscillator, this indicator provides timely buy and sell signals that are both responsive and reliable. It is ideal for traders who want to identify trade opportunities in the direction of the prevailing trend while avoiding premature entries.
2. Concept Behind the Indicator
At the core of this indicator lies a smoothed price trend line based on one of three variations of the Hull Moving Average:
-
HMA (Hull Moving Average): Uses weighted moving averages to reduce lag and improve trend clarity.
-
THMA (Triple Hull Moving Average): Combines three weighted moving averages for more aggressive smoothing and responsiveness.
-
EHMA (Exponential Hull Moving Average): Integrates exponential moving averages, offering a slightly different sensitivity to price changes.
The user can switch between these modes via the modeSwitch parameter.
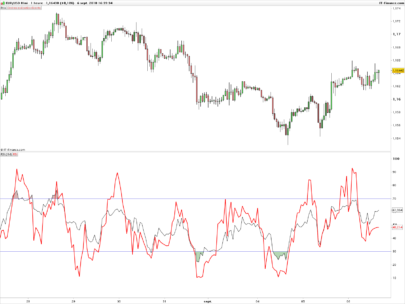
Complementing the trend logic is the Stochastic Oscillator, which identifies momentum shifts and potential reversals. When these two components align — a strong trend confirmed by the Hull average and a bullish or bearish crossover in the stochastic oscillator — the indicator issues a trading signal.
3. Signal Logic
The indicator identifies buy and sell signals based on multiple confirmations:
Buy Signal Conditions:
-
A bullish crossover of the stochastic (%K crosses above %D)
-
The crossover occurs below the oversold level (default: 30)
-
The Hull MA is trending upward
-
Price is above both recent Hull values
-
The current closing price is higher than the previous one
Sell Signal Conditions:
-
A bearish crossover of the stochastic (%K crosses below %D)
-
The crossover occurs above the overbought level (default: 70)
-
The Hull MA is trending downward
-
Price is below both recent Hull values
-
The current closing price is lower than the previous one
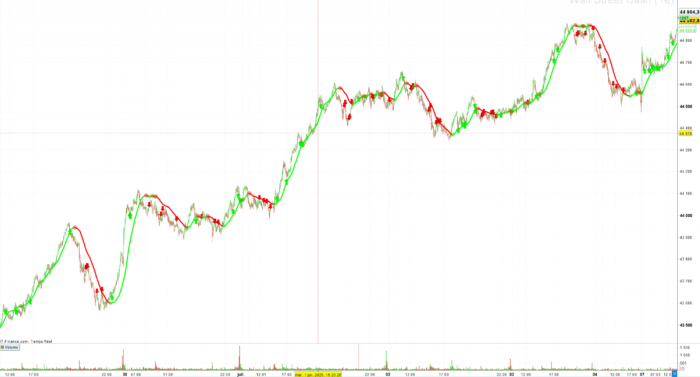
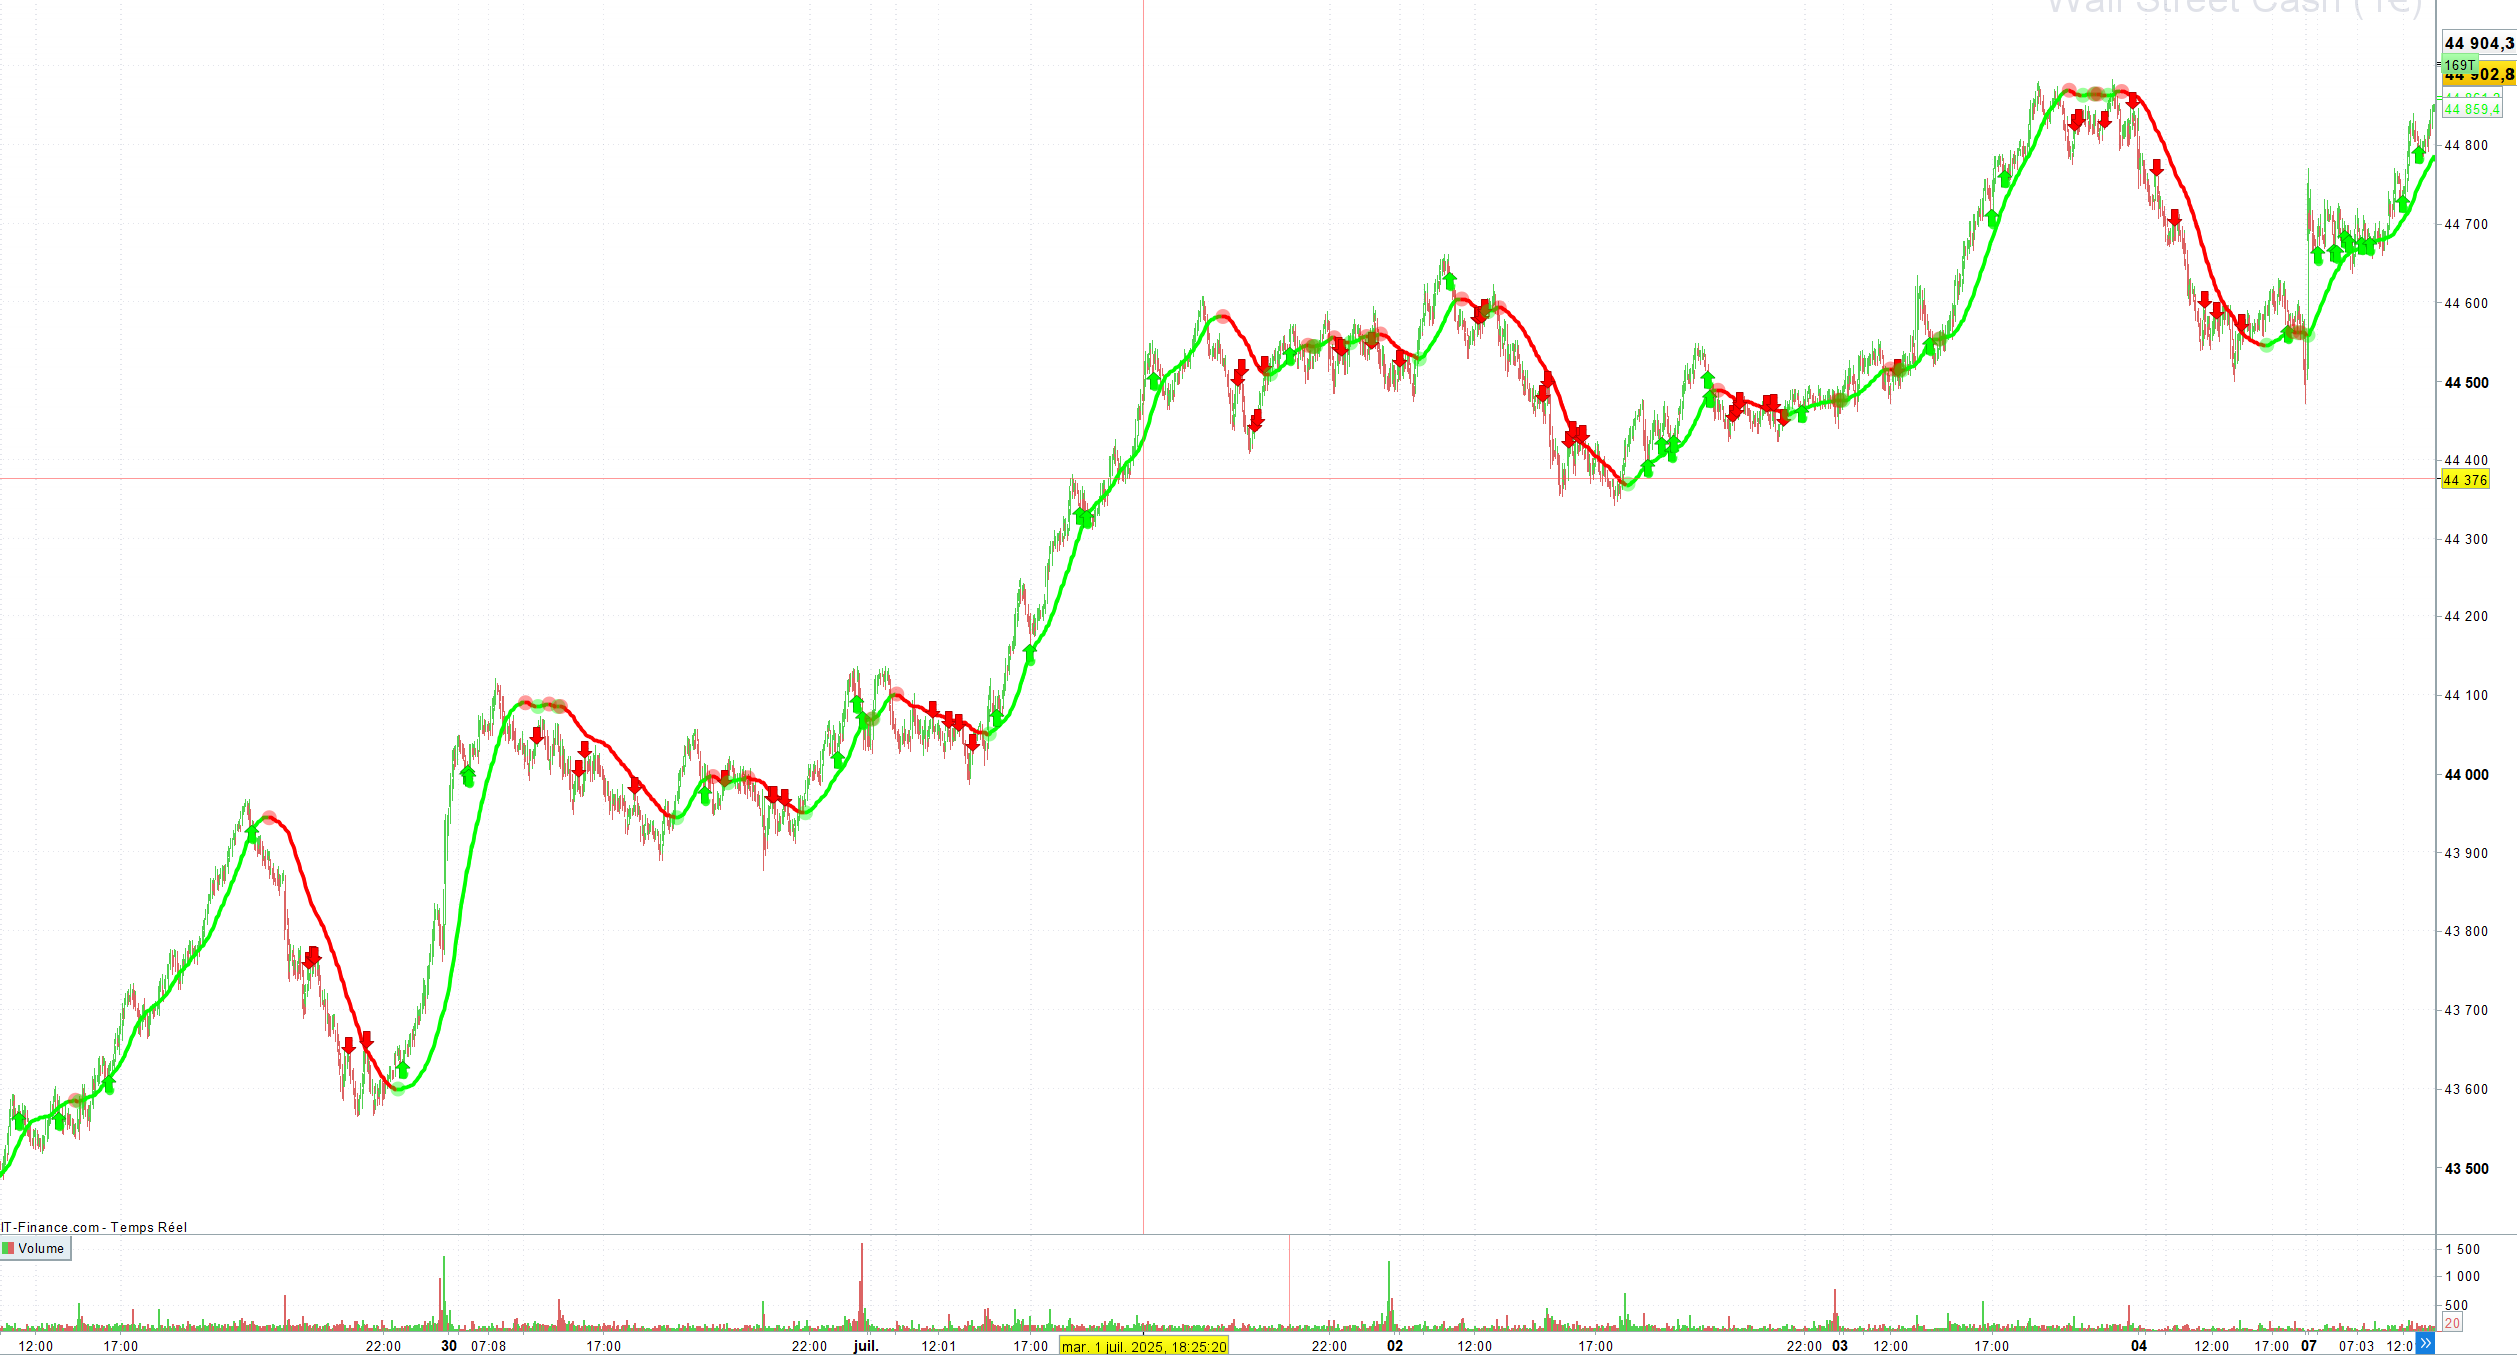
Signals are shown directly on the chart with arrows and labeled text (“BUY” or “SELL”).
4. Customizable Parameters
The indicator provides several parameters for user customization:
-
modeSwitch: Selects the Hull variation (1 = HMA, 2 = THMA, 3 = EHMA) -
length: Main length for the Hull MA calculation (default: 200) -
lengthMult: Multiplier applied to the base length (default: 1.5) -
stochLength: Lookback period for stochastic calculation (default: 14) -
smoothK: Smoothing of %K line (default: 3) -
smoothD: Smoothing of %D line (default: 3) -
oversoldLevel: Threshold for oversold conditions (default: 30) -
overboughtLevel: Threshold for overbought conditions (default: 70)
Adjusting these values allows the trader to fine-tune the indicator to match different asset classes or market conditions.
5. Visual Aids and Plotting
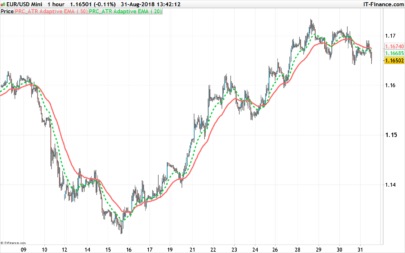
Two Hull MA lines are plotted on the chart:
-
MHULL (Main Hull): Current value of the selected Hull average
-
SHULL (Secondary Hull): Two bars ago Hull value for trend comparison
Their color dynamically changes:
-
Green: Indicates upward trend (MHULL > SHULL)
-
Red: Indicates downward trend (MHULL < SHULL)
Additional visual elements:
-
Green or red arrows and labels mark buy/sell signals
-
Colored points appear when the Hull trend shifts up or down
This combination allows for intuitive and immediate signal interpretation directly on the price chart.
6. Best Use Case Scenarios
This indicator is suitable for:
-
Trend-following strategies: Especially effective when the market is trending
-
Momentum confirmation: Avoids counter-trend signals by requiring alignment with stochastic crossovers
-
Multi-timeframe analysis: Can be adjusted to function on any timeframe from intraday to weekly charts
To minimize false signals, it is recommended to use this indicator in markets or instruments known for clean, directional movement and to combine it with higher timeframe confirmation.
7. Conclusion
The Hull MA + Stochastic Signals indicator delivers a practical and powerful trading solution by uniting trend analysis and momentum confirmation. With its flexible configuration and clear visual output, it offers a robust tool for traders seeking precision entries in trending environments. Whether you prefer smoother exponential readings or sharper trend shifts, the selectable Hull MA variants adapt to your trading style and asset class.
|
1 2 3 4 5 6 7 8 9 10 11 12 13 14 15 16 17 18 19 20 21 22 23 24 25 26 27 28 29 30 31 32 33 34 35 36 37 38 39 40 41 42 43 44 45 46 47 48 49 50 51 52 53 54 55 56 57 58 59 60 61 62 63 64 65 66 67 68 69 70 71 72 73 74 75 76 77 78 79 80 81 82 83 84 85 86 87 88 89 90 91 92 93 94 95 96 97 98 99 100 101 102 103 104 105 106 107 108 109 |
//---------------------------------------------------------------// //Hull MA + Stochastic Signals //---------------------------------------------------------------// src = close modeSwitch = 2 // 1=HMA, 2=THMA, 3=EHMA length = 200 // Length Hull lengthMult = 1.5 // x Length // Stochastiques stochLength = 14 // Period smoothK = 3 // %K smoothD = 3 // %D oversoldLevel = 30 overboughtLevel = 70 //-----HULL MA--------------------------------// if modeSwitch = 1 then // HM halfLength = round(length * lengthMult / 2) fullLength = round(length * lengthMult) sqrtLength = round(sqrt(length * lengthMult)) wma1 = WeightedAverage[halfLength](src) wma2 = WeightedAverage[fullLength](src) rawHMA = 2 * wma1 - wma2 HULL = WeightedAverage[sqrtLength](rawHMA) elsif modeSwitch = 2 then thirdLength = round(length * lengthMult / 3) halfLength = round(length * lengthMult / 2) fullLength = round(length * lengthMult) wma1 = WeightedAverage[thirdLength](src) wma2 = WeightedAverage[halfLength](src) wma3 = WeightedAverage[fullLength](src) rawTHMA = wma1 * 3 - wma2 - wma3 HULL = WeightedAverage[fullLength](rawTHMA) elsif modeSwitch = 3 then halfLength = round(length * lengthMult / 2) fullLength = round(length * lengthMult) sqrtLength = round(sqrt(length * lengthMult)) ema1 = ExponentialAverage[halfLength](src) ema2 = ExponentialAverage[fullLength](src) rawEHMA = 2 * ema1 - ema2 HULL = ExponentialAverage[sqrtLength](rawEHMA) endif //-----STOCHASTIC----------------------// stochK = Stochastic[stochLength, smoothK](close) stochD = Average[smoothD](stochK) //----- HULL-----------------------------------------------// MHULL = HULL SHULL = HULL[2] // BANDS COLOR greenBands = HULL > HULL[2] // GREEN redBands = HULL < HULL[2] // BRED // PRICE POS priceAboveBands = close > MHULL and close > SHULL priceBelowBands = close < MHULL and close < SHULL //SIGNAL stochBullishCross = stochK crosses over stochD and stochK < oversoldLevel buySignal = stochBullishCross and greenBands and priceAboveBands and close > close[1] stochBearishCross = stochK crosses under stochD and stochK > overboughtLevel sellSignal = stochBearishCross and redBands and priceBelowBands and close < close[1] if HULL > HULL[2] then r = 0 g = 255 b = 0 else r = 255 g = 0 b = 0 endif if buySignal then drawarrowup(barindex, low - (high-low)*0.2) coloured("lime") drawtext("BUY", barindex, low - (high-low)*0.4) coloured("lime", 200) endif if sellSignal then drawarrowdown(barindex, high + (high-low)*0.2) coloured("red") drawtext("SELL", barindex, high + (high-low)*0.4) coloured("red", 200) endif hullTrendUp = MHULL > SHULL and MHULL[1] <= SHULL[1] hullTrendDown = SHULL > MHULL and SHULL[1] <= MHULL[1] if hullTrendUp then drawpoint(barindex, MHULL, 3) coloured("lime", 100) endif if hullTrendDown then drawpoint(barindex, MHULL, 3) coloured("red", 100) endif return MHULL coloured(r,g,b) style(line,3) as "Hull Main", SHULL coloured(r,g,b) style(line,1) as "Hull Band" |
Share this
No information on this site is investment advice or a solicitation to buy or sell any financial instrument. Past performance is not indicative of future results. Trading may expose you to risk of loss greater than your deposits and is only suitable for experienced investors who have sufficient financial means to bear such risk.
ProRealTime ITF files and other attachments :
Find other exclusive trading pro-tools on ![]()
PRC is also on YouTube, subscribe to our channel for exclusive content and tutorials


Hi, there appears to be errors in lines 90 & 91, I can’t run it on ProRealTime.