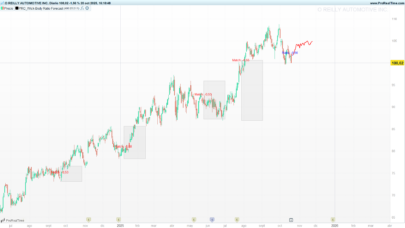
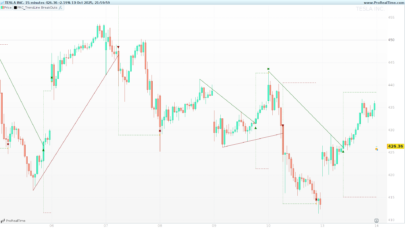
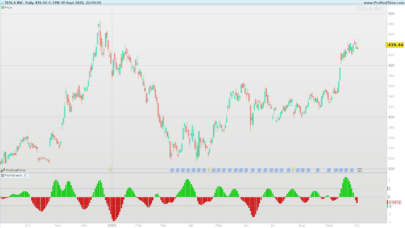
The Fisher Transform attempts to be a major turning point indicator.
Parameters
Length (Len = 13)
O/B (a = 5)
O/S (b = -5)
|
1 2 3 4 5 6 7 8 9 10 11 12 13 14 15 16 17 18 19 20 21 22 23 24 25 26 27 28 |
IF BARINDEX < len THEN value1 = 0 fish = 0 ELSE MaxH = Highest[len](MEDIANPRICE) MinL = Lowest[len](MEDIANPRICE) Value1 = ( (MEDIANPRICE - MinL)/(MaxH - MinL) - .5) + .67 * Value1 If Value1 > .99 then Value1 = .999 ENDIF If Value1 < -.99 then Value1 = -.999 ENDIF Fish = 0.5*Log((1 + Value1)/(1 - Value1)) + .5 * Fish Trigger=fish[1] a=5 b=-5 ENDIF RETURN Fish,Trigger,a,b |
Share this
No information on this site is investment advice or a solicitation to buy or sell any financial instrument. Past performance is not indicative of future results. Trading may expose you to risk of loss greater than your deposits and is only suitable for experienced investors who have sufficient financial means to bear such risk.
ProRealTime ITF files and other attachments :PRC is also on YouTube, subscribe to our channel for exclusive content and tutorials





Value1 = ( (MEDIANPRICE – MinL)/(MaxH – MinL) – .5) + .67 * Value1
Please explain the meaning of this line formula. Why is it different from the original? The original formula is to format the oscillation + – 1 and filter it with equation
EMA = alpha * close + (1 – alpha) * EMA[1];
FYI, other Fisher related posts: (and with other fisher transform method): https://www.prorealcode.com/tag/fisher/
Question for Nicolas or others. Should the Fisher Transformer price / bar be based on MEDIANPRICE as above, or Typically Price?
Thanks for your help, Stuart
Use the data serie you want. Replace MEDIANPRICE by TYPICALPRICE in the above code.
Thanks Nicolas. While I understand I can use either Median or Typical (Price), the question was which is correct or perhaps better to use?
I don’t know. MedianPrice (exact mid price of the candlestick) tends to be smoother than TypicalPrice.
Good to know and thank you.
Oh, on this indicator, how do I change the range from 5/-5 to 1/-1?
Nicolas, on the Trigger formula, Trigger=fish[1] , is that mean it is using linear / moving linear regression of 1 of Fish, or something else? I don’t understand what the [1] mean /do.
Fish = 0.5*Log((1 + Value1)/(1 – Value1)) + .5 * Fish
Thank you for the help understanding this.
Trigger=fish[1]
Trigger is just the value of fish of the previous bar, the blue line.
Ah ha. So FISH – 1 so to speak. I would have thought that would have been coded as [-1].
I have played with a SMA of 4 for the trigger on D charts and it seems nicely profitable. When I back-test standard it losses money. Hence why i was trying to figure it out. I need to back-test 4H time frames.
Thank you for your help.
Stuart
Nicolas, sorry to bother you again. In trying to turn this indicator into a strategy in PRT I am doing something wrong. I had assumed Len is Length of Fish. When i back best in PRT, it does not make a trade, or no second trade. Can you PLEASE advise? I have copies the code below.
DEFPARAM CumulateOrders = True // Cumulating positions activated
capital = 100000 + strategyprofit
Equity = capital / close
myCurrentProfit = STRATEGYPROFIT
Len = 9
IF BARINDEX .99 then
Value1 = .999
ENDIF
If Value1 < -.99 then
Value1 = -.999
ENDIF
Fish = 0.5*Log((1 + Value1)/(1 – Value1)) + .5 * Fish
Trigger = Average[4](close)
Found my mistake, should have been Trigger = Average[4](Fish)
In line 10 there is a value missing for the calculation. You can cross check it here on page 4: https://www.mesasoftware.com/papers/UsingTheFisherTransform.pdf
Line 10 should be:
Value1 = (.66* ((MEDIANPRICE – MinL)/(MaxH – MinL) – .5)) + .67 * Value1
Hello. I’m new to programming and don’t understand the algebraic meaning of the formula:
Value1 = (.66 * ((MEDIANPRICE – MinL) / (MaxH – MinL) – .5)) + .67 * Value1
Isn’t that like saying A = B + n * A?
Something substantial escapes me, thanks to those who want to help me.
You are right, There is something odd with this line of code. It should be
A = B + n * A[1].
So, there are two things missing in line 10.
Ps. Sorry for the late reply