

Fibonacci Bands indicator
Introduction
In this article we’ll explore the Fibonacci Bands indicator, originally developed by Bigbeluga. This tool blends volatility (via ATR), a smoothed moving average (SMMA) and key Fibonacci ratios to help traders identify dynamic support/resistance zones and potential “liquidation sweeps.”
We’ll cover how it works, how to interpret its signals, how to configure its inputs, and best practices for integrating it into your trading.
Overview of the Indicator
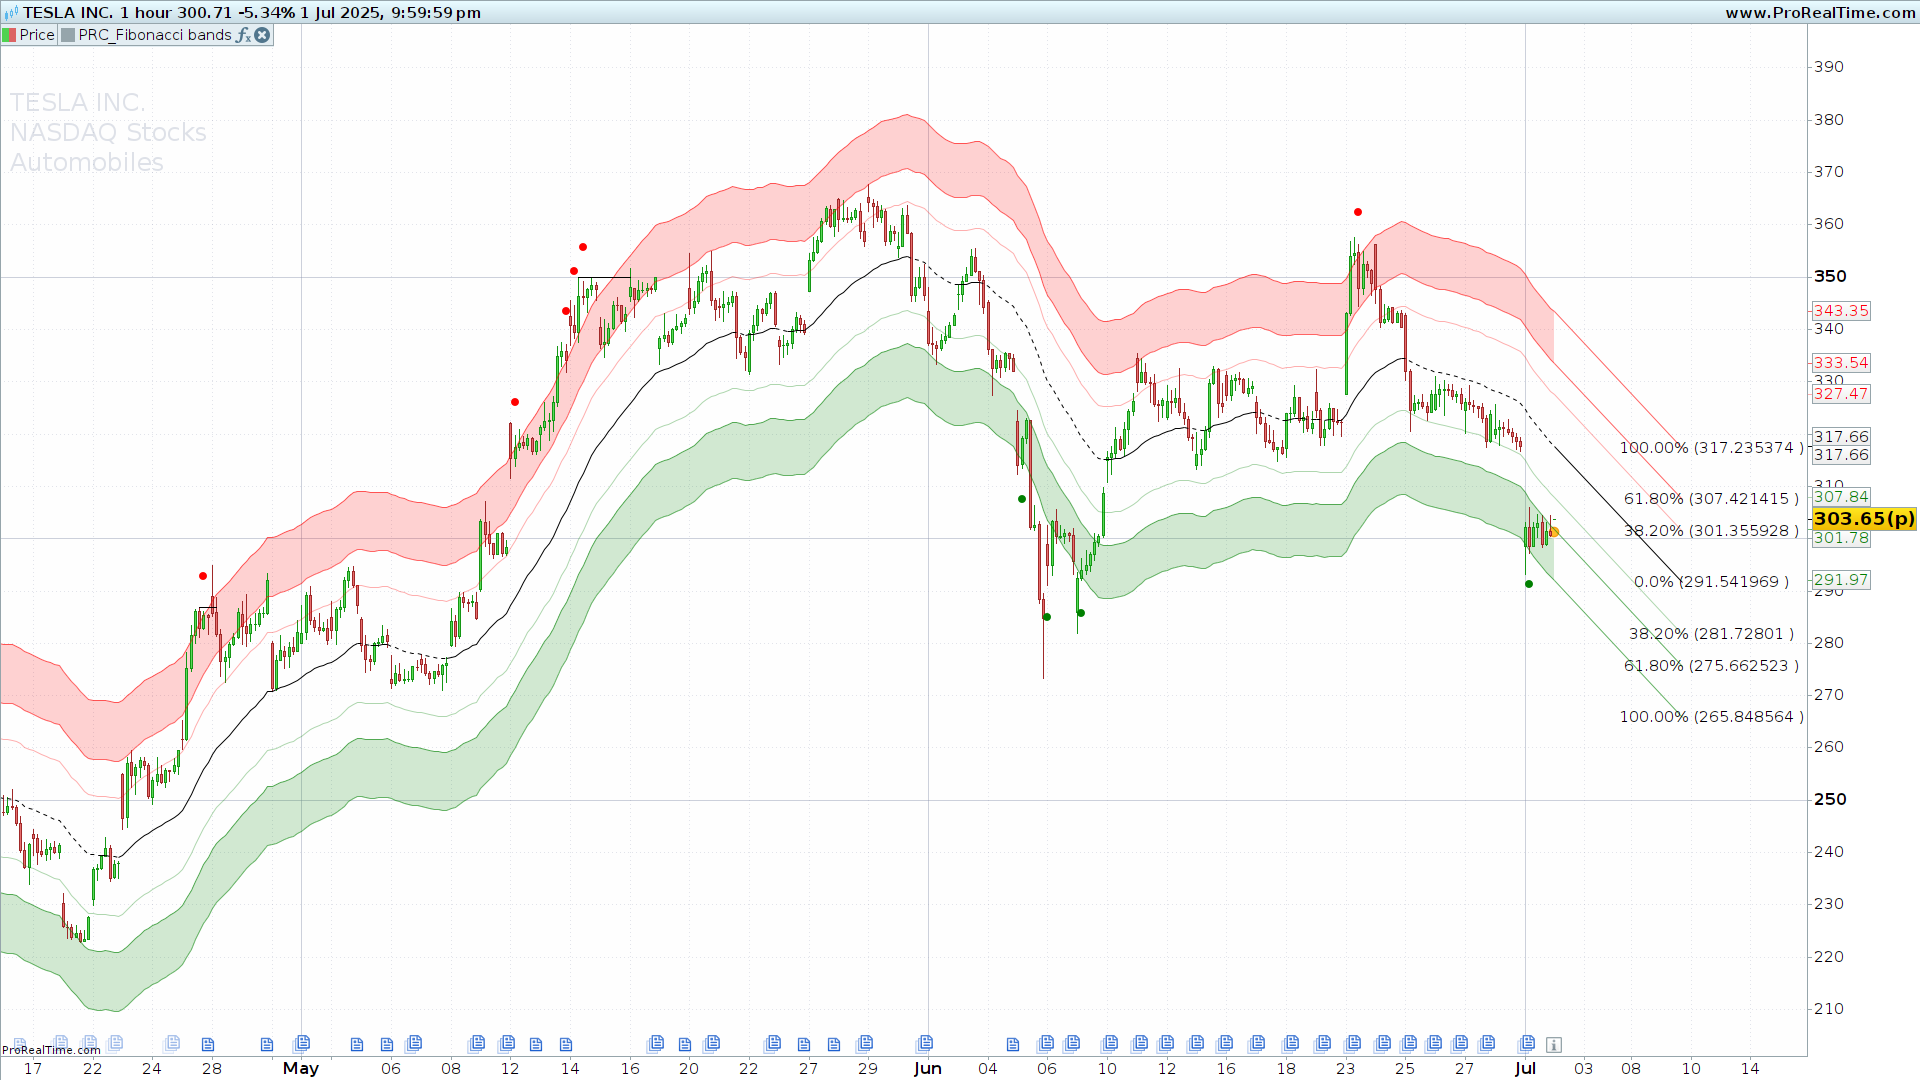
Fibonacci Bands consist of six dynamic lines plotted around a Smoothed Moving Average (SMMA). The distance of each band from the SMMA is set by multiples of the Average True Range (ATR) scaled by Fibonacci ratios:
- Band 1 (38.2 %): ATR × 1.618
- Band 2 (61.8 %): ATR × 2.618
- Band 3 (100 %): ATR × 4.236
These bands are coloured and projected forward, giving you:
- Volatility measurement through an ATR smoothed over 200 bars.
- Trend filtering via a SMMA of price.
- Fibonacci-based zones that act as dynamic support/resistance.
Suitable for any timeframe, it excels in impulsive trends and clear ranging markets, offering both entry/exit cues and zones for potential continuations or retracements.
How to Interpret the Bands
- Upper and lower bands
- fibtop1 / fibbot1 mark the 38.2 % level (ATR × 1.618).
- fibtop2 / fibbot2 mark the 61.8 % level (ATR × 2.618).
- fibtop3 / fibbot3 mark the 100 % level (ATR × 4.236).
- Zone colouring
- The area between the middle and outer bands (levels 2→3) is painted red above the SMMA and green below it, highlighting dynamic overbought/oversold regions.
- Liquidation sweeps
- Local pivot highs/lows are identified (leftbars = 4, rightbars = 1).
- When price touches or exceeds the outer band (fibtop3/fibbot3) and “sweeps” stops against the trend, a red or green dot marks potential stop-hunt zones before a reversal.
Entry and Exit Signals
- Bearish sweep (sweep Down)
- SMMA is declining (downtrend).
- A new pivot high breaches fibtop3.
- High crosses below the prior bar’s high.
- A red point is drawn above the bar.
- Confirmation via a horizontal segment at the pivot level.
- Bullish sweep (sweep Up)
- SMMA is rising (uptrend).
- A new pivot low reaches fibbot3.
- Low crosses above the prior bar’s low.
- A green point is drawn beneath the bar.
- Confirmation via a horizontal segment at the pivot level.
Note on false signals:
In choppy markets, there can be whipsaws. Consider filtering signals with volume, candlestick patterns or market structure to improve reliability.
Band Extension
The extend parameter projects all six bands into the future. It calculates a slope based on the SMMA change over extend/10 bars and draws forward segments at:
- 0 % (the SMMA itself)
- 38.20 % (fibtop1/fibbot1)
- 61.80 % (fibtop2/fibbot2)
- 100.00 % (fibtop3/fibbot3)
This forward projection highlights where dynamic support/resistance levels may lie over the next n periods.
Indicator Settings
| Parameter | Default | Description | Recommended Range |
|---|---|---|---|
period |
20 | SMMA period & slope base | 10 – 50 |
width |
1 | Overall multiplier for Fibonacci bands | 0.5 – 2 |
fibratio1 |
1.618 | Ratio for Band 1 (38.2 %) | 1.0 – 2.0 |
fibratio2 |
2.618 | Ratio for Band 2 (61.8 %) | 2.0 – 3.5 |
fibratio3 |
4.236 | Ratio for Band 3 (100 %) | 3.5 – 5.0 |
extend |
30 | Bars to project bands forward | 10 – 100 |
length1 |
100 | Initial ATR smoothing length | 50 – 200 |
Tip: On higher timeframes increase period and length1 for smoother bands; on lower-volatility instruments reduce width to avoid excessive band width.
ProRealTime Code
Copy and paste the following into ProRealTime’s ProBuilder editor:
//defparam drawonlastbaronly=true
//---------------------------------------------//
// PRC_Fibonacci bands [BigBeluga]
// version = 0
// 01.07.24
// Iván González @ www.prorealcode.com
// Sharing ProRealTime knowledge
//---------------------------------------------//
//----- Inputs
period = 20
width = 1
fibratio1 = 1.618
fibratio2 = 2.618
fibratio3 = 4.236
extend = 30
//---------------------------------------------//
// Calculate ATR
myatr = averagetruerange[200]
src1 = myatr
length1 = 100
sma1 = average[length1](src1)
if barindex <= 300 then
    atr = sma1
else
    atr = (atr*(length1-1) + src1) / length1
endif

// Calculate SMMA
src = close
sma = average[period](src)
if barindex <= period then
    smma = sma
else
    smma = (smma*(period-1) + src) / period
endif

midTrend1 = smma
midTrend2 = smma
if close >= smma then
    a1 = 255
    a2 = 0
else
    a1 = 0
    a2 = 255
endif

// Fibonacci levels
lev1 = atr * fibratio1 * width
lev2 = atr * fibratio2 * width
lev3 = atr * fibratio3 * width

// Fibonacci bands
fibtop1 = smma + lev1
fibtop2 = smma + lev2
fibtop3 = smma + lev3
fibbot1 = smma - lev1
fibbot2 = smma - lev2
fibbot3 = smma - lev3

colorbetween(fibtop2, fibtop3, "red", 45)
colorbetween(fibbot2, fibbot3, "green", 45)

// Liquidation sweep
leftbars = 4
rightbars = 1
// Pivot lows
src1 = low
if src1 > src1[rightbars] and lowest[rightbars](src1) >= src1[rightbars] and src1[rightbars] < lowest[leftbars](src1)[rightbars+1] then
    z = z + 1
endif
// Pivot highs
src2 = high
if src2 < src2[rightbars] and highest[rightbars](src2) <= src2[rightbars] and src2[rightbars] > highest[leftbars](src2)[rightbars+1] then
    t = t + 1
endif

// Signals Up/Down
midtrend = smma > smma[1]
signDn = midtrend and t <> t[1] and high > fibtop3 and high crosses under high[1]
signUp = midtrend = 0 and z <> z[1] and low < fibbot3 and low crosses over low[1]

if signDn then
    drawpoint(barindex, high + myatr, 2) coloured("red")
    hx1 = barindex[1]
    hy1 = high[1]
    checksweepDn = 1
elsif signUp then
    drawpoint(barindex, low - myatr, 2) coloured("green")
    lx1 = barindex[1]
    ly1 = low[1]
    checksweepUp = 1
endif

// Confirmation segments
if checksweepDn then
    if (close < open and high > hy1 and open < hy1) or (close >= open and high > hy1 and close < hy1) then
        hx2 = barindex
        drawsegment(hx1, hy1, hx2, hy1)
        checksweepDn = 0
    endif
endif

if checksweepUp then
    if (close < open and low < ly1 and close > ly1) or (close >= open and low < ly1 and open > ly1) then
        lx2 = barindex
        drawsegment(lx1, ly1, lx2, ly1)
        checksweepUp = 0
    endif
endif

// Extension
slopi = round(extend / 10)
slope = (smma - smma[slopi]) / slopi

if islastbarupdate then
    n1 = barindex
    n2 = n1 + extend

    // SMMA projection (0%)
    ym1 = smma
    ym2 = ym1 + slope * extend
    drawsegment(n1, ym1, n2, ym2)
    drawtext("0.0% (#ym2#)", n2+7, ym2)

    // 38.2%
    y11 = fibtop1; y22 = y11 + slope * extend
    drawsegment(n1, y11, n2, y22) coloured("red", 80)
    drawtext("38.20% (#y22#)", n2+7, y22)

    // 61.8%
    y111 = fibtop2; y222 = y111 + slope * extend
    drawsegment(n1, y111, n2, y222) coloured("red", 155)
    drawtext("61.80% (#y222#)", n2+7, y222)

    // 100%
    y1111 = fibtop3; y2222 = y1111 + slope * extend
    drawsegment(n1, y1111, n2, y2222) coloured("red", 155)
    drawtext("100.00% (#y2222#)", n2+7, y2222)

    // Lower bands projections
    yb11 = fibbot1; yb22 = yb11 + slope * extend
    drawsegment(n1, yb11, n2, yb22) coloured("green", 80)
    drawtext("38.20% (#yb22#)", n2+7, yb22)

    yb111 = fibbot2; yb222 = yb111 + slope * extend
    drawsegment(n1, yb111, n2, yb222) coloured("green", 155)
    drawtext("61.80% (#yb222#)", n2+7, yb222)

    yb1111 = fibbot3; yb2222 = yb1111 + slope * extend
    drawsegment(n1, yb1111, n2, yb2222) coloured("green", 155)
    drawtext("100.00% (#yb2222#)", n2+7, yb2222)
endif

return midTrend1 style(line) coloured("black", a1), midTrend2 style(dottedline) coloured("black", a2), fibtop1 coloured("red", 80),fibtop2 coloured("red", 155),fibtop3 coloured("red", 155),fibbot1 coloured("green", 80),fibbot2 coloured("green", 155),fibbot3 coloured("green", 155)
Conclusions & Best Practices
- Strengths: Dynamically combines volatility and Fibonacci ratios to map out clear support/resistance zones in both trends and ranges.
- Complementary filters: Improve signal quality by layering volume analysis, momentum divergences (e.g. RSI/MACD) or static S/R levels.
