El’s Better Volume

El’s Better Volume

Hi all

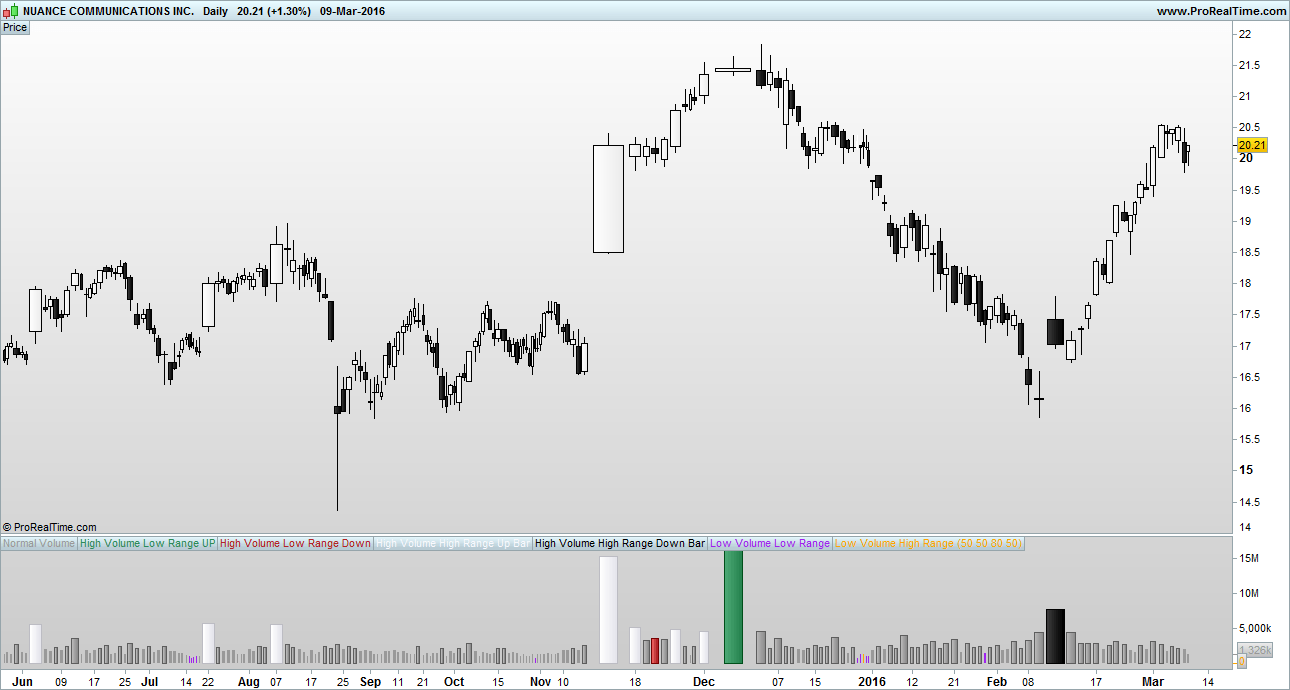
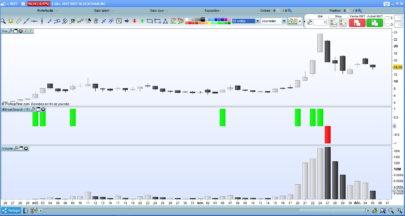
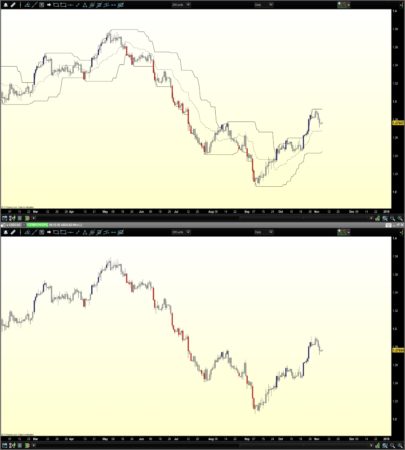
Thought id share my Better Volume indicator to contribute something to the site 🙂 this is my solution to a problem as i felt other better volume indicators out there were over complicating the problem. I used a few MA’s and the built in RANGE() to clean it up.

A link about ‘Better Volume’ and how to interpret it…
http://emini-watch.com/free-stuff/volume-indicator/

You may need to change the colours around for better visability on your background. Feel free to mod it asyou like.

El

Share this

Risk disclosure:

No information on this site is investment advice or a solicitation to buy or sell any financial instrument. Past performance is not indicative of future results. Trading may expose you to risk of loss greater than your deposits and is only suitable for experienced investors who have sufficient financial means to bear such risk.

ProRealTime ITF files and other attachments : How to import ITF files into ProRealTime platform?

PRC is also on YouTube, subscribe to our channel for exclusive content and tutorials
  1. Tarquin • 03/10/2016 #

    Hi,
    Thanks for posting this, I downloaded your first version of Better Volume and it works really well. So I tried loading your second version when I saw the link and although the file is described as my-better-volume-2.itf it only downloads as my-better-volume-1.itf. Am I doing something wrong, or is it possible the link on your post contains the previous file and not the new one?
    Kind Regards,
    Tony

  2. El Chupacabra • 03/10/2016 #

    Hi Tony, just seen your message. TBH I haven’t made a version 2!, maybe the moderator has done? Its a bit of a funny system on here you cant just add your own indicators and stuff without it going through a moderator first. Here is the code im using mate, keep it simple :)….
    // Variables to add:
    // Label in Program = \"vMA\", Label in properties window = \"Volume Moving Average\", Type = int, Default = \"50\"
    // Label in Program = \"vPercentLower\", Label in properties window = \"Low Volume %\", Type = int, Default = \"50\"
    // Label in Program = \"vPercentHigerr\", Label in properties window = \"High Volume %\", Type = int, Default = \"80\"
    // Label in Program = \"BarRanger\", Label in properties window = \"Bar Range\", Type = int, Default = \"50\"

    //Change all indicator styles to \"Histogram\" apart from teh two volume moving averages : LowVolume, HighVolume ..... keep them as lines or make them invisable

    VolumeMA = Average[vMA](VOLUME)

    LowVolume = (VolumeMA - ((VolumeMA * vPercentLower) / 100))
    HighVolume = (VolumeMA + ((VolumeMA * vPercentHigher) / 100))

    Vol = VOLUME
    ONCE HVLRU = 0
    ONCE HVLRD = 0
    ONCE HVHRU = 0
    ONCE HVHRD = 0
    ONCE LVLR = 0
    ONCE LVHR = 0

    c1 = VOLUME > HighVolume AND RANGE < Average[BarRange](RANGE) AND CLOSE > OPEN
    IF c1 THEN
    HVLRU = VOLUME
    Vol = 0
    ELSE
    HVLRU = 0
    ENDIF

    c2 = VOLUME > HighVolume AND RANGE < Average[BarRange](RANGE) AND CLOSE < OPEN
    IF c2 THEN
    HVLRD = VOLUME
    Vol = 0
    ELSE
    HVLRD = 0
    ENDIF

    c3 = VOLUME > HighVolume AND RANGE > Average[BarRange](RANGE) AND CLOSE > OPEN
    IF c3 THEN
    HVHRU = VOLUME
    Vol = 0
    ELSE
    HVHRU = 0
    ENDIF

    c4 = VOLUME > HighVolume AND RANGE > Average[BarRange](RANGE) AND CLOSE < OPEN
    IF c4 THEN
    HVHRD = VOLUME
    Vol = 0
    ELSE
    HVHRD = 0
    ENDIF

    c5 = VOLUME < LowVolume AND RANGE < Average[BarRange](RANGE)
    IF c5 THEN
    LVLR = VOLUME
    Vol = 0
    ELSE
    LVLR = 0
    ENDIF

    c6 = VOLUME < LowVolume AND RANGE > Average[BarRange](RANGE)
    IF c6 THEN
    LVHR = VOLUME
    Vol = 0
    ELSE
    LVHR = 0
    ENDIF

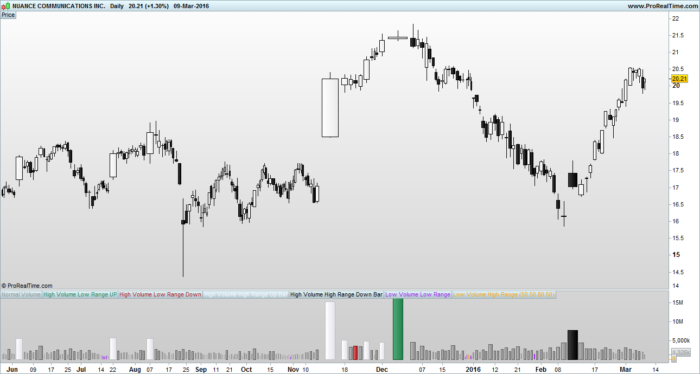
    RETURN Vol COLOURED (153,153,153) AS \"Normal Volume\", HVLRU COLOURED (46,139,87) AS \"High Volume Low Range UP\", HVLRD COLOURED (178,34,34) AS \"High Volume Low Range Down\", HVHRU COLOURED (248,248,255) AS \"High Volume High Range Up Bar\", HVHRD COLOURED (0,0,0) AS \"High Volume High Range Down Bar\", LVLR COLOURED (160,32,240) AS \"Low Volume Low Range\", LVHR COLOURED (255,165,0) AS \"Low Volume High Range\", HighVolume COLOURED (216,191,216) AS \"High Vol MA\", LowVolume COLOURED (216,191,216) AS \"Low Vol MA\"


avatar
Register or

Likes

avatar avatar avatar avatar avatar
Related users ' posts
parthapersonal Great job Leo. Dear Zen83, how do you, "return them into the very last line"?
steve_ Hi! This thread is quite old, but let’s try… I’m new with Prorealcode and I’ve just di...
steve_ Hi! I've created a topic in french (translatable with Google function) here : https://www.p...
Marcel For those who are interested, I post trade opportunities with this indicator on Twitter. (@M...
swapping Thank you for sharing, best regards
Mirko Vaglio Interesting idea to bypass the limit of PRT about multiple timeframe, and I am just trying t...
Mirko Vaglio Looking a little bit more, now I understand what had to be absolutely obvious from the first...
Seb nice code! I'm trying to use your method to do a higher timeframe EMA, without success yet. ...
Tellie2015 tack ska du ha för dina delningar både här o twitter
Nicolas Better to download the file from the page and import it into your platform in order to not c...
marcov66 Hi Nicolas, thanks for sharing the VWAP Date Indicator. It is really powerful. Nevertheless,...
Nicolas Are you sure you are using the same exact date, hours, minutes, seconds for anchor?
Leo Hi all, I posted a new version of this indicator ( I just add arrows to spot the local maxi...
Trading_En_El_Ibex35 Muchas Gracias por compartir este interesante indicador. Un saludo
xavieralava hola gracias leo
Nicolas
8 years ago
julien1978 changing the trendDetectionLength setting does not seem to have any effect on the wave calcu...
arran i can't seem to get this indicator to work on forex pairs. it works great on indices etc. An...
Nicolas Indicator needs Volume, and there are no volumes with forex pairs with IG.
Nicolas https://www.prorealcode.com/topic/ayuda-screener-indicador-perfect-trend-line/#post-51291
Manu L. Bonjour Nicolas, suite a une de mes precedentes demande dans le forum indicateur, j'ai touv...
AntoGH C'est selon moi le meilleur indicateur, que j'ai vu, si vous trouvez mieux dîtes moi car dif...
avatar
Anonymous Found: just remove "T coloured(r,g,b) as "Top", Bo coloured(r,g,b) as "Bottom"... after return
darbes Hi I tried to use indicator in a strategy code. But backtesting is asking to define Signalb...
getset Hello, I like this indicator, it's small and very nice to use. So i changed the code a littl...
Jiacky mma = average[per,1](close) should be mma = average[per,1](close * 1000). Otherwise TDF will...
Lydia1948 Hi I really like this indicator - is it easy to change the colour of the blue dots to say g...
Nicolas Lines 23 and 24 are the Red and Blue value between 0 to 255, you can change the color of the...
vuduyet94@gmail.com Hi. I want Indicator Reversal Bars. I look in the library without seeing. hope the helping. ...
bolsatrilera Hi Nicolas, I have this version of the True Balance Power ,created by eykpunter on Tradingvi...
bolsatrilera and the code : REM TRUE BALANCE OF POWER // código original de eykpunter para la plataform...
Al Ok grazie Gabri
Paul thnx for posting. Combine it with Williams’ 3 bar trailing stop to create strategy!
gabri Paul, he uses the best day of the week to trade (he figured out the best day to enter, exit...
rafadonl2 is not taken into account in the procedure. It considers only if it is a doji or when candle...
Guibourse Okay thanks, just a question : how do you plot your two lines in the same window as price ? ...
rafadonl2 sorry, I don't understand your question. Indicator draws Heikin Ashi candle, not price cand...
Nicolas
8 years ago
swapping Bonjour Nicolas, comment doit-on modifier le code (ou ajouter la variable "style") pour que ...
Nicolas Il faut changer la dernière ligne du code par : return ibuf108 style(line,2) as "Vostro", ...
swapping Merci beaucoup Nicolas, c'est mieux ainsi ...

Top