
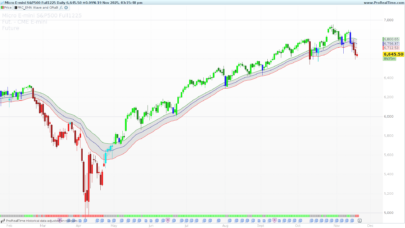
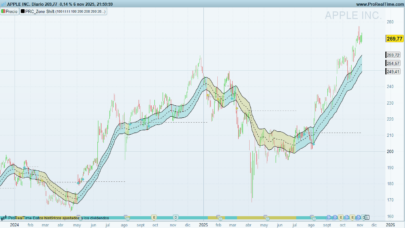
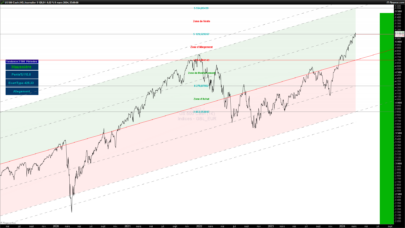
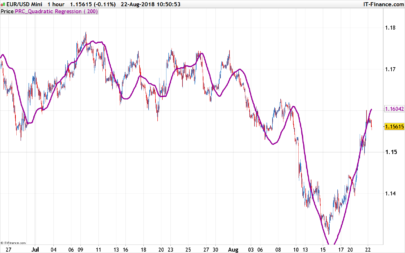
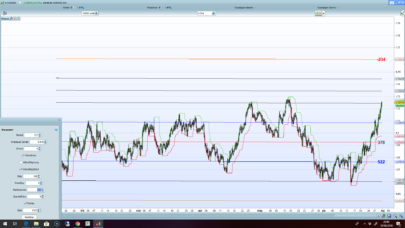
Regression channels are a powerful tool for analyzing trends. They plot a central “mean” line of a trend and upper/lower bands to measure volatility, helping traders identify overbought or oversold conditions.
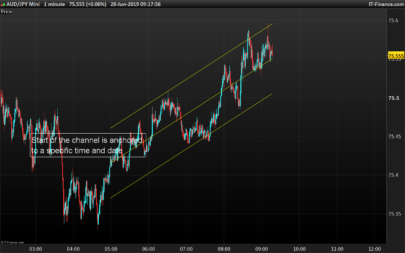
However, most standard regression channels are based on a “rolling” fixed period (e.g., the last 100 bars). This can be limiting. What if you want to analyze a trend not from “100 bars ago,” but from its specific starting point—like a major market bottom or a key news event?
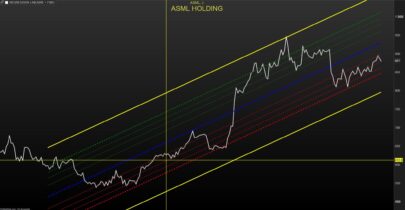
This indicator solves that problem. It allows you to anchor a regression channel to a specific date and time, creating a dynamic tool that grows and adapts with your chart.
How It Works & Key Features
The logic is simple but effective. Instead of defining a lookback period, you define a fixed starting point in the past.
- Anchoring: You set a
StartDateandStartTimein the code’s configuration. The indicator finds this single bar on your chart and uses it as the permanent “anchor” (Bar 0) for all its calculations. - Dynamic Recalculation: The “dynamic” part is key. The channel is always calculated from that single anchor point up to the current, most recent bar.
- Growing Channel: As each new bar forms, the indicator automatically recalculates the entire channel’s slope, intercept, and standard deviation. This means you can watch the trend’s path and volatility evolve in real-time, all based on its original starting point.
Main Use Cases
The primary benefit of this indicator is adding historical context and objectivity to your trend analysis.
- Analyze Trends from a Specific Event: This is the most powerful feature. You can anchor the channel’s start to:
- A major market bottom or top.
- A significant news release (e.g., an earnings report or central bank decision).
- The beginning of a new year, quarter, or month.
- Objective Trend Analysis: It removes the guesswork of picking the “right” lookback period (e.g., 50, 100, or 200). Your analysis is based on the trend’s entire life since the anchor point you selected.
- Visualize Volatility: By watching the standard deviation bands, you can see if a trend is expanding (volatility increasing, bands widening) or contracting (volatility decreasing, bands narrowing) as it matures.
Configuration
You can easily configure the channel by editing the “USER INPUTS” section at the top of the code.
StartDate: Enter the starting date for the channel. The format must be YYYYMMDD (e.g.,20250128for January 28, 2025).StartTime: Enter the starting time. The format must be HHMMSS (e.g.,150000for 3:00:00 PM).- Important: This time is based on your chart’s time (the time displayed on the x-axis), not necessarily your local computer time.
StdMultiplier: (Default:2). This controls the width of the upper and lower bands. A value of 2 is standard (capturing ~95% of price action), but you can use1for a tighter channel or3for a wider one.
ProBuilder Code
|
1 2 3 4 5 6 7 8 9 10 11 12 13 14 15 16 17 18 19 20 21 22 23 24 25 26 27 28 29 30 31 32 33 34 35 36 37 38 39 40 41 42 43 44 45 46 47 48 49 50 51 52 53 54 55 56 57 58 59 60 61 62 63 64 65 66 67 68 69 70 71 72 73 74 75 76 77 78 79 80 81 82 83 84 85 86 87 88 89 90 91 92 93 94 95 96 97 98 99 100 101 102 103 104 105 106 107 108 109 110 111 112 113 114 115 |
//------------------------------------------------------ // PRT_Anchored Regression Channel // Description: Draws an anchored regression channel based on a // user-specified start date and time. // The channel recalculates dynamically on each new bar. // version = 0 // 14.11.2025 // Iván González @ www.prorealcode.com // Sharing ProRealTime knowledge //------------------------------------------------------ DEFPARAM DRAWONLASTBARONLY = TRUE //------------------------------------------------------ // --- USER INPUTS --- //------------------------------------------------------ // The user must enter the start date and time here StartDate = 20250501 // Format YYYYMMDD StartTime = 150000 // Format HHMMSS StdMultiplier = 2 // Standard Deviation Multiplier (e.g., 2) expand = 150 // Number of bars to project into the future //------------------------------------------------------ // --- 1. Find the starting BarIndex (only once) --- //------------------------------------------------------ ONCE FoundStart = 0 ONCE StartBarIndex = -1 MyDateTime = Date * 1000000 + Time InputDateTime = StartDate * 1000000 + StartTime IF NOT FoundStart AND MyDateTime >= InputDateTime THEN StartBarIndex = barindex FoundStart = 1 ENDIF //------------------------------------------------------ // --- 2. Manual Linear Regression Calculation --- //------------------------------------------------------ // N = Number of bars from the start to the current bar N = barindex - StartBarIndex + 1 if islastbarupdate then // Initialize sums SumX = 0 SumY = 0 SumXY = 0 SumX2 = 0 // Loop to calculate the sums // (x = relative index 0, 1, 2...N-1; y = closing price) FOR i = 0 TO N - 1 DO x = i y = close[N - 1 - i] // close[N-1]...close[0] SumX = SumX + x SumY = SumY + y SumXY = SumXY + (x * y) SumX2 = SumX2 + (x * x) NEXT // Calculate Slope and Intercept Slope = 0 Intercept = 0 Denominator = (N * SumX2 - SumX * SumX) IF Denominator <> 0 THEN Slope = (N * SumXY - SumX * SumY) / Denominator Intercept = (SumY - Slope * SumX) / N ENDIF //------------------------------------------------------ // --- 3. Standard Deviation of Residuals Calculation --- //------------------------------------------------------ SumResidualsSq = 0 // Sum of squared residuals FOR i = 0 TO N - 1 DO x = i y = close[N - 1 - i] // Value of the regression line at that point 'x' RegressionValue = Intercept + Slope * x // Residual (difference between actual price and the line) Residual = y - RegressionValue // Sum the square of the residual SumResidualsSq = SumResidualsSq + (Residual * Residual) NEXT // Standard deviation of the residuals StdDev = SQRT(SumResidualsSq / N) //------------------------------------------------------ // --- 4. Calculate channel start and end points --- //------------------------------------------------------ // Start points (at relative index x=0) RegStart = Intercept UpperStart = RegStart + StdMultiplier * StdDev LowerStart = RegStart - StdMultiplier * StdDev // Future End points // Relative index of the current bar is (N - 1) // Relative index of the future bar is (N - 1) + expand FutureRelativeIndex = (N - 1) + expand RegEnd = Intercept + Slope * FutureRelativeIndex UpperEnd = RegEnd + StdMultiplier * StdDev LowerEnd = RegEnd - StdMultiplier * StdDev // Absolute bar index for the future end point FutureAbsoluteIndex = barindex + expand //------------------------------------------------------ // --- 5. Draw the Channel --- //------------------------------------------------------ // (Using absolute BarIndex: StartBarIndex and barindex) DRAWSEGMENT(StartBarIndex, RegStart, FutureAbsoluteIndex, RegEnd) COLOURED(0, 0, 255) STYLE(DottedLine) DRAWSEGMENT(StartBarIndex, UpperStart, FutureAbsoluteIndex, UpperEnd) COLOURED(255, 0, 0) DRAWSEGMENT(StartBarIndex, LowerStart, FutureAbsoluteIndex, LowerEnd) COLOURED(0, 150, 0) endif //------------------------------------------------------ RETURN |
Share this
No information on this site is investment advice or a solicitation to buy or sell any financial instrument. Past performance is not indicative of future results. Trading may expose you to risk of loss greater than your deposits and is only suitable for experienced investors who have sufficient financial means to bear such risk.
ProRealTime ITF files and other attachments :
Find other exclusive trading pro-tools on ![]()
PRC is also on YouTube, subscribe to our channel for exclusive content and tutorials


Line 86, just replace N by (N-1) . 1 degree of freedom
This is really a good indicator, but we are unable to do alert trading with it, for example alert trade buy when less or equal the lower band of the channel, or alert trade sell when greater or equal than the upper band of the channel. could you adjust the indicator to allow us to do that please.