Blai5 Astro indicator

Blai5 Astro indicator

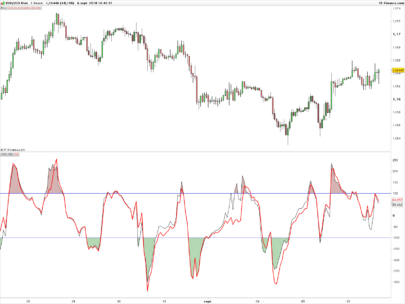
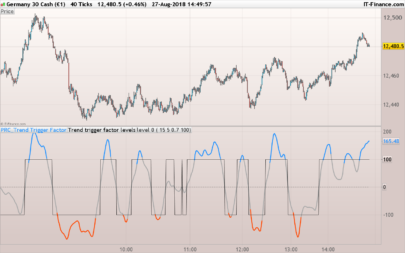
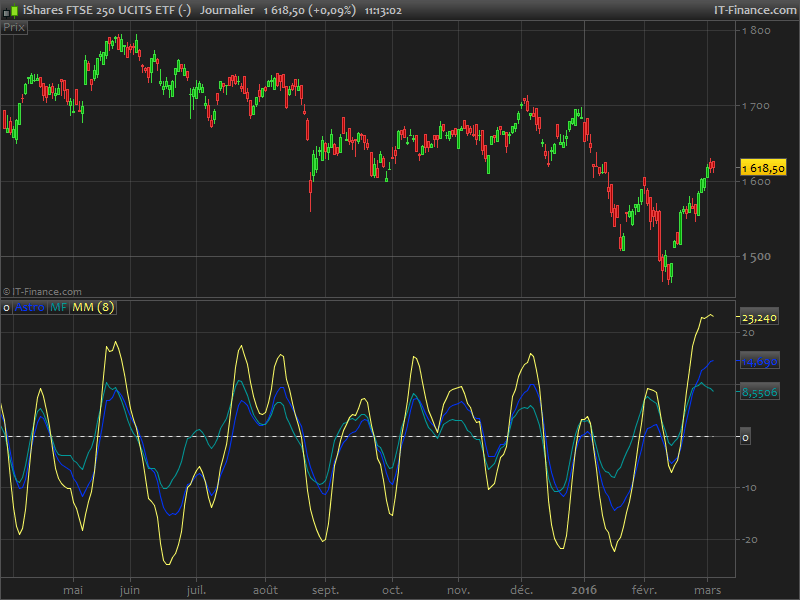
Trend indicator based on the calculation of time on operational stockings Blai5 Vigia. Need volumes to compute correctly.
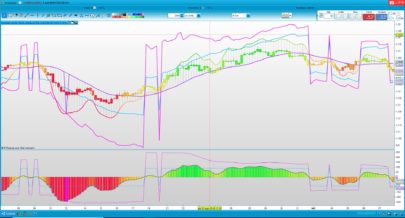
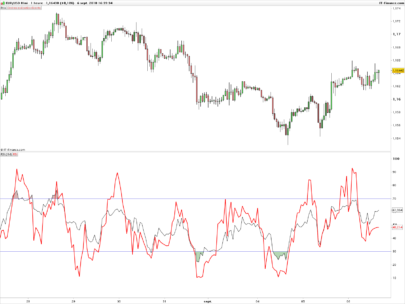
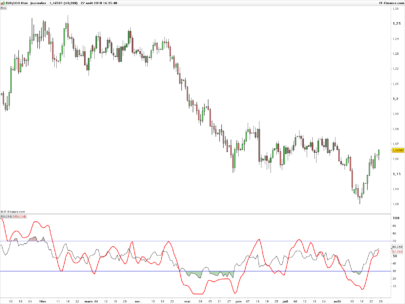
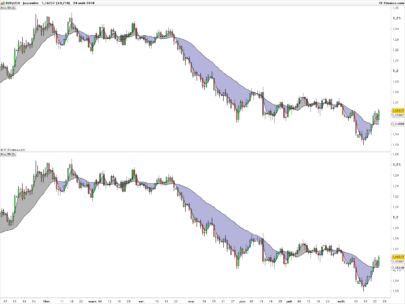
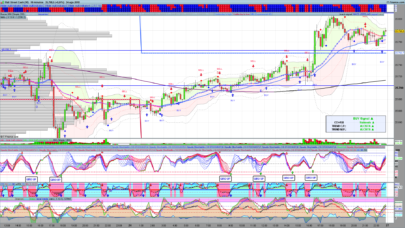
The indicator consists of three lines. The first (MR and MF) two form a ribbon that crosses regularly. Astro is the value of the difference between the two lines, and should be interpreted as we would MACD histogram.
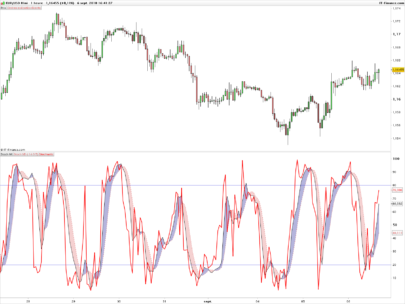
The indicator can be configured and operated in various ways. It can be used simply making visible the Astro curve, or also presenting the “treadmill” that make up MR and MF; alone or with Astro.
Operating this trend indicator is not difficult, it gives many possibilities presenting a wealth of signs, more than the usual in this type of indicators. In principle, when MR (red) is higher than MF (blue), the time is positive and the value is likely to increase or, failing that, resist the descent; and vice versa.
It can be operated by crosses both lines (= crossings Astro on the zero line), but the most aggressive user will quickly realize that also offers the possibility to operate between extremes, slope and even by divergence, where the Astro tape is very rich.
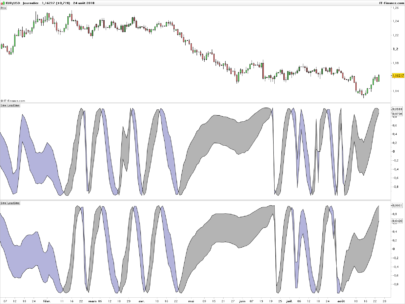
The timing of the cycle (T) can be adjusted to better match assets and temporality wishing surgery.

Indicator explanation translated from Spanish


Share this

Risk disclosure:

No information on this site is investment advice or a solicitation to buy or sell any financial instrument. Past performance is not indicative of future results. Trading may expose you to risk of loss greater than your deposits and is only suitable for experienced investors who have sufficient financial means to bear such risk.

ProRealTime ITF files and other attachments : How to import ITF files into ProRealTime platform?

PRC is also on YouTube, subscribe to our channel for exclusive content and tutorials

avatar
Register or

Likes

avatar avatar avatar
Related users ' posts
Nicolas Thanks a lot for this new valuable addition to our library. I changed line 76 with "barindex...
Horance Thanks. I've noticed this leftover after submission, but it was too late for editing. BTW, I...
Etienne Thanks Horance for porting this code to PRT. I would like to bring some speedup to your cod...
Nicolas
7 years ago
Maxime Baudin Interesting, Thank you! :)
franck-david Bonjour Nicolas , actuellement je me forme grace a vos videos tres tres bien expliques mer...
Nicolas Merci. ça n'est pas le lieu pour poser ce genre de question :) Merci d'utiliser le forum Pro...
Horance This is a good question. John Ehlers explains it in Rocket Science for Traders. You have to ...
cbeukes Much appreciated, I will give that a try. Also, is there any criteria that one could use to ...
avatar
Anonymous Thanks for the code! I'm trying to understand how it works, and have a few questions... line...
Bhanu Pratap Dear Sir, Can I get MQL4 File for this indicator and last man standing . pls looking forward...
ISTJ_T Hi Nicolas Thanks a lot for the indicator. Trading off the TradingView and have issues wit...
Nicolas Just use ProRealTime and its powerful screener for stocks.
Nicolas S11 variable is not a loop but a ratio calculation. In real time the codes is processed on e...
Stephan_V Nicolas, This regression delivers damn good results, especially for trends ! I'm wonde...
Nicolas Least square method is used here in order to get the perfect y = ax2 + bx + c
Bebbo Grazie del prezioso contributo Nicolas, scusa la mia inesperienza, sono alle prime armi e s...
Nicolas To avoid recalculation, you should use the one from this post.
Bebbo Ok Grazie Nicolas.
GertLjung Ok, thanks
marinober Gentile Nicolas, l'indicatore mi da errore : ciclo infinito o con troppe iterazioni, modific...
Nicolas Se la stai usando in un piccolo lasso di tempo, assicurati di avere unità sufficienti visual...
gabri Brined :) look on this indicator how on the 6th and on the 9th you have very high positive s...
Pepsmile Hi everybody, An application could be found by applying this indicator on the strategy prof...
zilliq Thanks for your indicator Gabri but are you sure for your code because on EUR/USD for exampl...
Nicolas The indicator may be not as accurate with the initial version, see discussion here: https://...
maurizio A me non funziona errore nella riga 11 e 13
maurizio //PRC_Alan Kelland's Box | indicator //07.08.2018 //Nicolas @ www.prorealcode.com //Shari...
bolsatrilera
7 years ago
jissey Bonjour Bolsatrilera, je trouve le cm rsi interessant, merci de l'avoir mis à disposition ! ...
bolsatrilera bonjour jissey, je n'ai aucune information sur ce que tu dis, je suis désolé.
Marcel The line is just a moving average line. The indicator reacts on the Parabolic SAR dots.
Mattzi I dont get the dots! What am i doing wrong? :)
Mattzi Ignore this comment ;)
joobeng Sorry, I solved the problem. I have add the CBL indicator using the spanner icon on the pric...
Nicolas Adjust the price settings for the Y Axis to use the price only.
XXXXVII Hello Your indicator is interesting. However, I can't see the orange line. Do you have ...
ALE Hi the color is given by a numerical value derived from the oscillator in use. If you comp...
efahmy Thanks mate
Jo-01-R Hello, it is possible to have this indicator but instead of colors rather have numbers rangi...

Top