Hi, I would like to know if is possible to create an indicator as now we’ll explain.
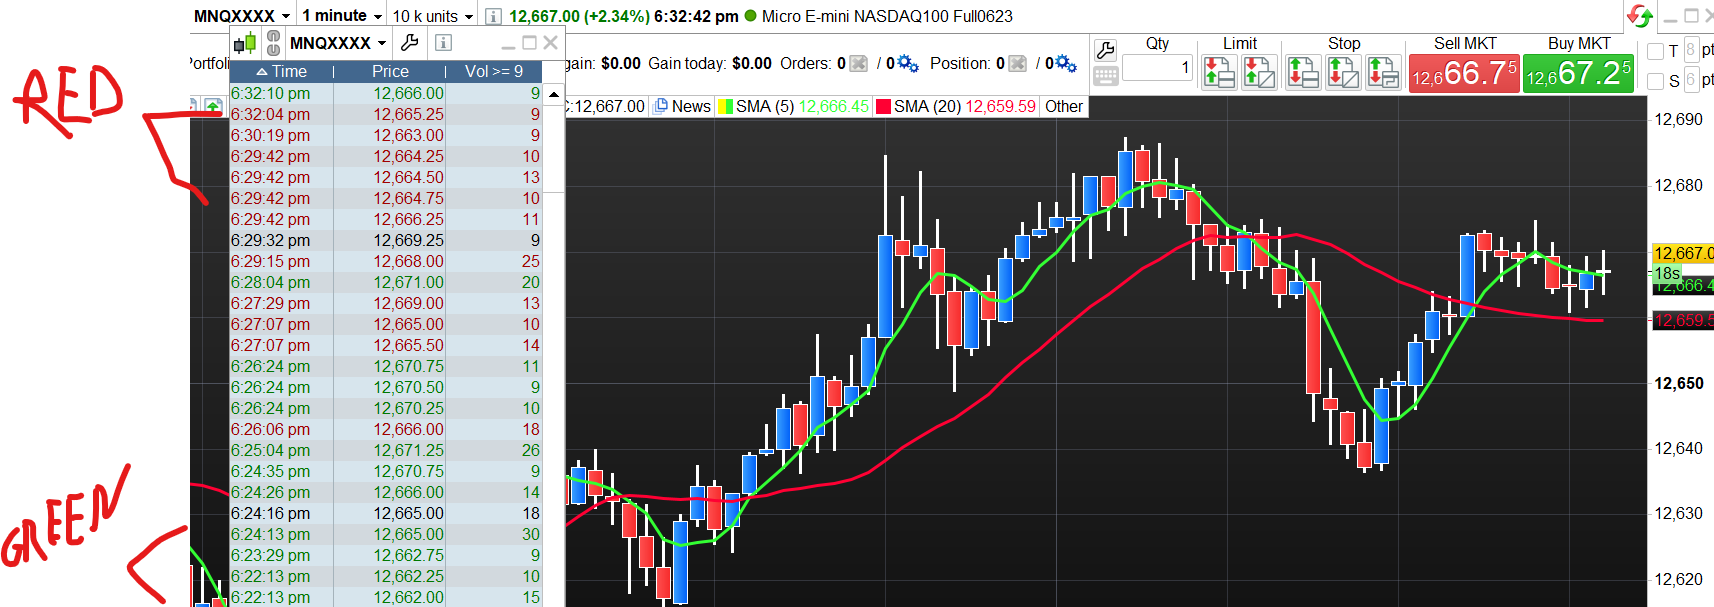
So for example I open the nasdaq future graph 1 minute time frame then I open his time & sales set to display only volume equal or bigger then 5(or any other numer that I can put), so for any candle of my timeframe, I would like to have an indicator under the price that show the difference beetween green order and red order (equal or bigger then 5 as before) taken from time and sales.
I hope what I wrote could be clear. Thanks a lot for your help