Hello,
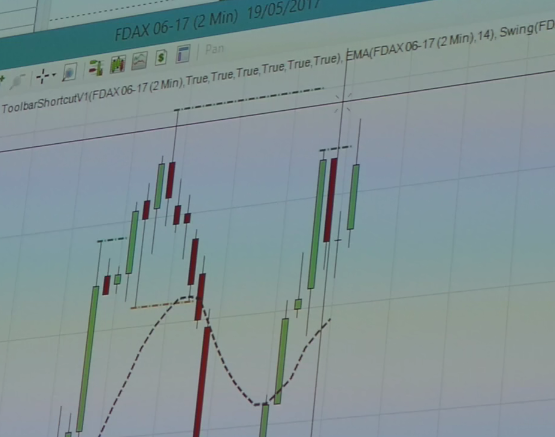
I reuse the original code, but used the William’s 3 bar indicator in order to identify the high/low acting as support/resistance in order to filter out the number of lines drawn. The outcome is better than the original version in my opinion, at least for daily/weekly charts on stock (what I was focus on). Code can still be optimized though, I’m not a pro coder.
DEFPARAM CalculateOnLastBars = 100
Maxbars=100

if barindex=0 then

HIL=0
LOL=close*10
refbar=0

endif
//William's indicator
counter=1
ii=0
jj=ii+1
total=0
while counter<4 do
total=total+1
if (low[jj]>=low[ii]) and (high[jj]<=high[ii]) then
//inside bar
jj=jj+1
else
counter=counter+1
ii=ii+1
JJ=ii+1
endif
wend
bas=lowest[total](low)
haut=highest[total](high)

if close crosses over haut[1] then
reff=bas

endif
if close crosses under bas[1] then
reff=haut

endif


//Finding the low/high when the indicator changes of direction
If close crosses over reff then
refbar=barindex

if refbar[1]<>0 then
lookbackL=max(1,refbar-refbar[1]+1)
LOL=lowest[lookbackL](low)
for i=0 to lookbackL
if low[i]=LOL then
savedbarL=barindex[i]
endif
next

endif

elsif close crosses under reff  then
refbar=barindex
if refbar[1]<>0 then
lookbackH=max(1,refbar-refbar[1]+1)
HIL=highest[lookbackH](high)
for i=0 to lookbackH
if high[i]=HIL then
savedbarH=barindex[i]
endif
next

endif
endif

//For the latest data on the chart, finding the high/low since the indicator change of direction for the last time, and only if this isn't the last bar which makes new high/low

LastBarOnChart=date=today
if LastBarOnChart then
lookbackH=max(1,barindex-refbar+1)
lookbackL=max(1,barindex-refbar+1)
if high<>highest[lookbackH](high) then
HIL=highest[lookbackH](high)
for i=0 to lookbackH
if high[i]=HIL then
savedbarH=barindex[i]
endif
next
endif
if low<>lowest[lookbackL](low) then
LOL=lowest[lookbackL](low)

for i=0 to lookbackL
if low[i]=LOL then
savedbarL=barindex[i]
endif
next
endif
endif

//deleting support/resistance which are too close

j = 0
valsup = HIL + tolerance*HIL/100
valinf = HIL - tolerance*HIL/100

while j <> maxbars do
if HIL[j] = 0 then//aiuta ad accorciare il ciclo
break
endif
cond1 = (HIL[j] <= valsup and HIL[j] >= valinf)
cond2= (LOL[j] <= valsup and LOL[j] >= valinf)
if cond1 and HIL>HIL[j] then
HIL = HIL
elsif cond1 and HIL<=HIL[j] then
HIL=HIL[j]
endif

if cond2 and HIL>LOL[j] then
HIL = HIL
elsif cond2 and HIL<=LOL[j] then
HIL=LOL[j]
endif


j = j+1
wend

j = 0
valsup = LOL + tolerance*LOL/100
valinf = LOL - tolerance*LOL/100

while j <> maxbars do
if LOL[j] = 0 then//aiuta ad accorciare il ciclo
break
endif
cond1 = (LOL[j] <= valsup and LOL[j] >= valinf)
cond2= (HIL[j] <= valsup and HIL[j] >= valinf)
if cond1 and LOL<LOL[j] then
LOL = LOL
elsif cond1 and LOL>=LOL[j] then
LOL=LOL[j]
endif

if cond2 and LOL<HIL[j] then
LOL = LOL
elsif cond2 and LOL>=HIL[j] then
LOL=HIL[j]
endif


j = j+1
wend


//keeping in memeory the latest support/resistance

once resistancecount=1
if  HIL<>lastresistance then //barindex>lastdrawn and
resistancecount=resistancecount+1
if resistancecount=1 then
resistance1=HIL
lastresistance=resistance1
endif
if resistancecount=2 then
resistance2=HIL
lastresistance=resistance2
endif
if resistancecount=3 then
resistance3=HIL
lastresistance=resistance3
endif
if resistancecount=4 then
resistance4=HIL
lastresistance=resistance4
endif
if resistancecount=5 then
resistance5=HIL
lastresistance=resistance5
endif

if resistancecount=6 then
resistance6=HIL
lastresistance=resistance6
endif

if resistancecount=7 then
resistance7=HIL
lastresistance=resistance7
endif

if resistancecount=8 then
resistance8=HIL
lastresistance=resistance8
endif
endif

once supportcount=1
if  LOL<>lastsupport then
supportcount=supportcount+1
if supportcount=1 then
support1=LOL
lastsupport=support1
endif
if supportcount=2 then
support2=LOL
lastsupport=support2
endif
if supportcount=3 then
support3=LOL
lastsupport=support3
endif
if supportcount=4 then
support4=LOL
lastsupport=support4
endif
if supportcount=5 then
support5=LOL
lastsupport=support5
endif

if supportcount=6 then
support6=LOL
lastsupport=support6
endif
if supportcount=7 then
support7=LOL
lastsupport=support7
endif
if supportcount=8 then
support8=LOL
lastsupport=support8
endif


endif


drawHline(resistance1) coloured(0,200,0)
drawHline(resistance2) coloured(0,200,0)
drawHline(resistance3) coloured(0,200,0)
drawHline(resistance4) coloured(0,200,0)
drawHline(resistance5) coloured(0,200,0)
drawHline(resistance6) coloured(0,200,0)
drawHline(resistance7) coloured(0,200,0)
drawHline(resistance8) coloured(0,200,0)

drawHline(support1) coloured(200,0,0)
drawHline(support2) coloured(200,0,0)
drawHline(support3) coloured(200,0,0)
drawHline(support4) coloured(200,0,0)
drawHline(support5) coloured(200,0,0)
drawHline(support6) coloured(200,0,0)
drawHline(support7) coloured(200,0,0)
drawHline(support8) coloured(200,0,0)
drawtext("▼",savedbarH,HIL+HIL*1/100)
drawtext("▲",savedbarL,LOL-LOL*1/100)

return