Hi all,
Disclosure first: this is our own project, so take it with the usual grain of salt. We built a strategy library for ProRealTime users and I would like your feedback, because you know ProBacktest better than anyone.
Link: https://agent.profitalgos.com/en/ (free account, no card)
WHAT IS IN IT
– 12,483 strategy variants from 41 strategy families, 448,697 test results in total
– 8 markets: US Tech 100 (Nasdaq), US 500 (S&P), Wall Street (Dow), Germany 40 (DAX), FTSE 100, Japan 225 (Nikkei), Spot Gold and EUR/USD
– 5 timeframes on every market: 10m, 30m, 1h, 4h and daily (Nasdaq also has 15m): 41 market/timeframe series
– History: IG prices (the same feed ProBacktest uses), extended backwards with Dukascopy data: from 2018 for the indices, 2016 for the Nikkei and 2009 for gold. The daily series are IG data only (about 7 years)
IT GETS BETTER EVERY DAY
This is not a one-off dump. New strategies are added every day and more tests are run over time, so the library, and the evidence behind each strategy, grows the longer it runs. More ProBacktest comparisons are added as we get to them, and strategies move up or down the quality list as the numbers change.
OPEN CODE, NO HIDDEN FILES
The code is plain ProBuilder text. No compiled indicators, no hidden indicator files, no black boxes: every rule, every parameter and every comment is there for you to read, so you can understand exactly how a strategy works or adjust it yourself. You get the full code of one of our best strategies when you create the free account (it is not posted here). The code for the rest of the library is part of a paid Premium tier, I want to be upfront about that.
THE PROBLEM WE WANTED TO SOLVE
We were tired of backtests that look great in a Python engine or on someone’s screenshot and then do not reproduce when you paste the code into ProBacktest. So we do this:
1. Every strategy is tested in our own engine, on IG price data, with a spread, and then ranked on a strict quality list (many trades, a smooth curve, small drawdown compared with the gain, positive in most years, still working on the real IG-only part).
2. For the strategies we care most about, the exported ProRealTime code is run in ProBacktest, the “Detailed report” is uploaded, and the two trade lists are compared trade by trade. The strategy gets a label: green (matches), yellow (passes with deviations) or red (does not match).
Honest status: so far 58 such ProBacktest comparisons are done, 34 green, 16 yellow and 8 red, covering 48 different strategies with a green or yellow label. The rest of the library is engine-tested only, and it says “Not PRT tested” on each of those. Strategies that fail are shown openly instead of being hidden, and our own “Best” list is deliberately strict: right now only a handful of strategies pass all the criteria.
THE FREE STRATEGY: RSI(14) BREAKOUT WITH A RATCHET TRAILING STOP, US TECH 100, 1H, LONG ONLY
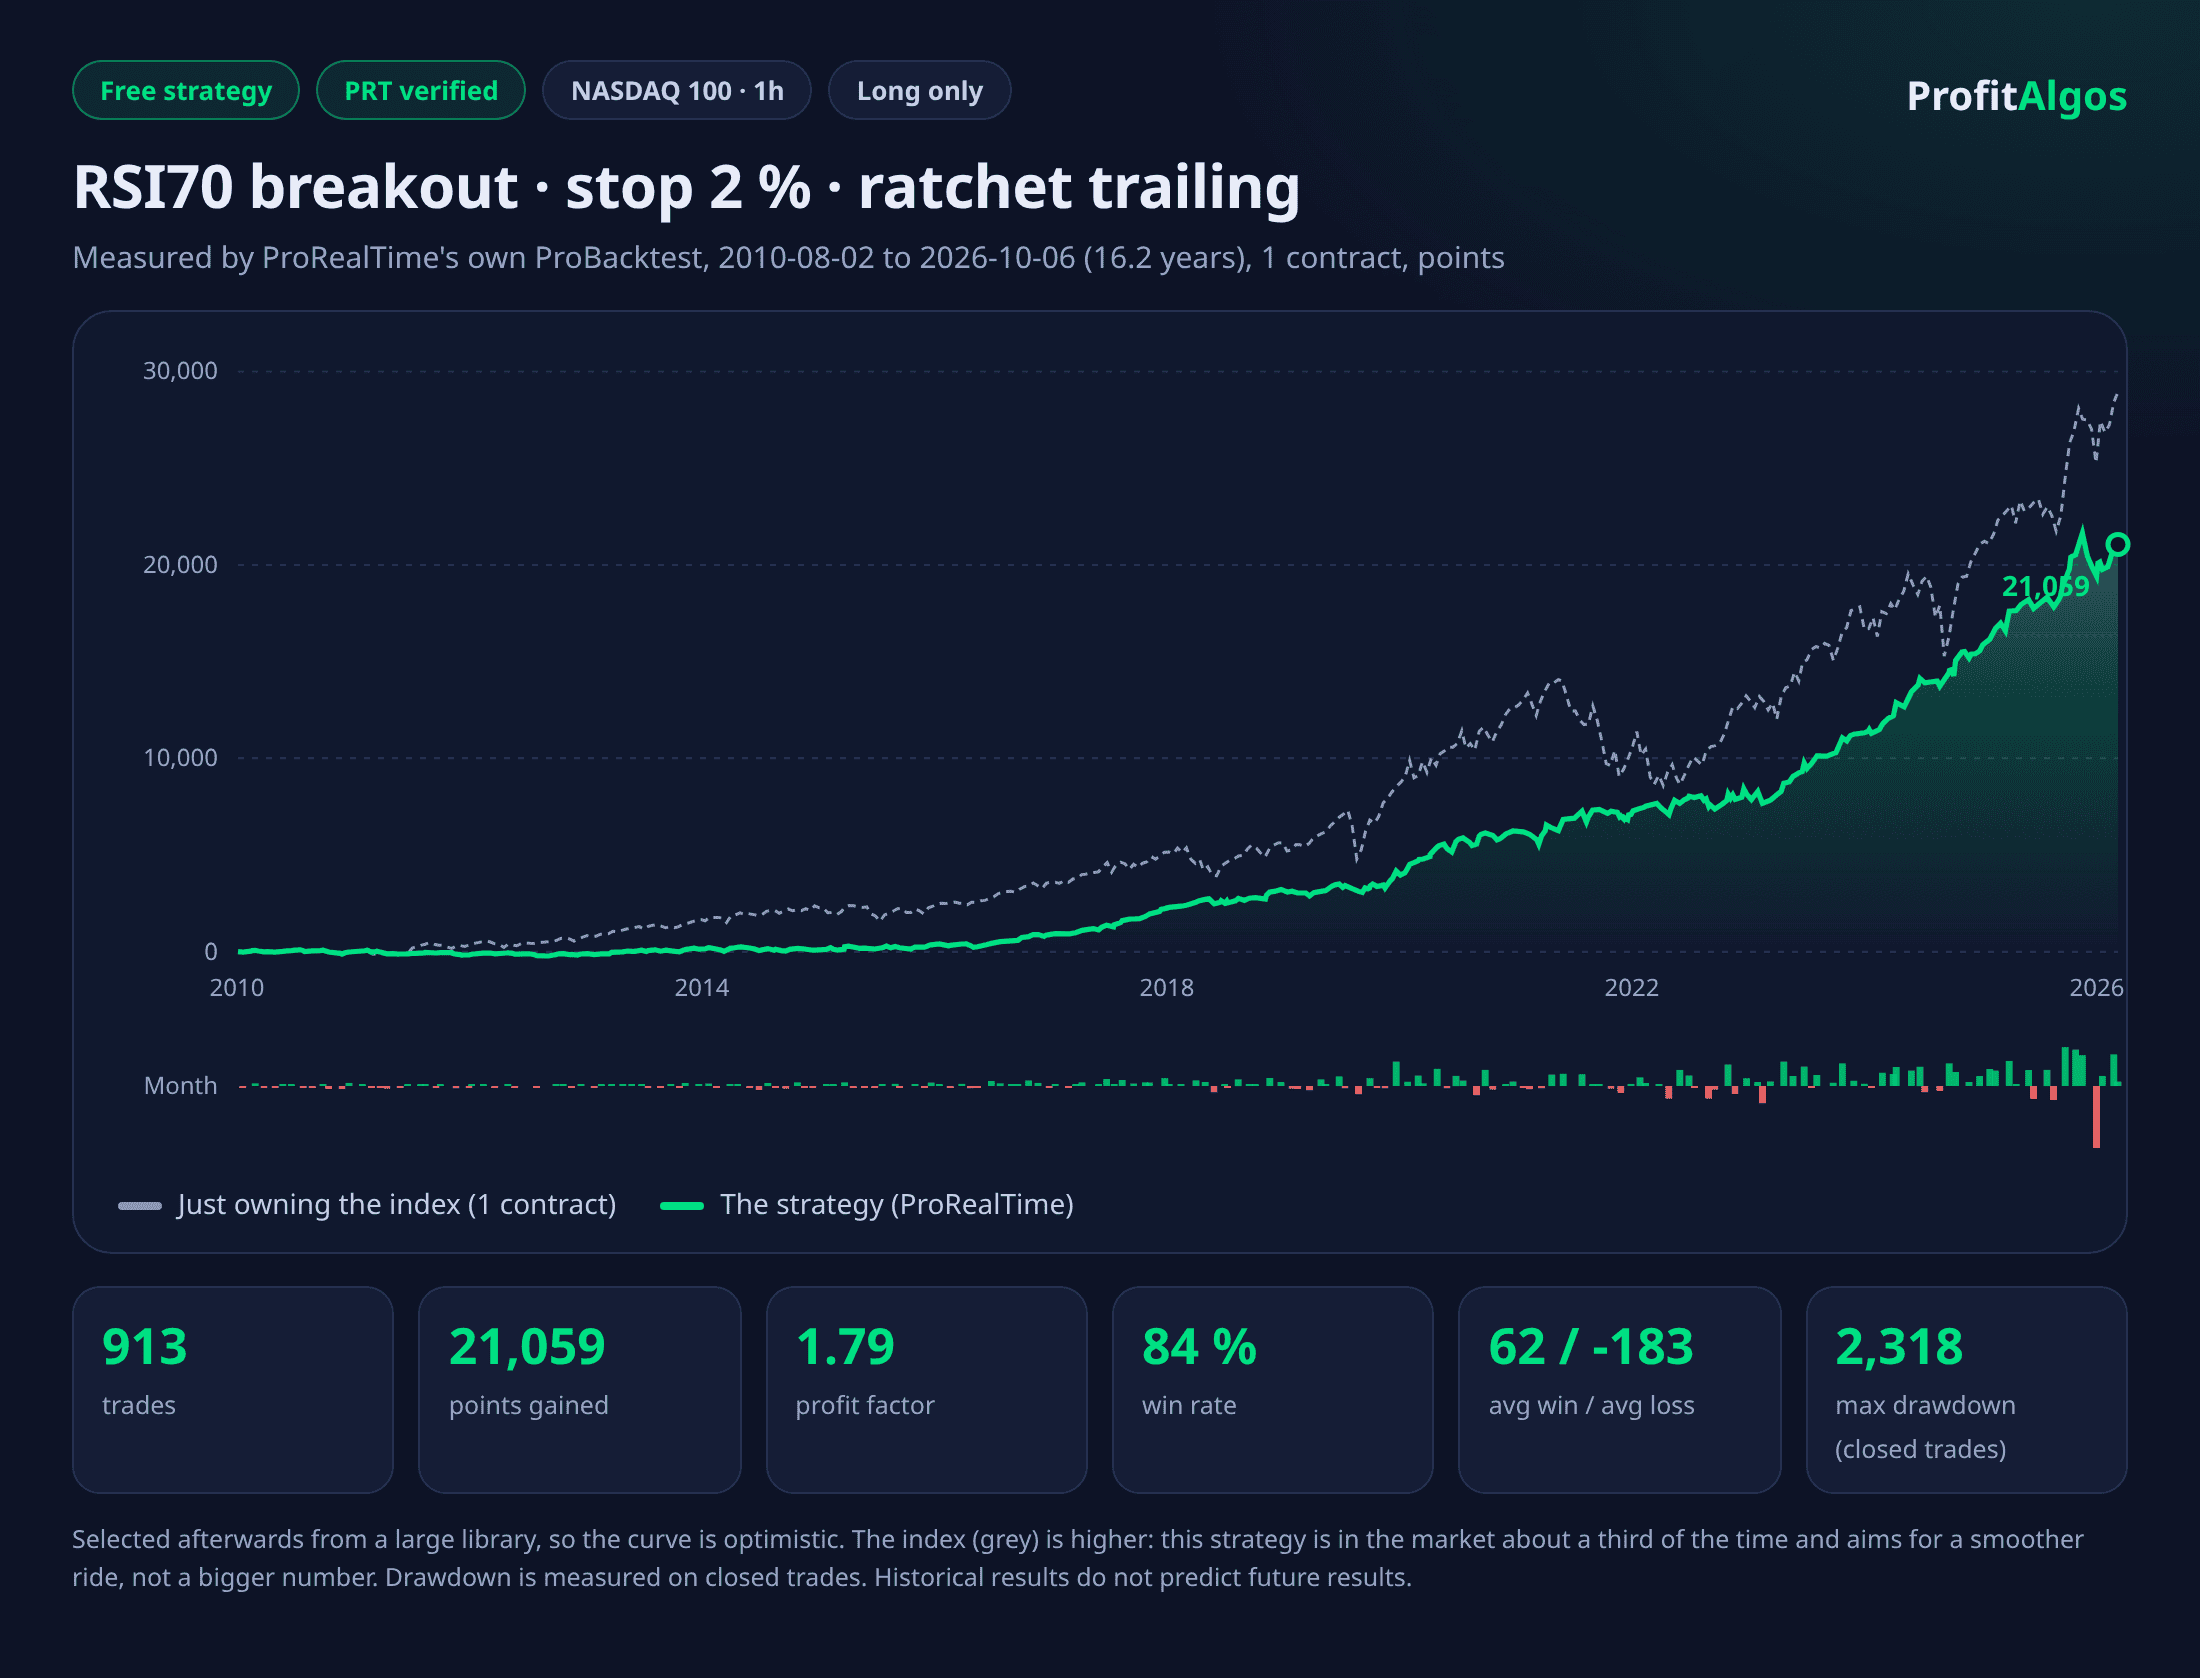
(Attached image 1: the strategy as measured by ProBacktest, with monthly results and key figures.)
The rules in words: RSI(14) crosses above 70, buy at market, 2 % initial stop. A “ratchet” trailing stop starts once price is one ATR-based distance above the entry and then follows the highest close; it can only move up. Long only, 1 contract, one position at a time, no profit target.
All the data, measured by ProBacktest itself (not by our engine), 2010-08-02 to 2026-10-06, 1 contract, results in points:
– Trades: 913 (about 56 per year, average hold 35 bars)
– Total gain: 21,059 points
– Profit factor: 1.79
– Win rate: 83.9 %
– Average win / average loss: 62.4 / -183.3
– Best / worst trade: +923.7 / -610.3
– Max drawdown: 2,318 points (closed trades)
Please read it honestly. The grey dashed line in the picture is simply holding the index, and it is higher: this is not a “beat buy and hold” strategy, it is in the market about a third of the time and aims for a smoother ride. The drawdown is measured on closed trades, so it is lower than a drawdown that follows the price during open trades. And it was picked afterwards from a large library, so the curve is optimistic by construction. Look at the key figures, not just the curve.
DOES THE CODE DO WHAT OUR ENGINE SAYS?
(Attached image 2: the parity test against ProBacktest.)
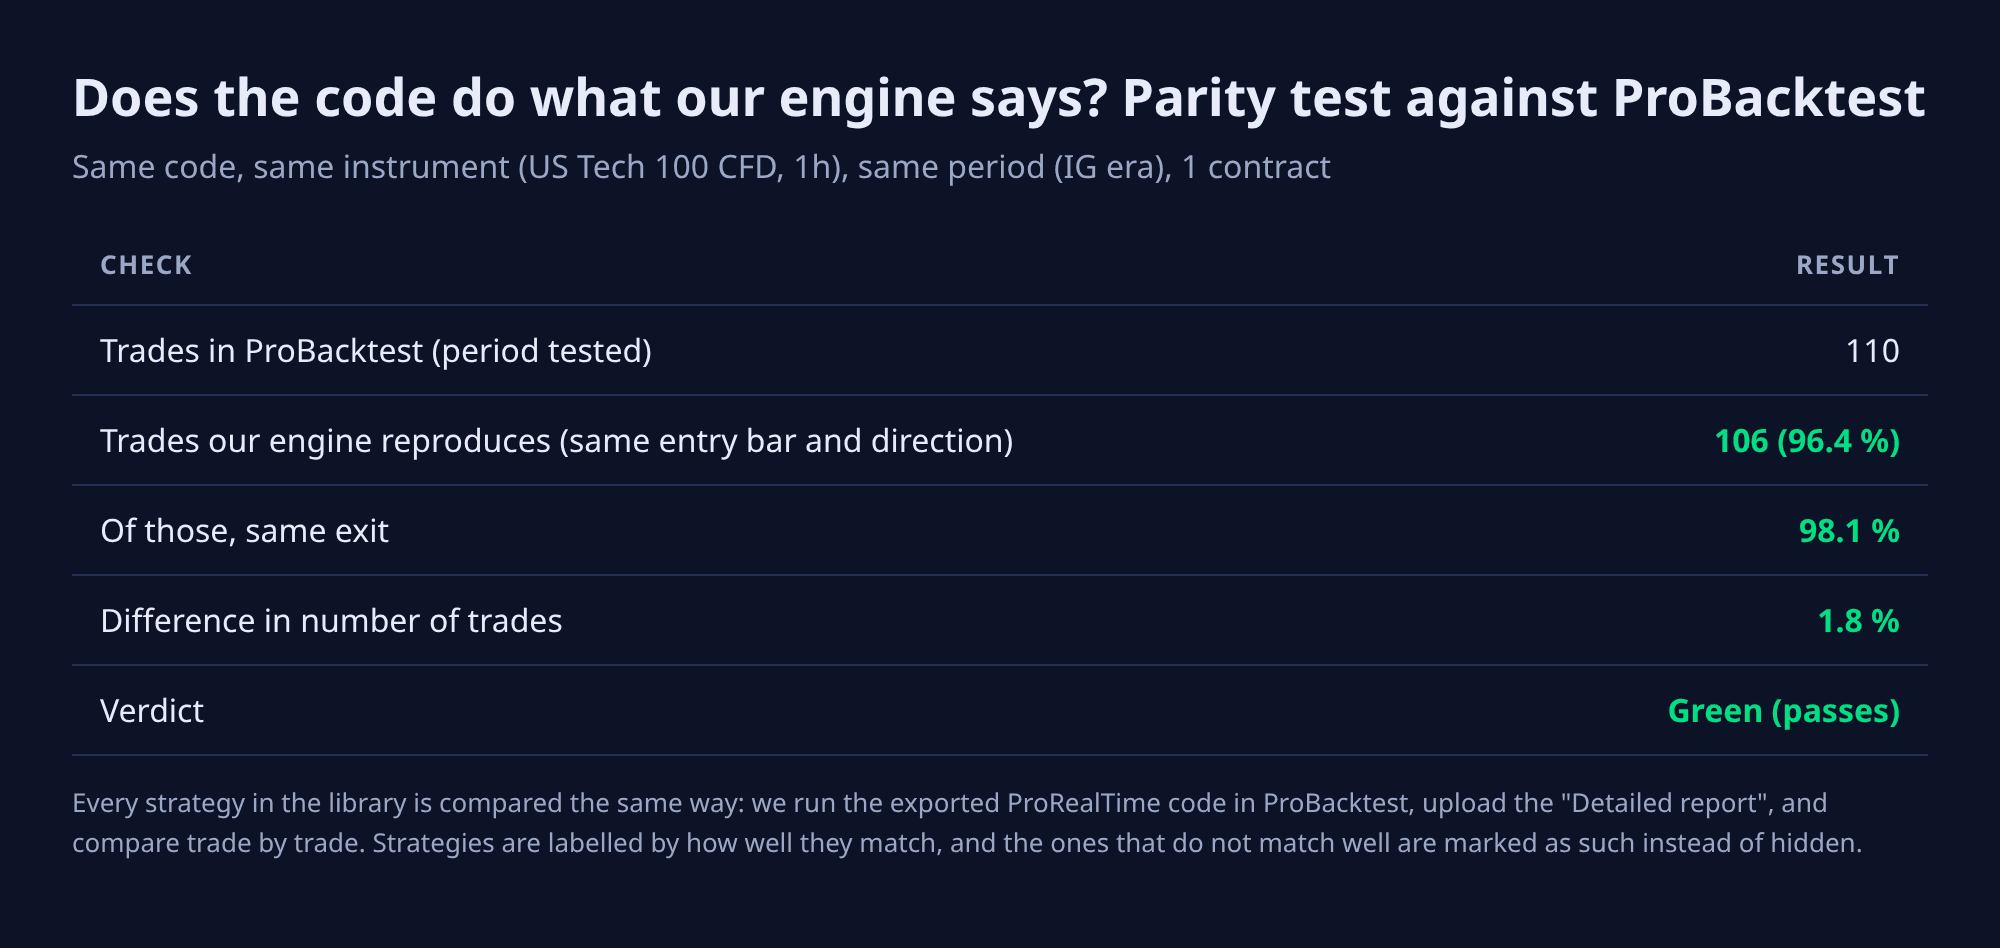
On the IG-era part, ProBacktest produced 110 trades; our engine reproduced 106 of them (96.4 %) with the same entry bar and direction, and 98.1 % of those had the same exit. The difference in trade count was 1.8 %. That is what “green” means in the library.
THINGS WE LEARNED THAT MIGHT SAVE YOU TIME
– Start the ProBacktest period at least two weeks into the series. ProRealTime has warm indicators through PRELOADBARS while a cold-start engine does not, and the first trades differ otherwise.
– If you code an ATR trailing stop in ProBuilder, check how AVERAGETRUERANGE is scaled on your instrument and whether you round the distance to whole points. The rounding changes the stop level and therefore which trades exist.
– Check which hour the “Hour” in your code refers to: it is the bar’s closing time, which matters for any time-of-day filter.
– Stops fill with no extra spread in ProBacktest; entries and market exits carry it. We had to model that to get the trade lists to line up.
– We tested on CFD and spread-betting prices, not futures, so numbers will differ if you trade the future.
WHERE TO GET IT
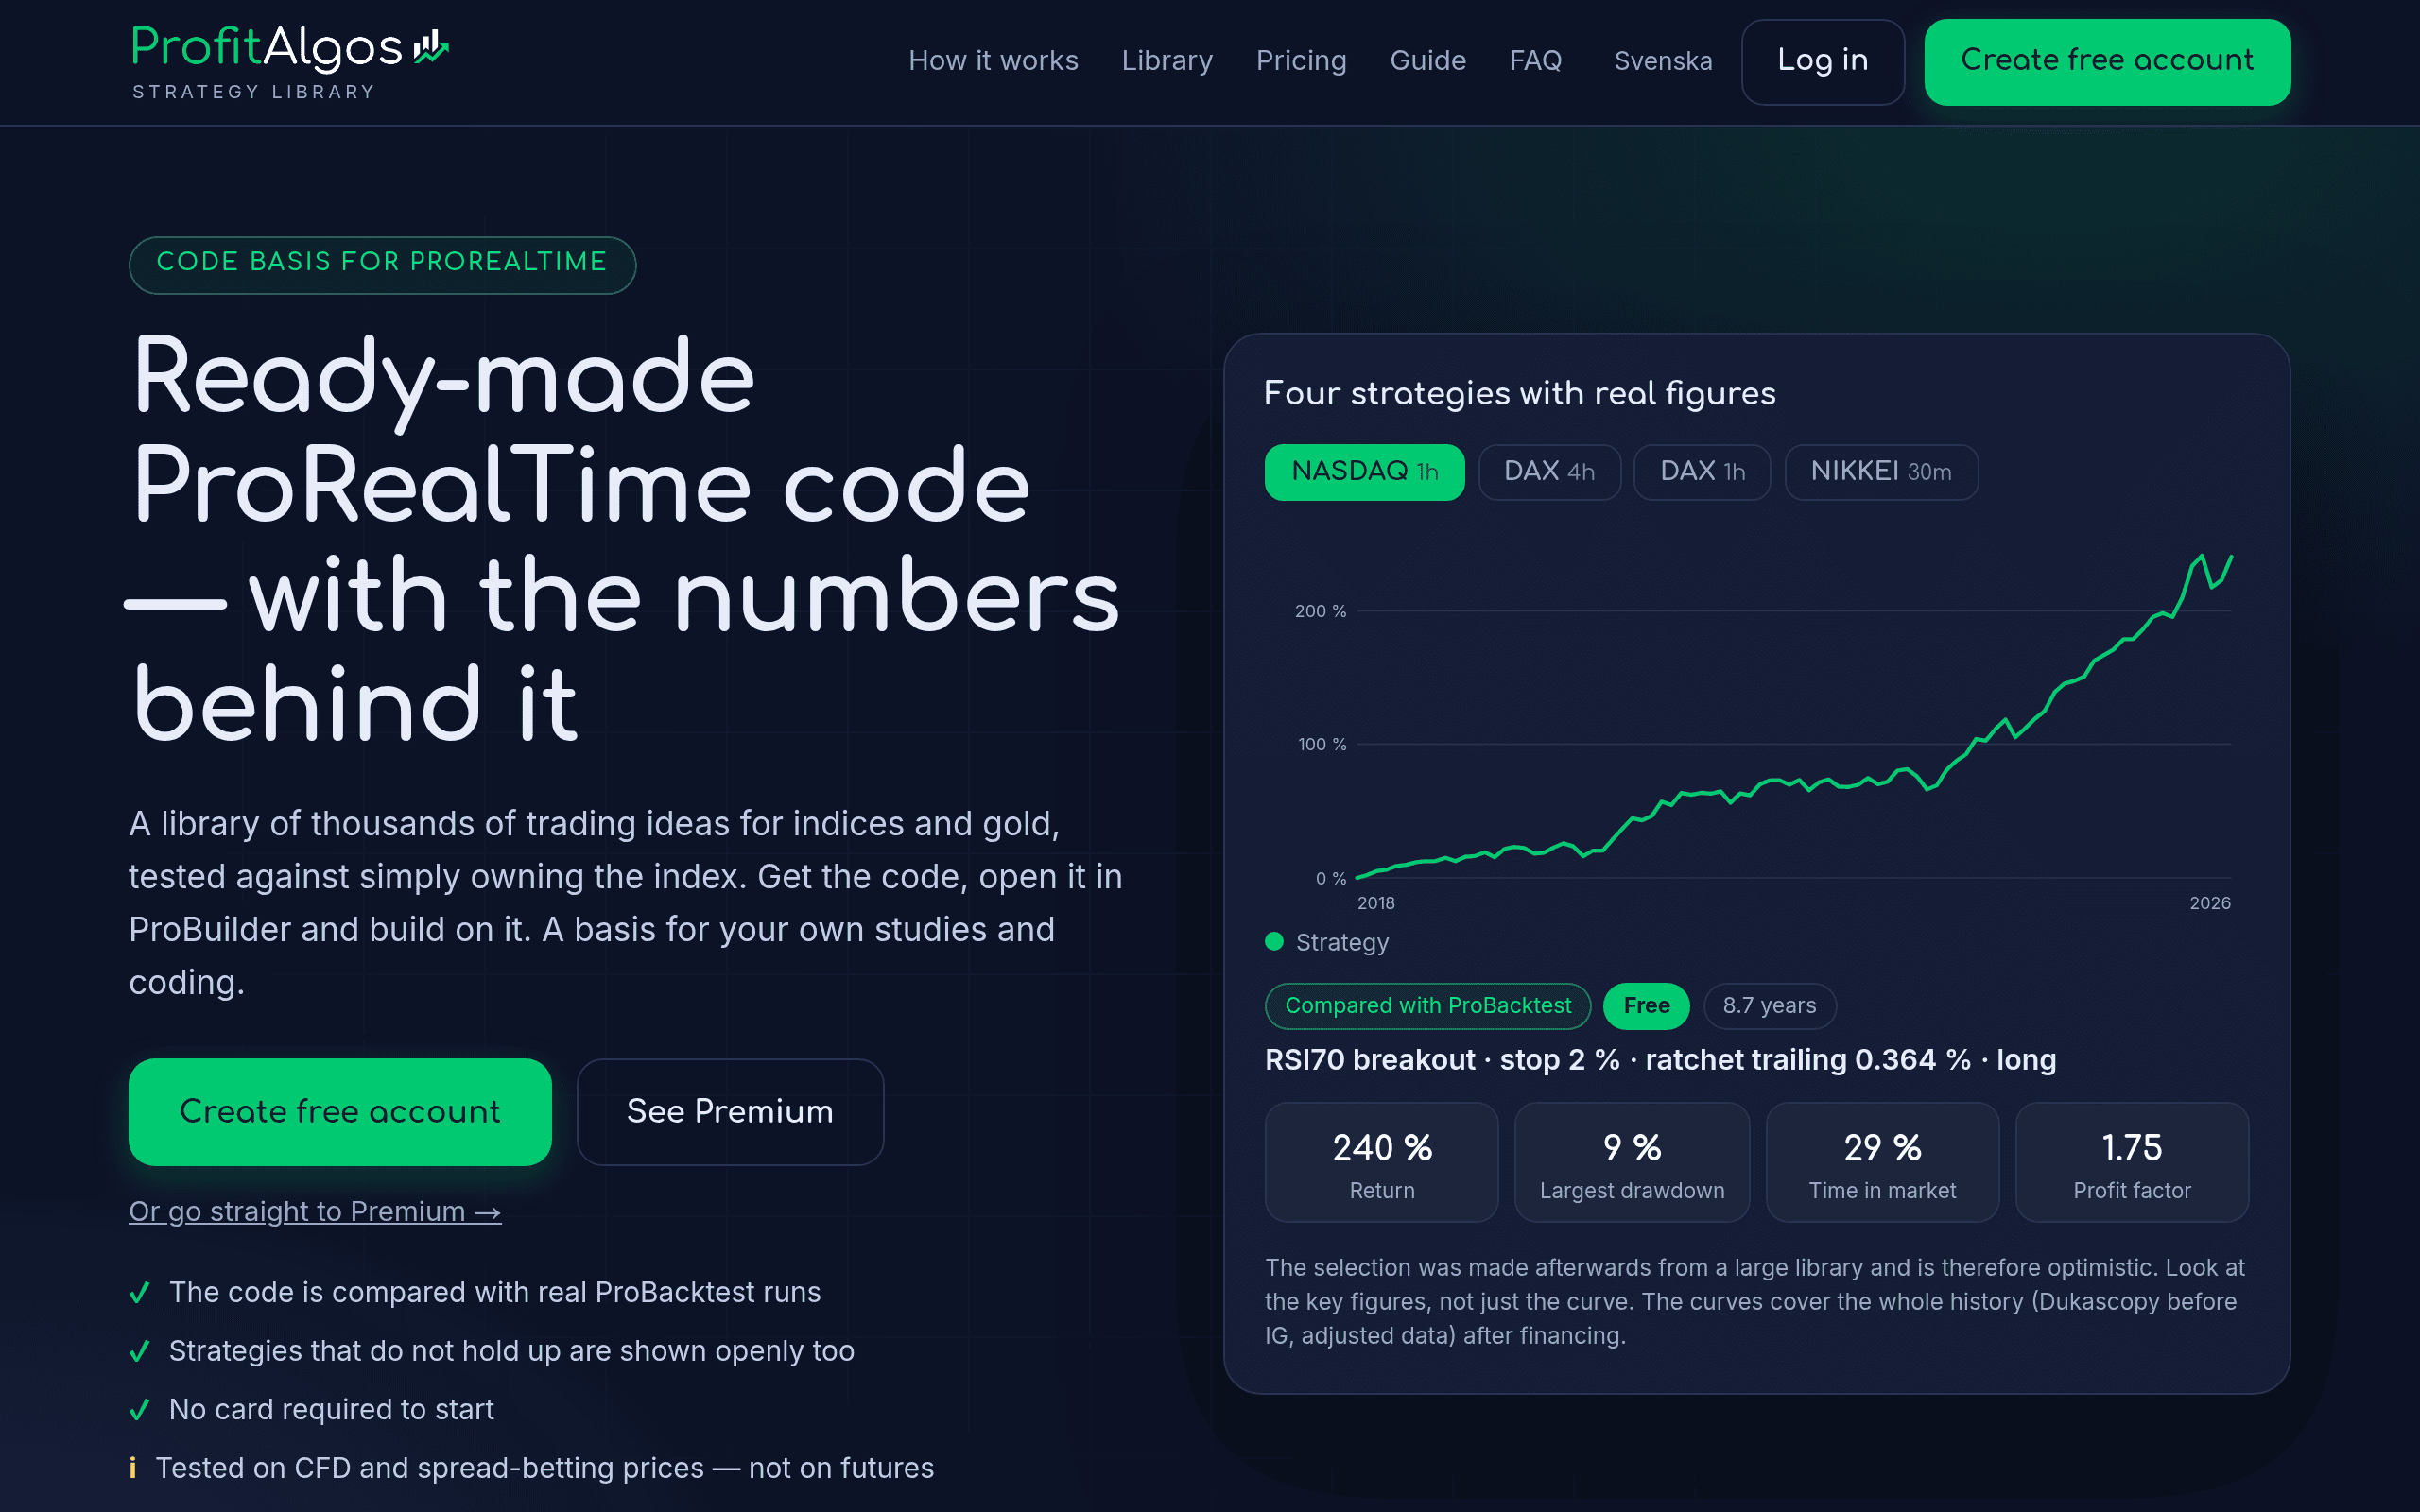
(Attached image 3: the library start page.)
Creating an account is free (no card). You get the full commented code for the strategy above, plus the key figures for the whole library: drawdown, profit factor, subperiod results and the parity label for each strategy.
Link: https://agent.profitalgos.com/en/
WHAT I WOULD LOVE TO HEAR FROM YOU
– Which markets and timeframes would be most useful to you?
– If you run the free strategy in ProBacktest on your own data feed, how close does it get to the numbers above?
– Anything in how we compare trade lists that you think is flawed.
Educational material, not investment advice. Historical results do not predict future results. Leveraged products can lose money quickly.