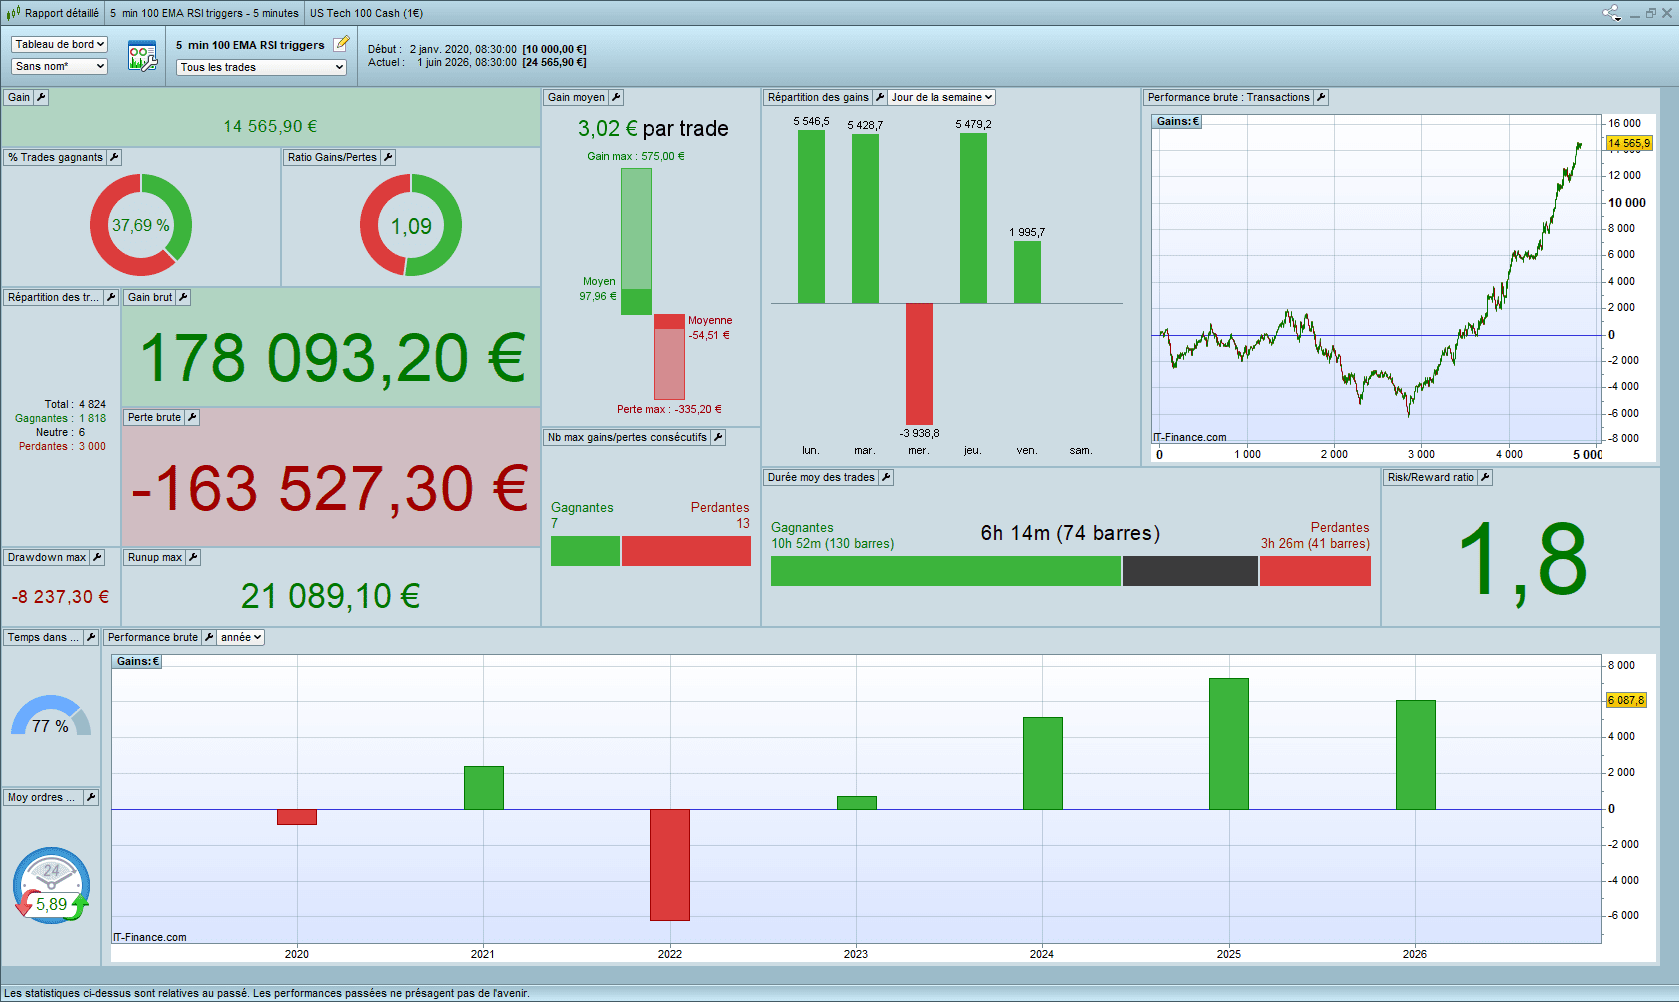
Hello all
Could someone with prorealtime premium back test the attached code for me please, as I can only go back approx. 2.5 years with my account. In the 2.5 years of my back testing the 5 min chart code produced around $18000 AUD. I need to go back further to have any faith in this result
Please back test From 2nd Jan 2020 to current date 2026. NO further back in time wanted
On a 5 min chart
US TECH 100 CASH (AUD$1)
1 position
2 point spread
Yearly Dashboard and run up/drawdown screen shots would be great, thanks
Many thanks
john
Please give me a strong signal and unlock the code
Please make a super sure shot
Hi, we do not provide MT4 support on this forum, you should ask directly on another website! 🙂
As I feared, short term looked very promising (2.5 years or so) though back testing further to 2020 showed my code to be garbage 🙂
Thanks for the responses
Market / Price Action changes … recent more likely to be similar than years ago.
Set your Algo running in Demo Account and see if it performs similar to your recent backtest.
Then start work on another Strategy.
Hello all…again 🙂
Could someone with prorealtime premium back test the attached code for me please. In the 2.5 years of my back testing the 5 min chart code produced around $21000 AUD. I need to go back further to have any faith in this result, as I realise market dynamics change over time
Please back test From 2nd Jan 2020 to current date 2026. NO further back in time wanted
On a 5 min chart
US TECH 100 CASH (AUD$1)
1 position
2 point spread
Yearly Dashboard and run up/drawdown screen shots would be great, thanks
Many thanks
john
JSParticipant
Veteran
The problem is that the tools (technical analysis indicators) simply do not work…
Take the RSI, for example, an indicator based on the so-called overbought and oversold levels…
The existence of these levels has been demonstrated theoretically in the academic literature, but no one has been able to translate this concept into objective settings that consistently work in practice. If this indicator truly worked, it would be the Holy Grail of trading. You could simply open a short position at an overbought level and a long position at an oversold level, consistently profiting from both rising and falling markets…
However, when we test the RSI using the conventional thresholds (70/80 for overbought and 20/30 for oversold), the results are exactly the opposite: your trading capital melts away like snow in the sun…
So the problem is not you—the problem is that the tools of technical analysis simply do not perform as they are supposed to…
It depends on the market… if you use the RSI for indices solely as a buy signal, it works very well.
JSParticipant
Veteran
Using only the RSI…?
Could you elaborate a little on what you mean by “very well”…?
It took me a long time to figure this out myself, and I don’t want to make it too easy for anyone…
Ultimately, you can use whatever you want: RSI, Donchian, Bollinger Bands, moving averages, or even no indicators at all… you just need to know when to buy and when to sell. Two things are crucial: the timing and, ideally, a downturn. Logically, you sell on an upturn, however you define that. Let’s take the RSI in its standard configuration and use it to look at, for example, the NASDAQ across different timeframes. If we notice something unusual in certain timeframes… and then optimize a specific point in time or time period, we already have a working system that can, of course, be further refined.