I am working on this myself for a while now, and still don’t grasp it fully. It is for that reason that I would not be able to cough up the text from my AI (below). Hopefully one day I will be able to utilize it.
Please note : although not recognizable from the AI text, it *is* the explanation as thorough as possible, but it will require more time (to spend on AI) and also more diverse examples.
Btw, this is not about slippage at all; it is merely about the unavailability of “market” hence buyers (sellers). This, while MNQ and NQ *have* to be connected / synched at all times because they bear the same price.
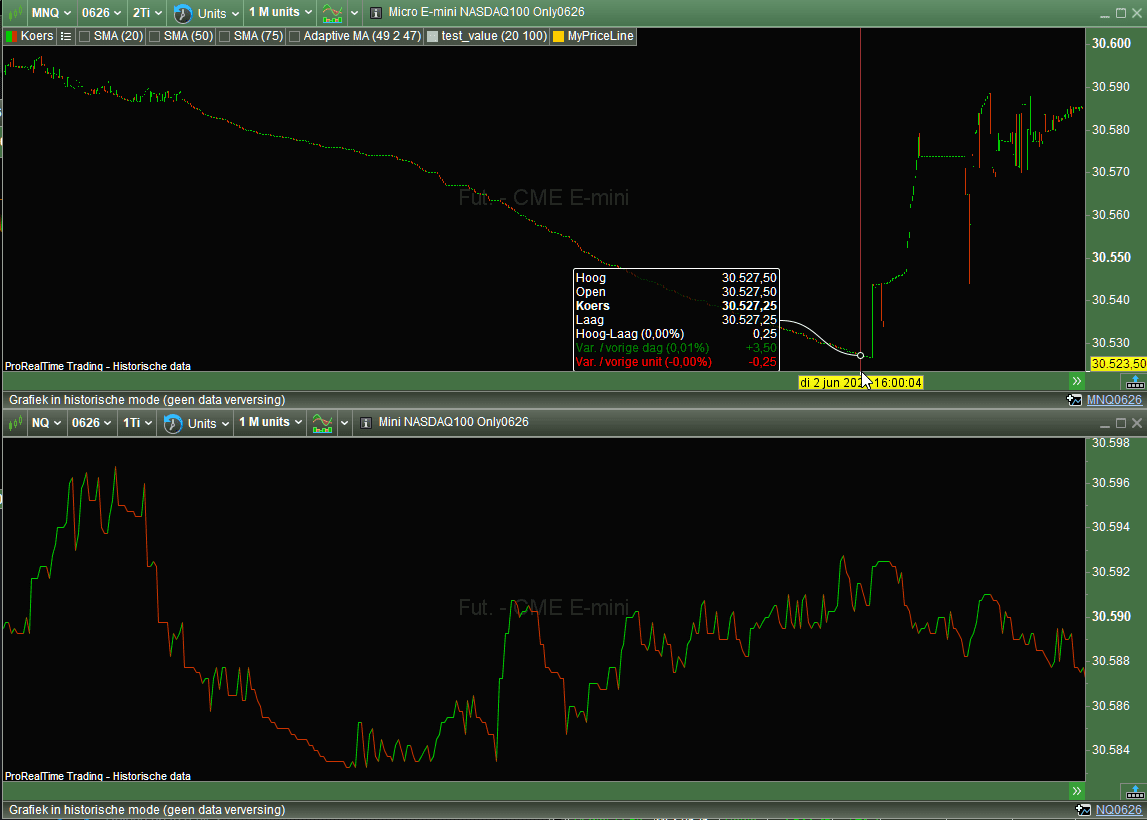
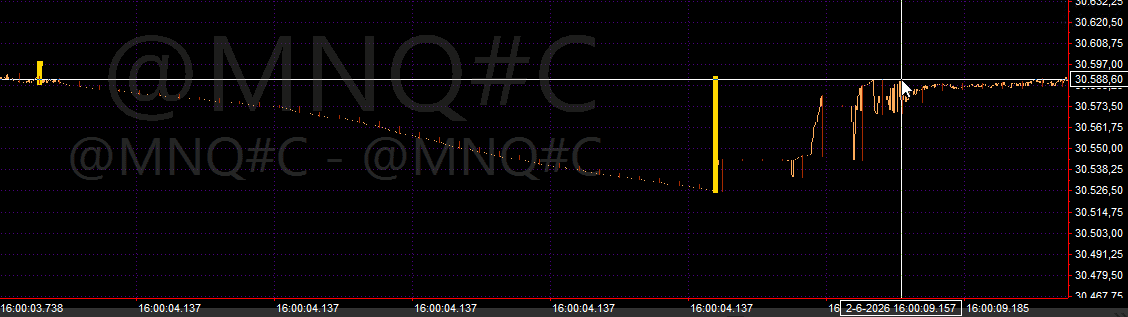
First picture : Both are time aligned and MNQ is 2 tick bars (could not reach it with 1M bars with 1 tick), NQ is 1 tick bar (has less ticks so could reach it with 1M bars, while trying not to miss any detail).
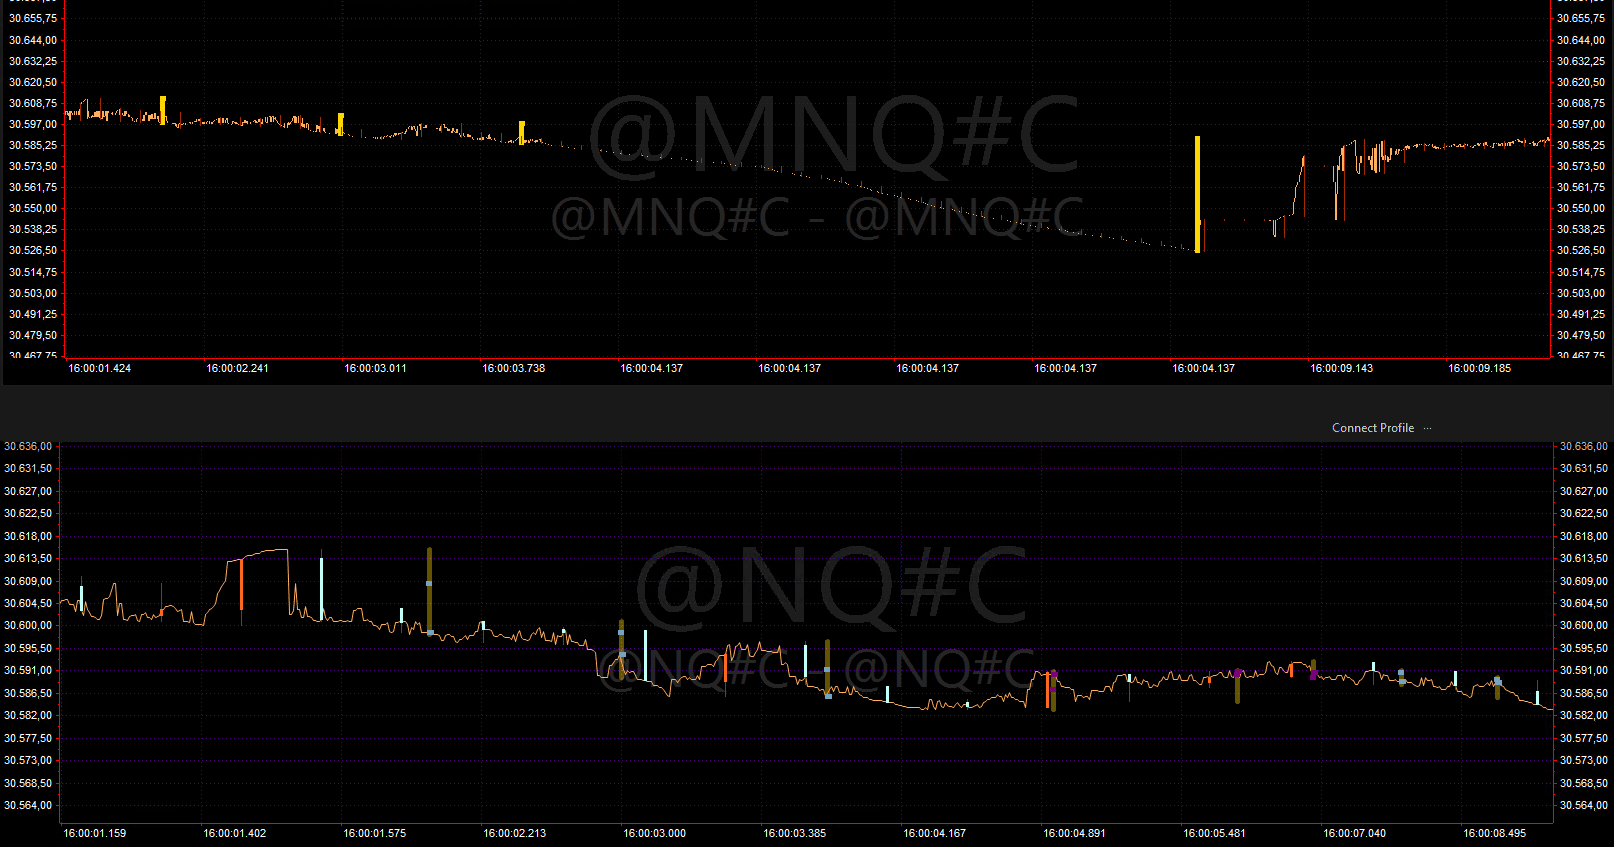
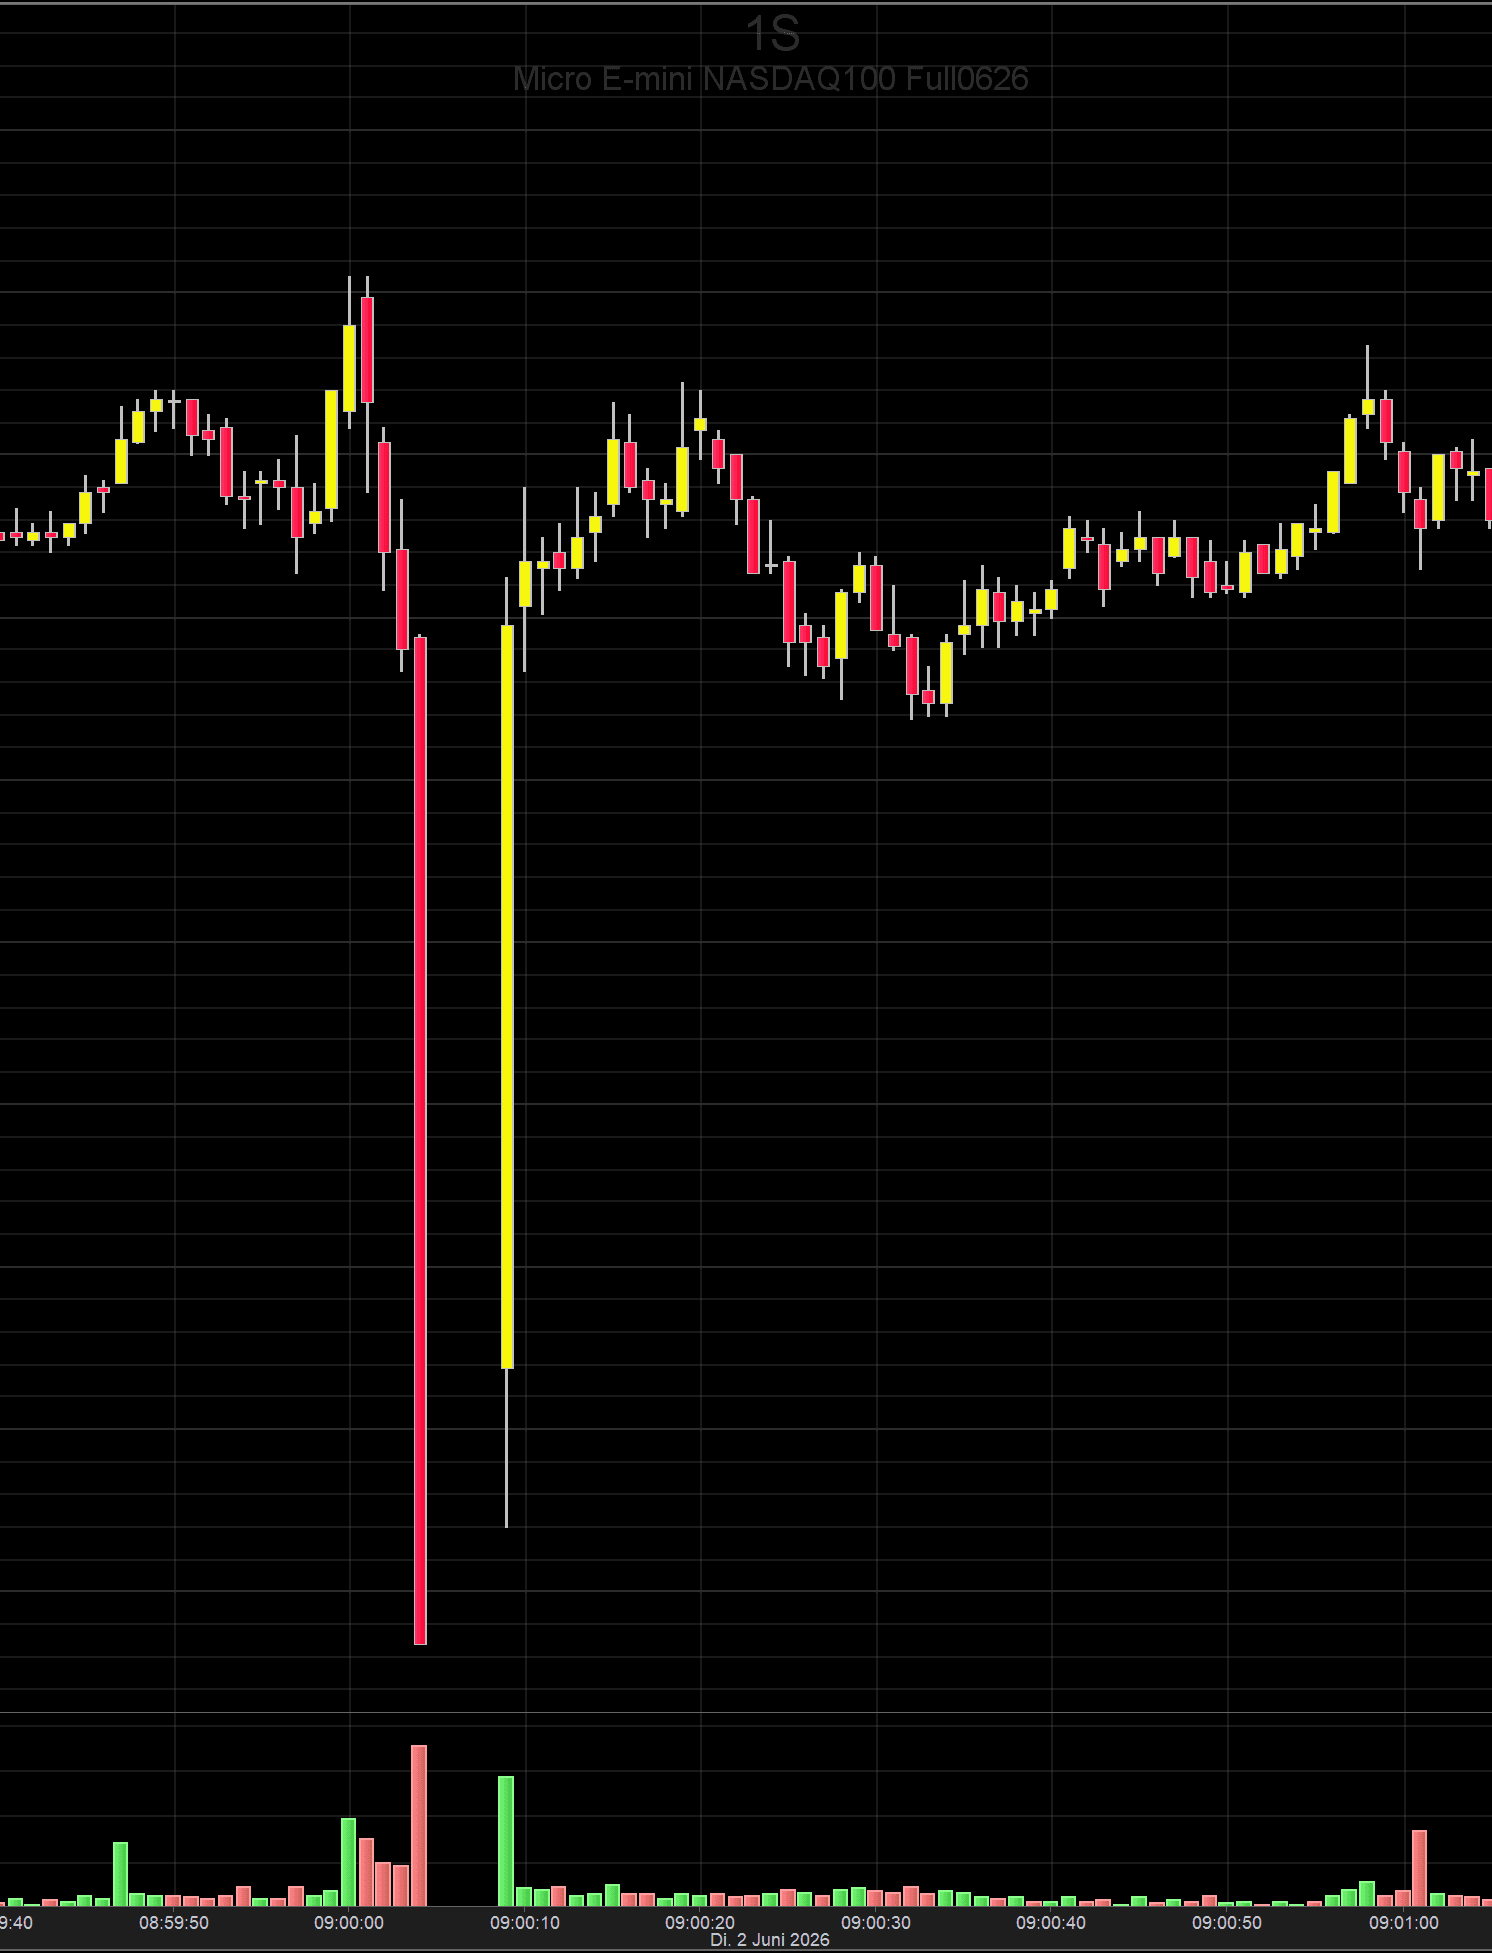
Second picture : This is 1 tick all the way, as good as possible time aligned because again MNQ (top) bears way more ticks (tick = a price change = last price = order buy or sell).
The key point is that what shows from MNQ is not dozens of price changes, but only one (also see AI text below with the notice that I had to teach that fact first). But envision : the ticks per 1 tick can only be shown separately on the time axis when the time is repeated (16:00:04.137 here).
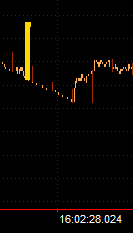
Though AI tries its best to explain the situation, I am not satisfied with it. However, I can ensure you that whatever it is what happens, is perfectly common and with that – normal. See for example 2.5 minutes later where it happens again, though in smaller proportion.
These are not glitches in the data (unless it is a glitches at CME) which can already be told from the completely different data streams used by PRT and what I use myself for analysis (payed data of a best quality).
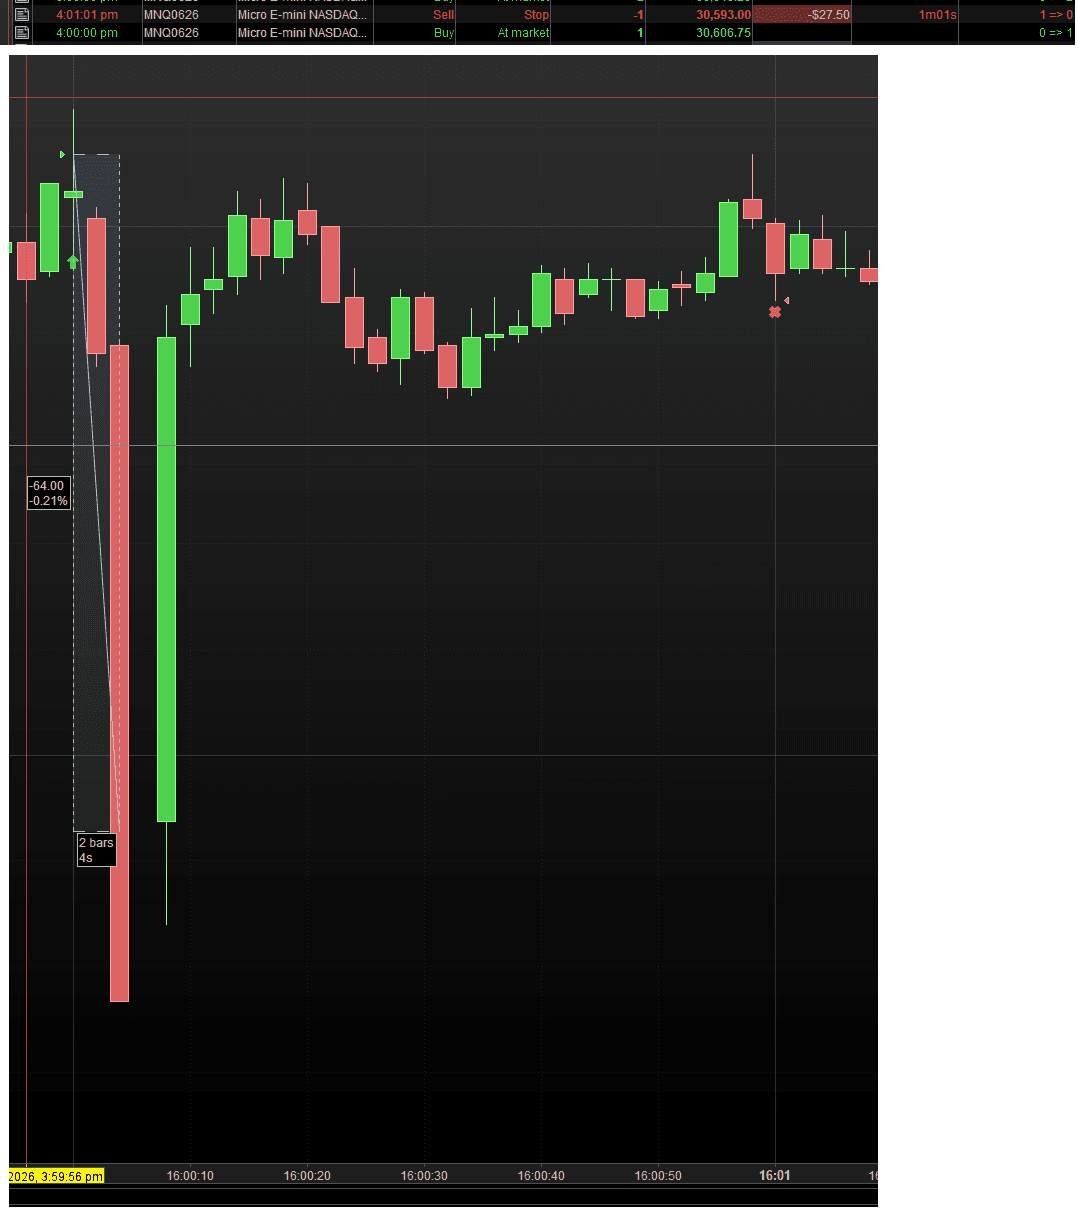
Although it happens for real visually (like your own screenshot), it is not tradeable that I can prove (so far). To understand that somewhat, look at the 4th picture and the horizontal hair line. It starts somewhere and it ends at the price where it started and in between no trades possible because there “is” nothing (this is my translation of it, also based on experience). Notice though that the program code is perfectly able to catch the prices in between. But would I say “go for it” then the price I’ll get is the price at the first new (real) time. This is where the higher yellow bar peaks out, at the top of it, but incurred for by the price you see more to the right (at say 16:00:09.143).
We can well say that this compares to your Stop Out at 16:01 at probably in-bar at the same time.
AI’s explanation below which I thus do not dig. Maybe tomorrow.
Note : A lot here is about NQ being 10 times the value of MNQ. In the explanation below this should be read in between the lines because it is the (earlier derived) context.
————————————–
This is a MNQ-only liquidity sweep.
The “smooth” MNQ line is not a slow price move. It is many individual MNQ trade prints occurring in one burst, essentially at the same timestamp:
16:00:04.137
16:00:04.137
16:00:04.137
...
Because the chart is tick-based, it must draw each trade event separately. So it creates a diagonal-looking path, but in real time this was basically one execution burst.
Mechanism:
Aggressive sell order / stop cascade hits MNQ
→ resting MNQ bids get consumed level by level
→ each fill creates a tick
→ price prints far lower
→ MNQ then snaps back toward the normal NQ/MNQ relation
The important part from the NQ comparison:
NQ did not do the same thing.
So this was not “the Nasdaq future” genuinely repricing 60 points lower. It was MNQ temporarily trading through its own book.
That also explains the equalizing part better:
The equalizer did not force NQ to follow MNQ down.
Instead, the equalizer was probably:
MNQ gets too cheap versus NQ
→ market makers/arbs buy MNQ / stop selling MNQ / re-quote MNQ
→ MNQ returns toward NQ
So the correction happens mainly by MNQ snapping back, not by NQ copying the spike down.
And yes: the MNQ low print can still be a real trade. But it does not mean the whole NQ/MNQ system accepted that lower price as fair value.
Clean formulation:
MNQ had a local book sweep. NQ remained the reference. The spread temporarily blew out, then MNQ was pulled back into line.