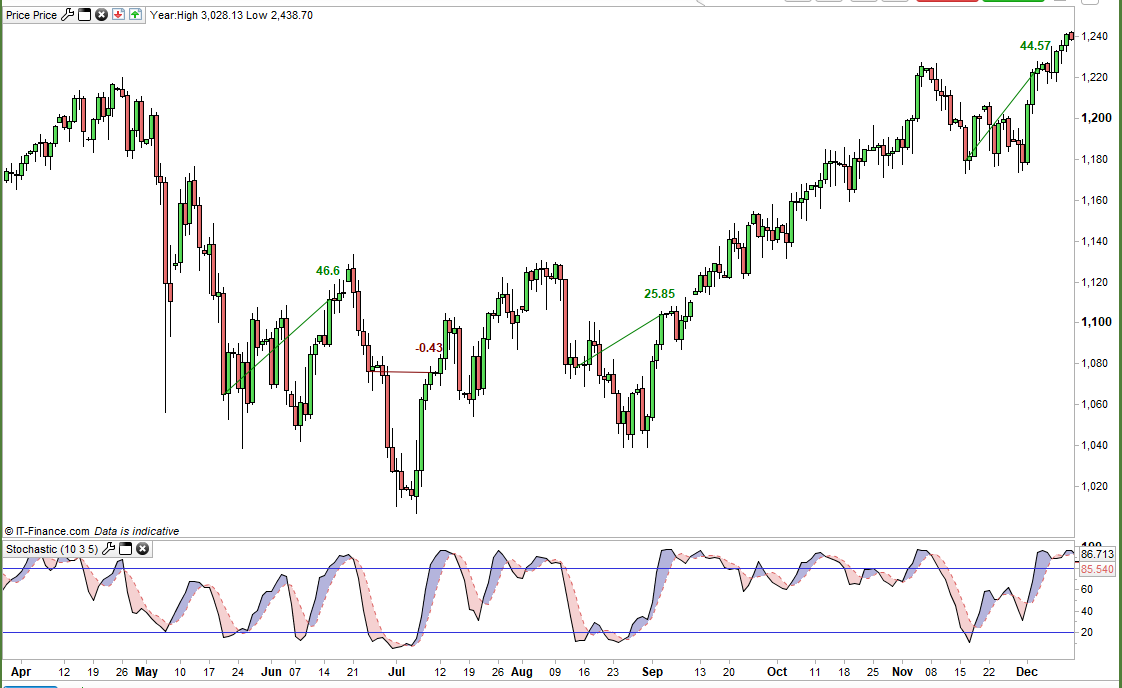
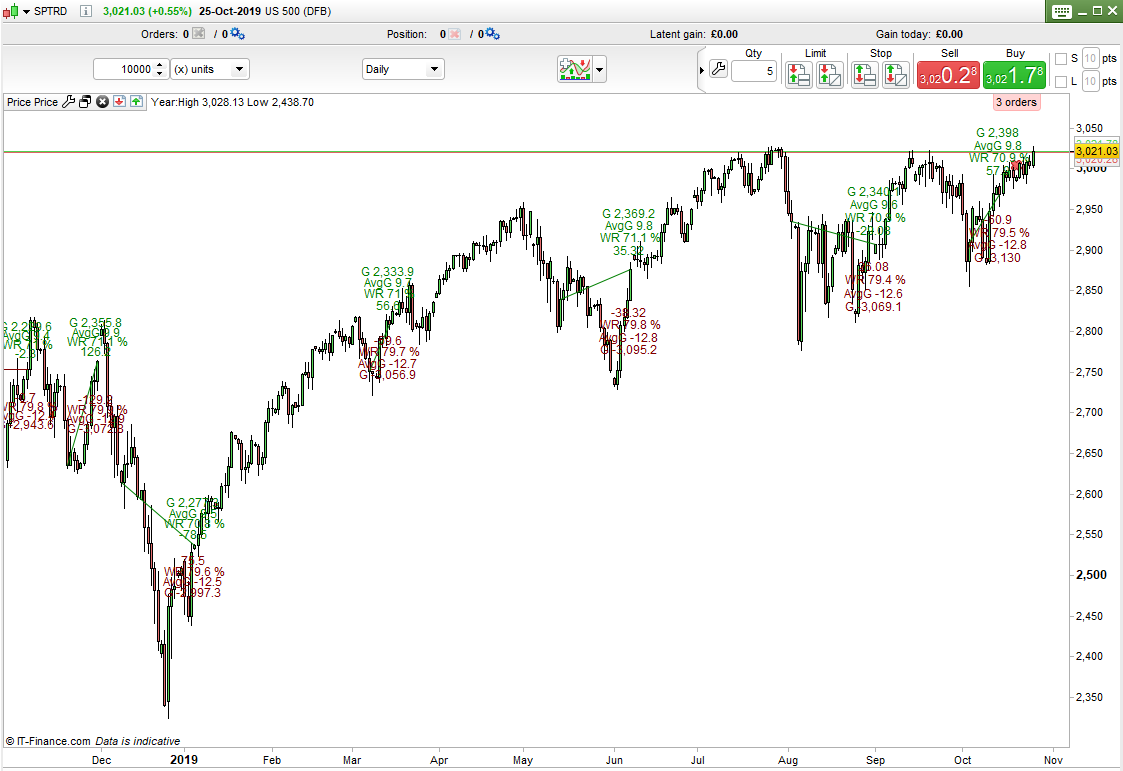
I must be really bored because I developed it a bit further. This version also calculated the returns for going long or short and displays them on the chart. It displays the gain or loss on this trade, the average gain per trade, the win rate for all trades and the total gain or loss for all trades.
- G = Total gain
- AvgG = Average Gain per Trade
- WR = % Win Rate
- Unlabelled = The gain or loss for this trade.
Long trade results are above the candle in green and short trade results are below in red.
Spread = 1.5
StochN = 10
StochK = 3
UpperLevel = 80
LowerLevel = 20

mystoch = Stochastic[StochN,StochK](customclose)

if not on and mystoch crosses under lowerlevel then
myopen = close
openindex = barindex
on = 1
endif

if on and mystoch crosses over upperlevel then
diff = close - myopen - spread
sdiff = myopen - close - spread
count = count + 1
if sdiff > 0 then
r = 128
g = 0
swin = swin + 1
endif
if diff > 0 then
r = 0
g = 128
lwin = lwin + 1
endif
ltotal = ltotal + diff
stotal = stotal + sdiff
lwinrate = round(((lwin/count)*100)*10)/10
swinrate = round(((swin/count)*100)*10)/10
lavgwin = round((ltotal/count)*10)/10
savgwin = round((stotal/count)*10)/10
ltotalr = round(ltotal*10)/10
stotalr = round(stotal*10)/10

drawsegment(openindex, myopen,barindex,close) coloured(r,g,0)

drawtext("G #ltotalr#",barindex,high+(average[500](high-low)/2)*4,SansSerif,Standard,12) coloured(0,128,0)
drawtext("AvgG #lavgwin#",barindex,high+(average[500](high-low)/2)*3,SansSerif,Standard,12) coloured(0,128,0)
drawtext("WR #lwinrate#%",barindex,high+(average[500](high-low)/2)*2,SansSerif,Standard,12) coloured(0,128,0)
drawtext("#diff#",barindex,high+(average[500](high-low)/2),SansSerif,Standard,12) coloured(0,128,0)
drawtext("#sdiff#",barindex,low-(average[500](high-low)/2),SansSerif,Standard,12) coloured(128,0,0)
drawtext("WR #swinrate#%",barindex,low-(average[500](high-low)/2)*2,SansSerif,Standard,12) coloured(128,0,0)
drawtext("AvgG #savgwin#",barindex,low-(average[500](high-low)/2)*3,SansSerif,Standard,12) coloured(128,0,0)
drawtext("G #stotalr#",barindex,low-(average[500](high-low)/2)*4,SansSerif,Standard,12) coloured(128,0,0)
on = 0
endif

return
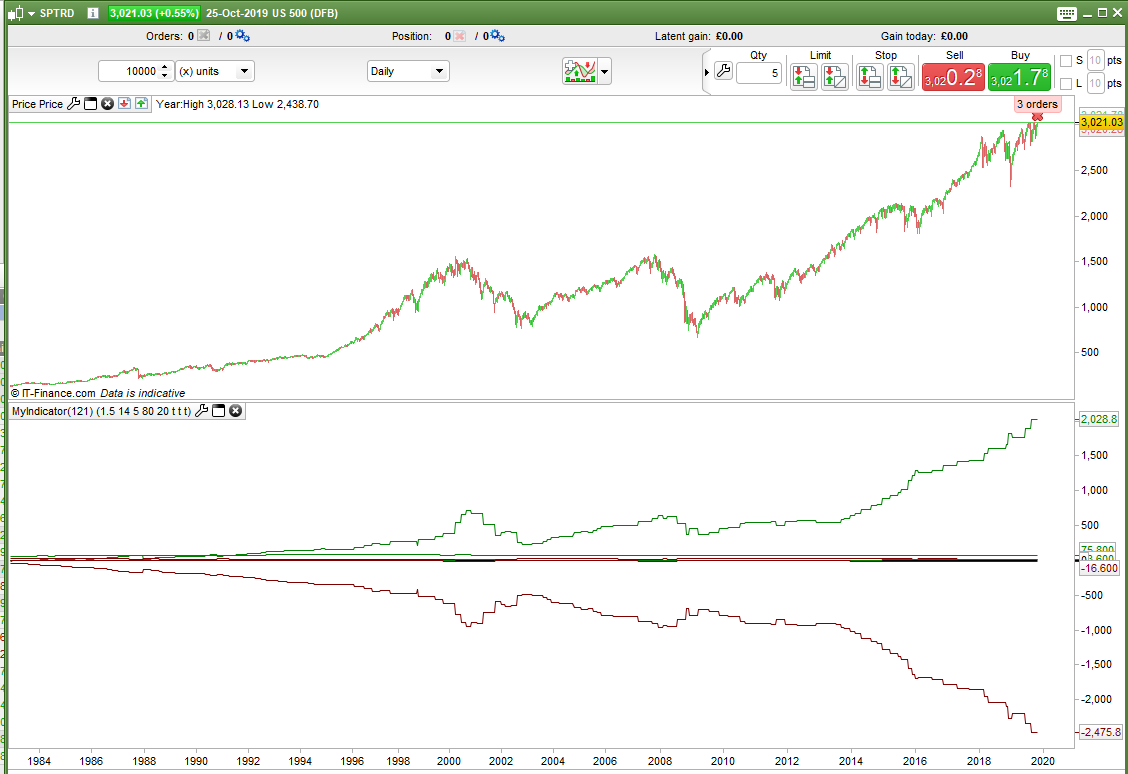
I also turned the code into a line chart to show the historical results. You can turn on or off which of the three line types are displayed.
Really it would be easier just to write a strategy to get all this same information but like I said I was bored!
DisplayTotal = 1 //0=off 1=on
DisplayWinRate = 1 //0=off 1=on
DisplayAvgGain = 1 //0=off 1=on

Spread = 1.5
StochN = 10
StochK = 3
UpperLevel = 80
LowerLevel = 20

mystoch = Stochastic[StochN,StochK](customclose)

if not on and mystoch crosses under lowerlevel then
myopen = close
on = 1
endif

if on and mystoch crosses over upperlevel then
diff = close - myopen - spread
sdiff = myopen - close - spread
count = count + 1
if sdiff > 0 then
swin = swin + 1
endif
if diff > 0 then
lwin = lwin + 1
endif

ltotal = ltotal + diff
stotal = stotal + sdiff
lwinrate = round(((lwin/count)*100)*10)/10
swinrate = round(((swin/count)*100)*10)/10
lavgwin = round((ltotal/count)*10)/10
savgwin = round((stotal/count)*10)/10
on = 0
endif

once ltotalr = undefined
once lwinrater = undefined
once lavgwinr = undefined
once stotalr = undefined
once swinrater = undefined
once savgwinr = undefined

if DisplayTotal then
ltotalr = ltotal
stotalr = stotal
endif

if DisplayWinRate then
lwinrater = lwinrate
swinrater = swinrate
endif

if DisplayAvgGain then
lavgwinr = lavgwin
savgwinr = savgwin
endif

return 0,ltotalr coloured(0,128,0) as "LGain",stotalr coloured(128,0,0) as "SGain",lwinrater coloured(0,128,0) as "LWR%", swinrater coloured(128,0,0) as "SWR%",lavgwinr coloured(0,128,0) as "LAvgG", savgwinr coloured(128,0,0) as "SAvgG"