Indicator help: Stochastic Momentum Index formula from Pro Real Time

Viewing 3 posts - 1 through 3 (of 3 total)

  • Author
    Posts
  • #244394 quote
    owengoweng
    Participant
    New

    Hi Folks!

    I am trying to write up some coding for an automated bot, and would love some assistance!

    Its for the Stochastic Momentum Index, the default settings, from the chart, when I go add indicator > see all indicators > Stochastic Momentum Index.

    I looked at the indicator from the prorealcode site and it doesn’t give me much information. I looked around for it and was unable to find a definitive solution as to what formula/code the chart on the platform is using.

    I was thinking the closest I could get was with williamblaus stochastic, but wasn’t quite matching up.

    If anyone can help me with this would be greatly appreciated!!

    Thanks

    stoch-image-2.png stoch-image-2.png
    #244418 quote
    robertogozzirobertogozzi
    Moderator
    Legend

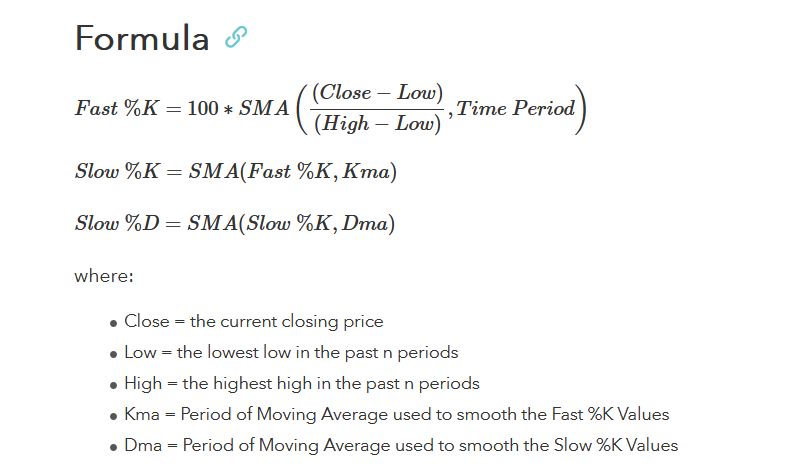
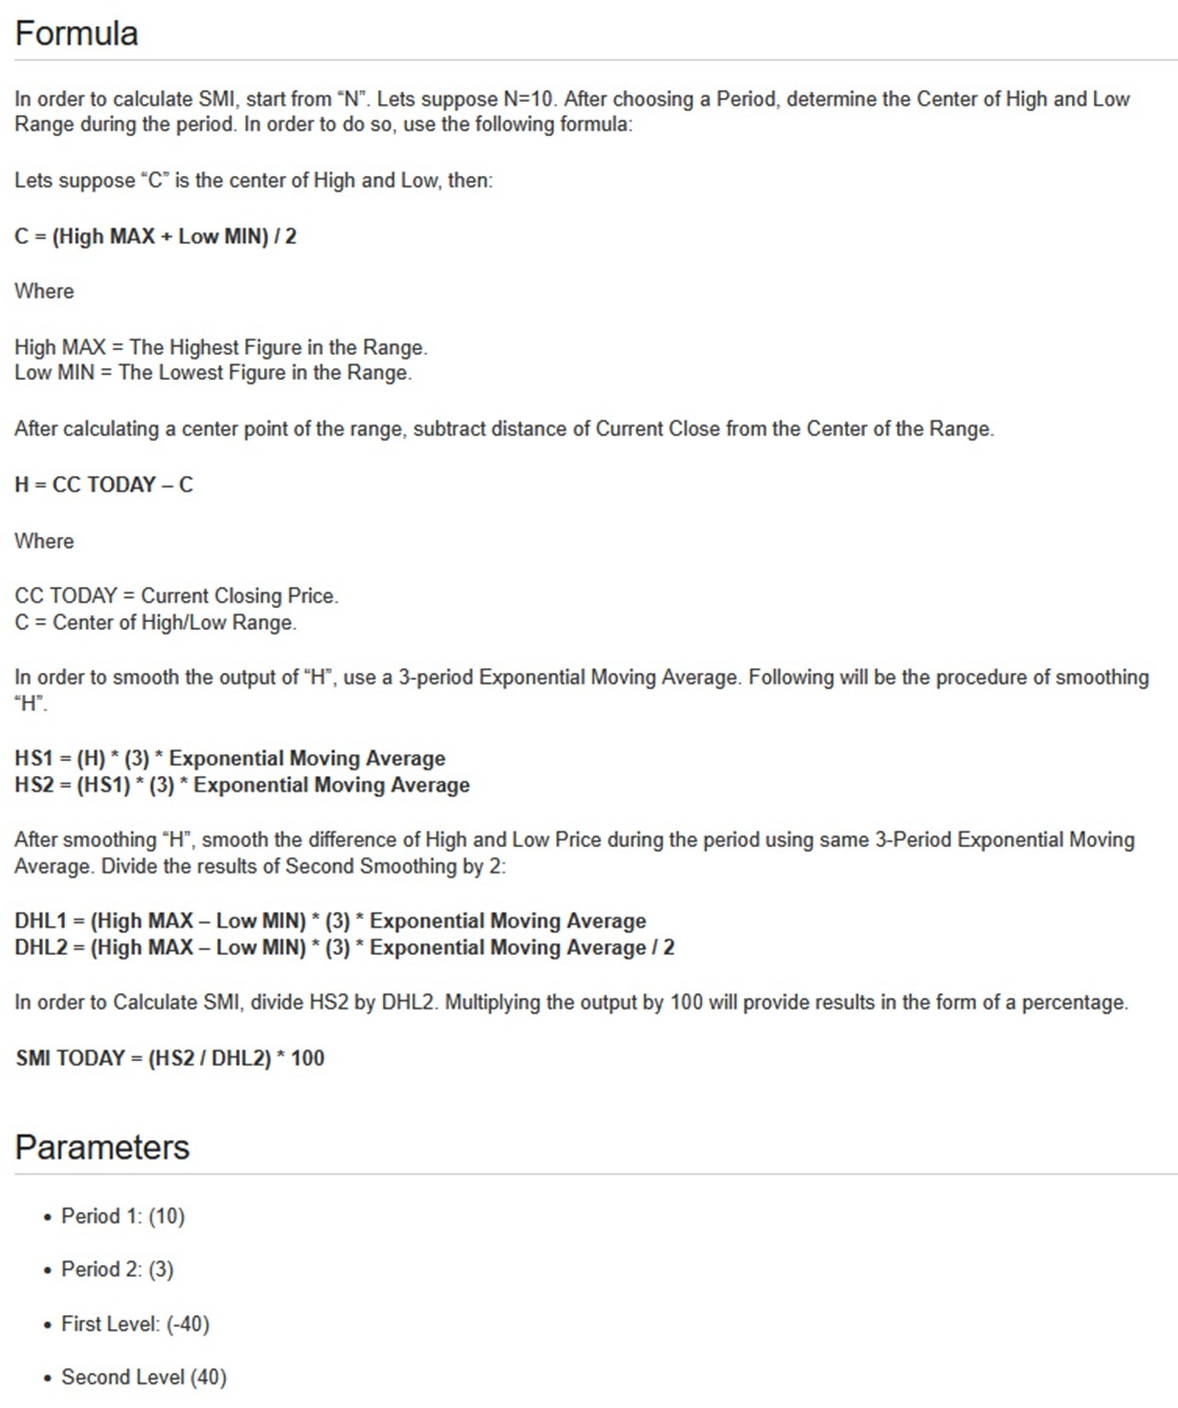
    Here are some definitions and formulas. See also the attached pics.

    Stochastic Momentum Index

    Investopedia:

    “The Stochastic Momentum Index (SMI) is a more refined version of the stochastic oscillator, employing a wider range of values and having a higher sensitivity to closing prices.

    The SMI is considered a refinement of the stochastic oscillator. It calculates the distance of the current closing price as it relates to the median of the high/low range of price. William Blau developed the SMI, which attempts to provide a more reliable indicator, less subject to false swings.

    The SMI has a normal range of values between +100 and -100. When the present closing price is higher than the median, or midpoint value of the high/low range, the resulting value is positive. When the current closing price is lower than that of the midpoint of the high/low range, the SMI has a negative value.

    Like the stochastic oscillator, the SMI is primarily used by traders or analysts to indicate overbought or oversold conditions in a market. It is used with volume indicators to show if the momentum carries significant selling or buying pressure.

    Traders also use the SMI as a general trend indicator, interpreting values above 40 as indicative of a bullish trend and negative values greater than -40 as showing a bearish trend.”

    TrendSpider:

    “The SMI is calculated similarly to the stochastic oscillator but uses a broader range of values and is more sensitive to closing prices. The SMI is calculated by taking the difference between the current closing price and the median high/low price range over a specified period. This difference is then divided by the absolute value of the high/low range and multiplied by 100.

    The SMI generates two lines: the SMI line and the signal line. The SMI line represents the momentum of the asset’s price, while the signal line is a moving average of the SMI line, typically calculated over three days.”

    Tradingview:

    “Calculation

    First, we calculate the highest and lowest values in the window (defined by the “%K Length” input in the indicator settings). We subtract their average from the current close to get the “relativeRange” of those values:

    highestLowestRange = highestHigh – lowestLow

    relativeRange = close – (highestHigh + lowestLow) / 2

    After that, we calculate the SMI value, which can be calculated with the following formula:

    smi = 200 * (emaEma(relativeRange, lengthD) / emaEma(highestLowestRange, lengthD))

    Where ‘lengthD’ is the value from the “%D Length” input in the indicator’s settings, and “emaEma” is an Exponential Moving Average of an Exponential Moving Average (both calculated with the same length):

    emaEma(source, length) => ta.ema(ta.ema(source, length), length)”

    Iván González thanked this post
    TradingTechnologies-SMI.jpg TradingTechnologies-SMI.jpg BarChartTraders-SMI.jpg BarChartTraders-SMI.jpg
    #244421 quote
    robertogozzirobertogozzi
    Moderator
    Legend

    This is my custom SMI:

    // SMI Stochastic Momentum Index oscillator custom
    //
    // https://www.stockmaniacs.net/stochastic-momentum-index-indicator/
    // https://www.youtube.com/watch?app=desktop&v=dDFewKqNDfU
    // https://www.stockmaniacs.net/stochastic-momentum-index-indicator/
    // https://www.youtube.com/watch?v=tg1pQfXFNiw
    //
    ONCE Periodi          = 14
    ONCE Smooth1          = 3
    ONCE Smooth2          = 5
    ONCE Smooth3          = 6
    ONCE TipoMedia        = 1
    ONCE TipoMediaSegnale = 0
    //
    Cx     = (highest[Periodi](high) + lowest[Periodi](low)) / 2
    Hx     = CustomClose - Cx
    //
    H1     = Average[Smooth1,TipoMedia](Hx)
    H2     = Average[Smooth2,TipoMedia](H1)
    //
    D1     = Average[Smooth1,TipoMedia](highest[Periodi](high) - lowest[Periodi](low))
    D2     = Average[Smooth2,TipoMedia](D1)
    D3     = D2 / 2
    //
    MySMI  = (H2 / D3) * 100
    Signal = Average[Smooth3,TipoMediaSegnale](MySMI)
    //
    RETURN MySMI AS "Stochastic Momentum",Signal AS "Segnale"
    Iván González, oweng and Musiar thanked this post
    SMI-Stochastic-Momentum-Index.itf
Viewing 3 posts - 1 through 3 (of 3 total)

  • You must be logged in to reply to this topic.

ProRealAI ProRealAI New

Stuck on this ProBuilder code?

Describe what this topic is trying to build, in plain English, and ProRealAI writes the ProRealTime™ indicator, screener or system for you.

Available in 7 languages
Try ProRealAI

Indicator help: Stochastic Momentum Index formula from Pro Real Time


ProBuilder: Indicators & Custom Tools

New Reply
Author
author-avatar
oweng @oweng Participant
Summary

This topic contains 2 replies,
has 2 voices, and was last updated by robertogozzirobertogozzi
1 year, 6 months ago.

Topic Details
Forum: ProBuilder: Indicators & Custom Tools
Language: English
Started: 02/27/2025
Status: Active
Attachments: 4 files
ProRealCode ProRealCode
Loading...